3756
Hemodynamic response of white matter to event-related functional tasks1Vanderbilt University Institute of Imaging Science, Nashville, TN, United States
Synopsis
There is increasing evidence that white matter (WM) elicits robust blood oxygenation level-dependent (BOLD) responses to
Introduction
Methods
Twenty healthy and right-handed individuals (10M / 10F; age, 29.1 ± 8.8 yrs) were recruited. A 3T Philips Achieva scanner with a 32-channel head array coil, was used in this study. The fMRI images were acquired from these subjects with TR =2 s, TE = 35 ms, SENSE factor = 2, matrix size = 80 × 80, FOV =240 × 240 mm2, 34 slices of 4 mm thickness with a 0.5 mm gap, and 200 dynamics. To reconstruct white matter tracts, diffusion-weighted MR images were acquired using a multi-shot, echo-planar imaging (EPI) sequence with b =1000 s/mm2, 32 diffusion-sensitizing directions, TR = 4.5 s, TE = 84 ms, matrix size=112 × 112 × 68, and voxel size =2 × 2 × 2 mm3.
We performed an event-related Stroop task to study the hemodynamic response of specific WM pathways. First, a number of activated GM clusters were identified using generalized linear model (GLM) along with the canonical input HRF. Second, WM tracts, if existing, were reconstructed by a DTI tractography approach between each pair of activated clusters. Finally, the hemodynamic time courses within specific WM tracts were averaged across subjects and evaluated.
Results
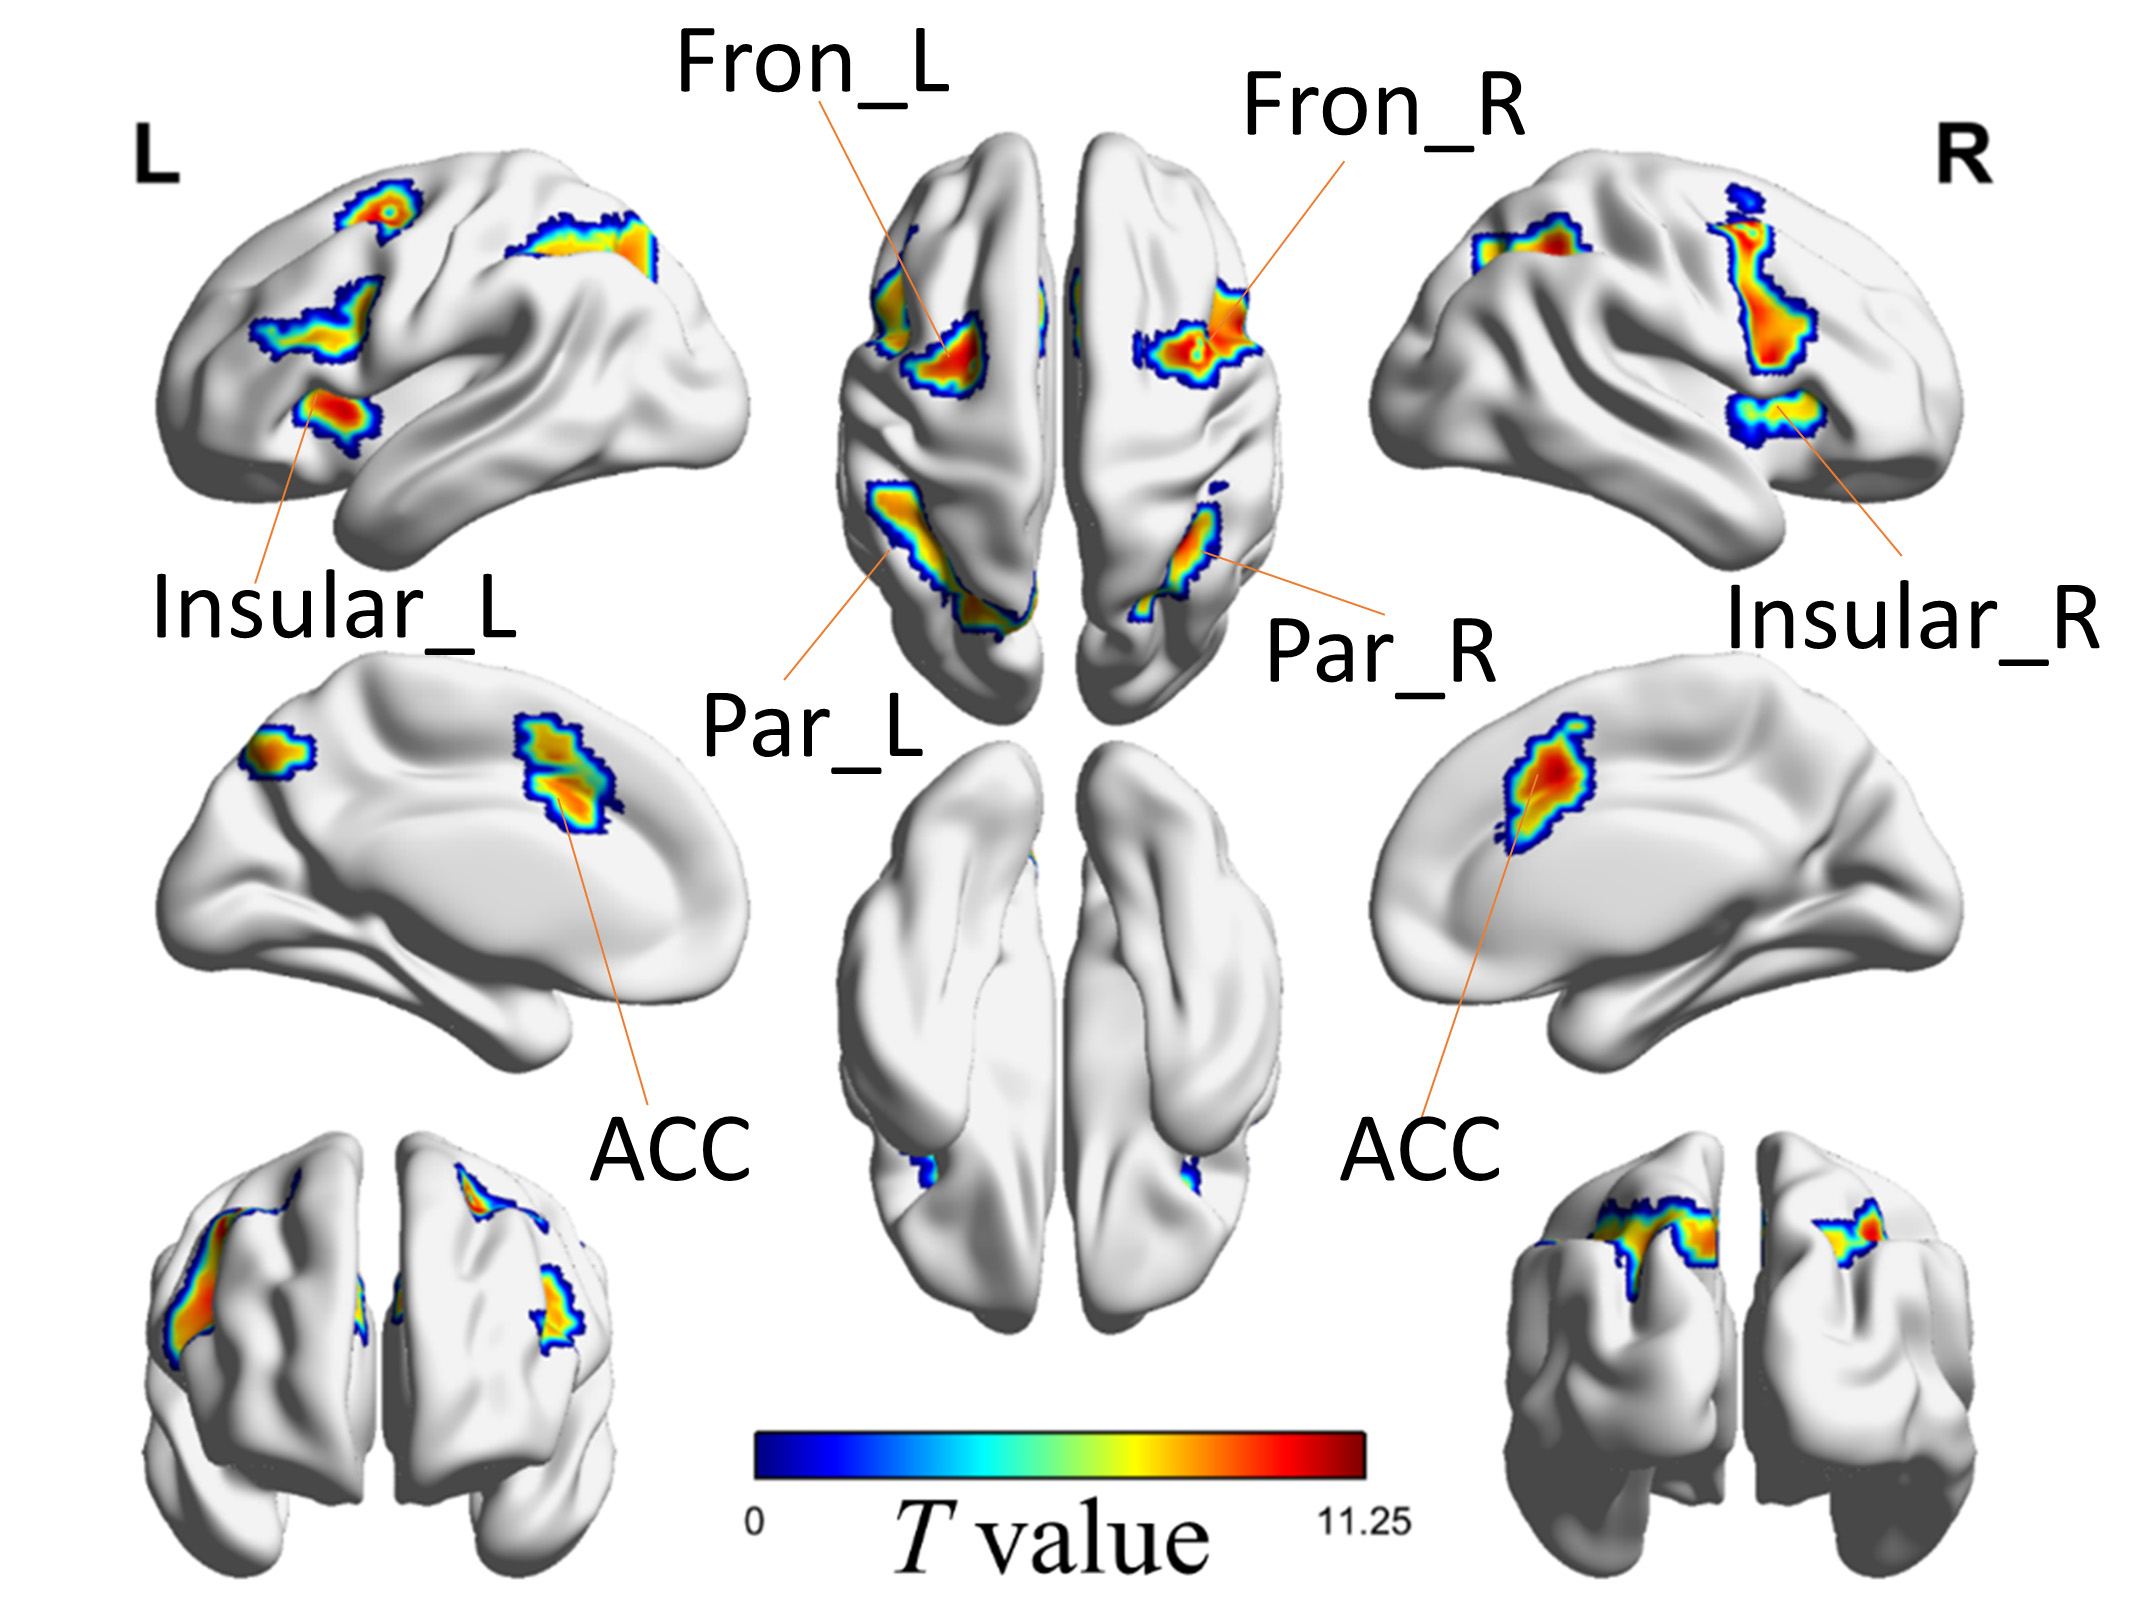
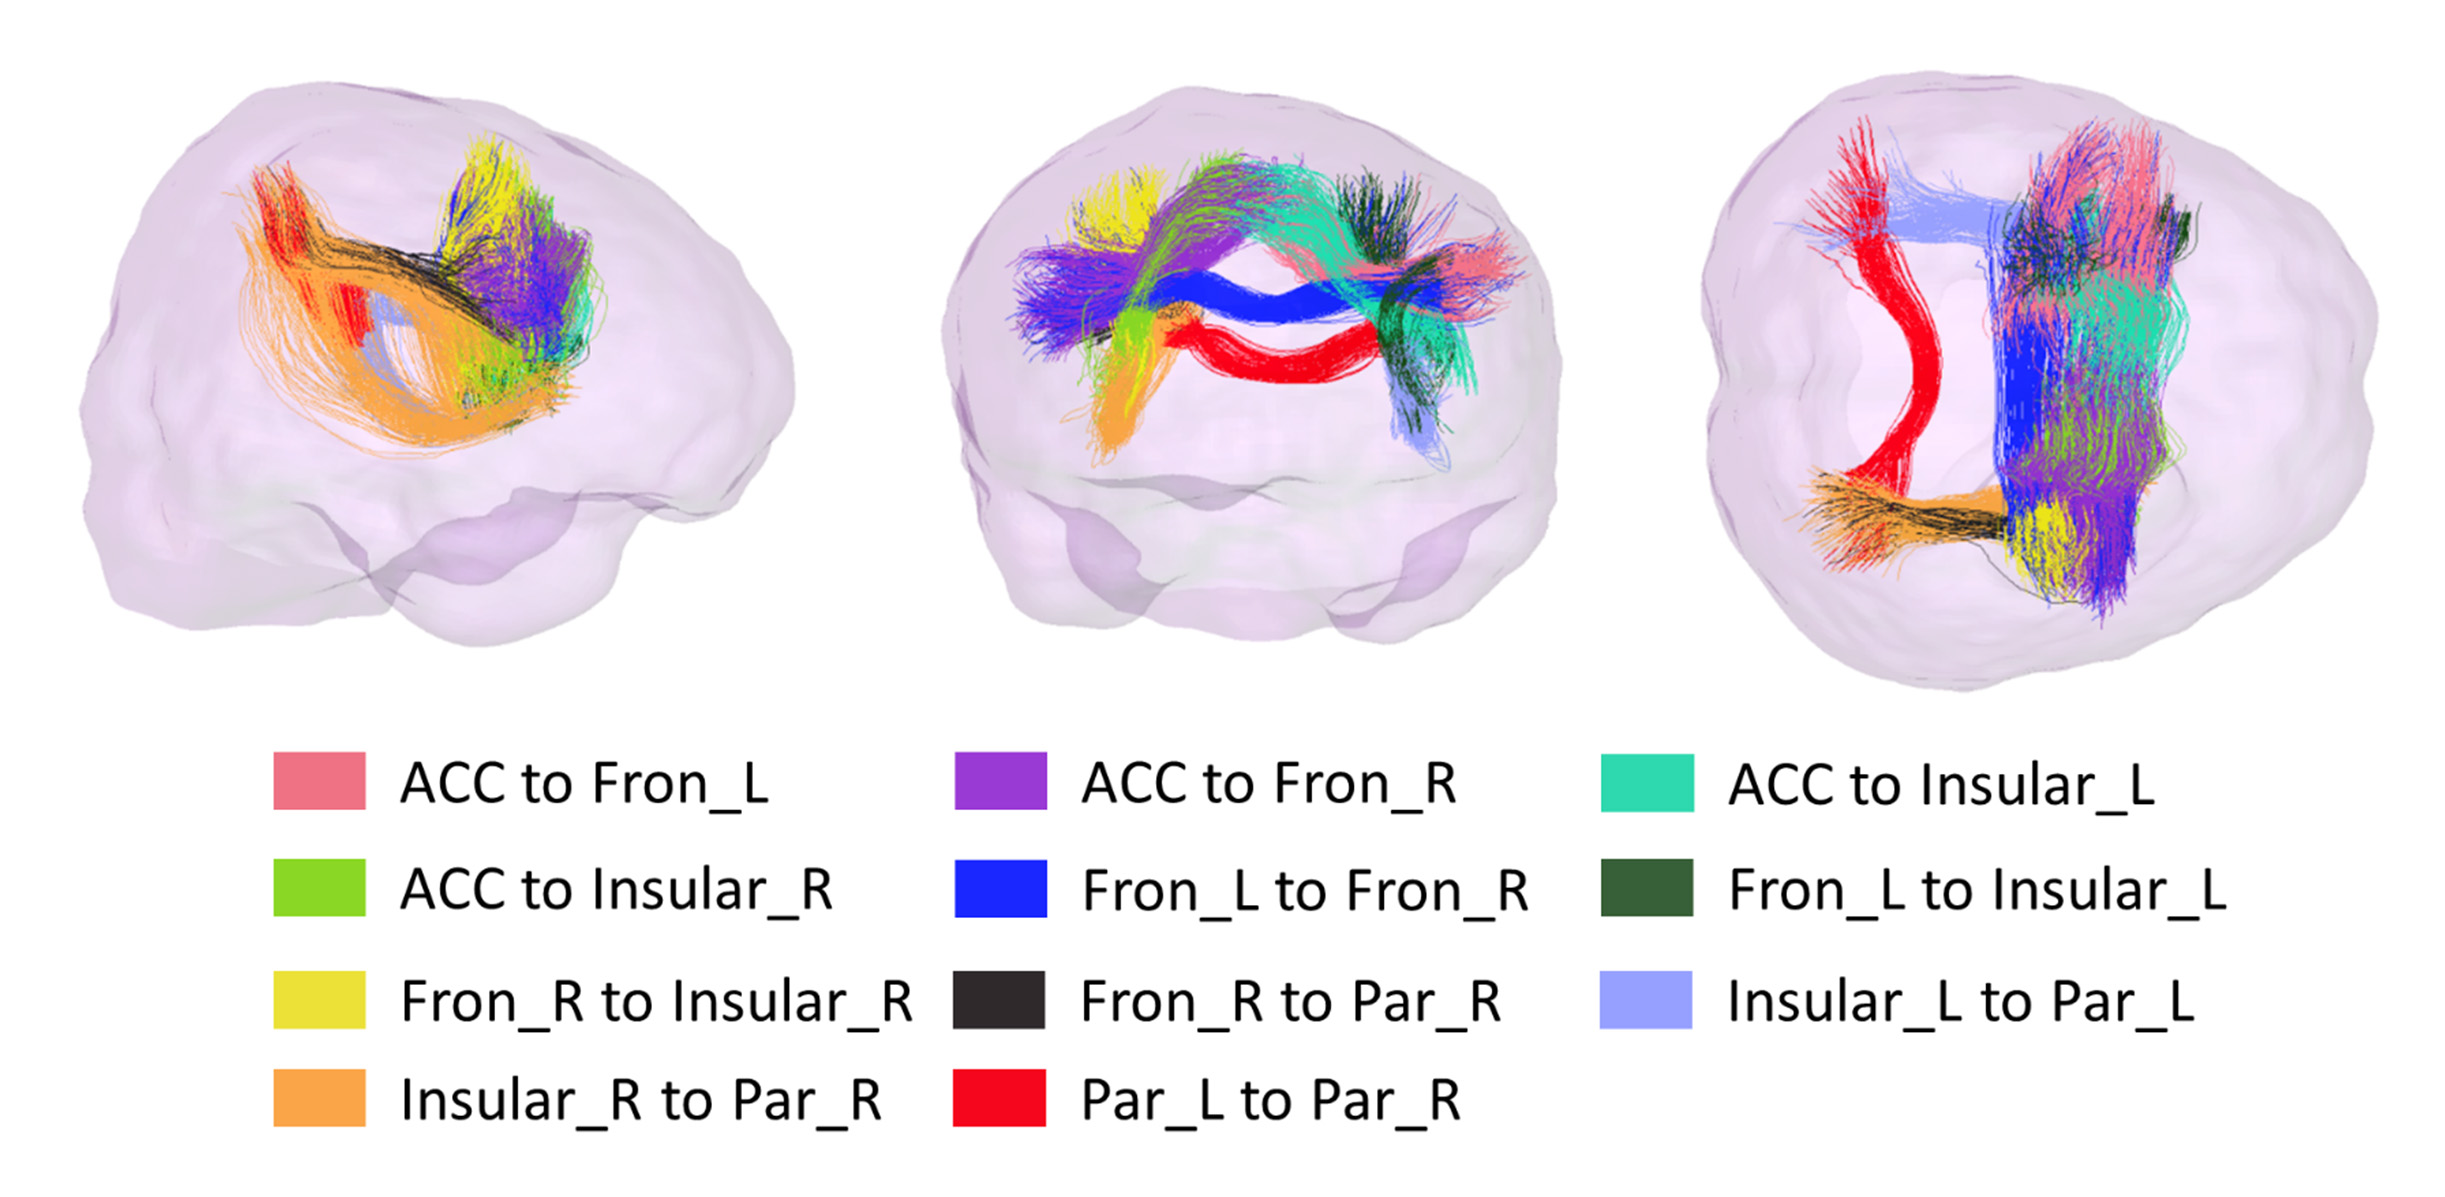
As shown in Figure 1, seven major activated GM clusters were detected (P<0.05, FWE corrected) by contrasting the incongruent events against congruent events across the population. Each cluster was identified by a name that represented the anatomical structure it overlapped with the highest probability. Among 21 possible routes connecting the seven GM clusters, 11 WM tracts (Figure 2) were reproducibly reconstructed by DTI tractography across all the subjects.
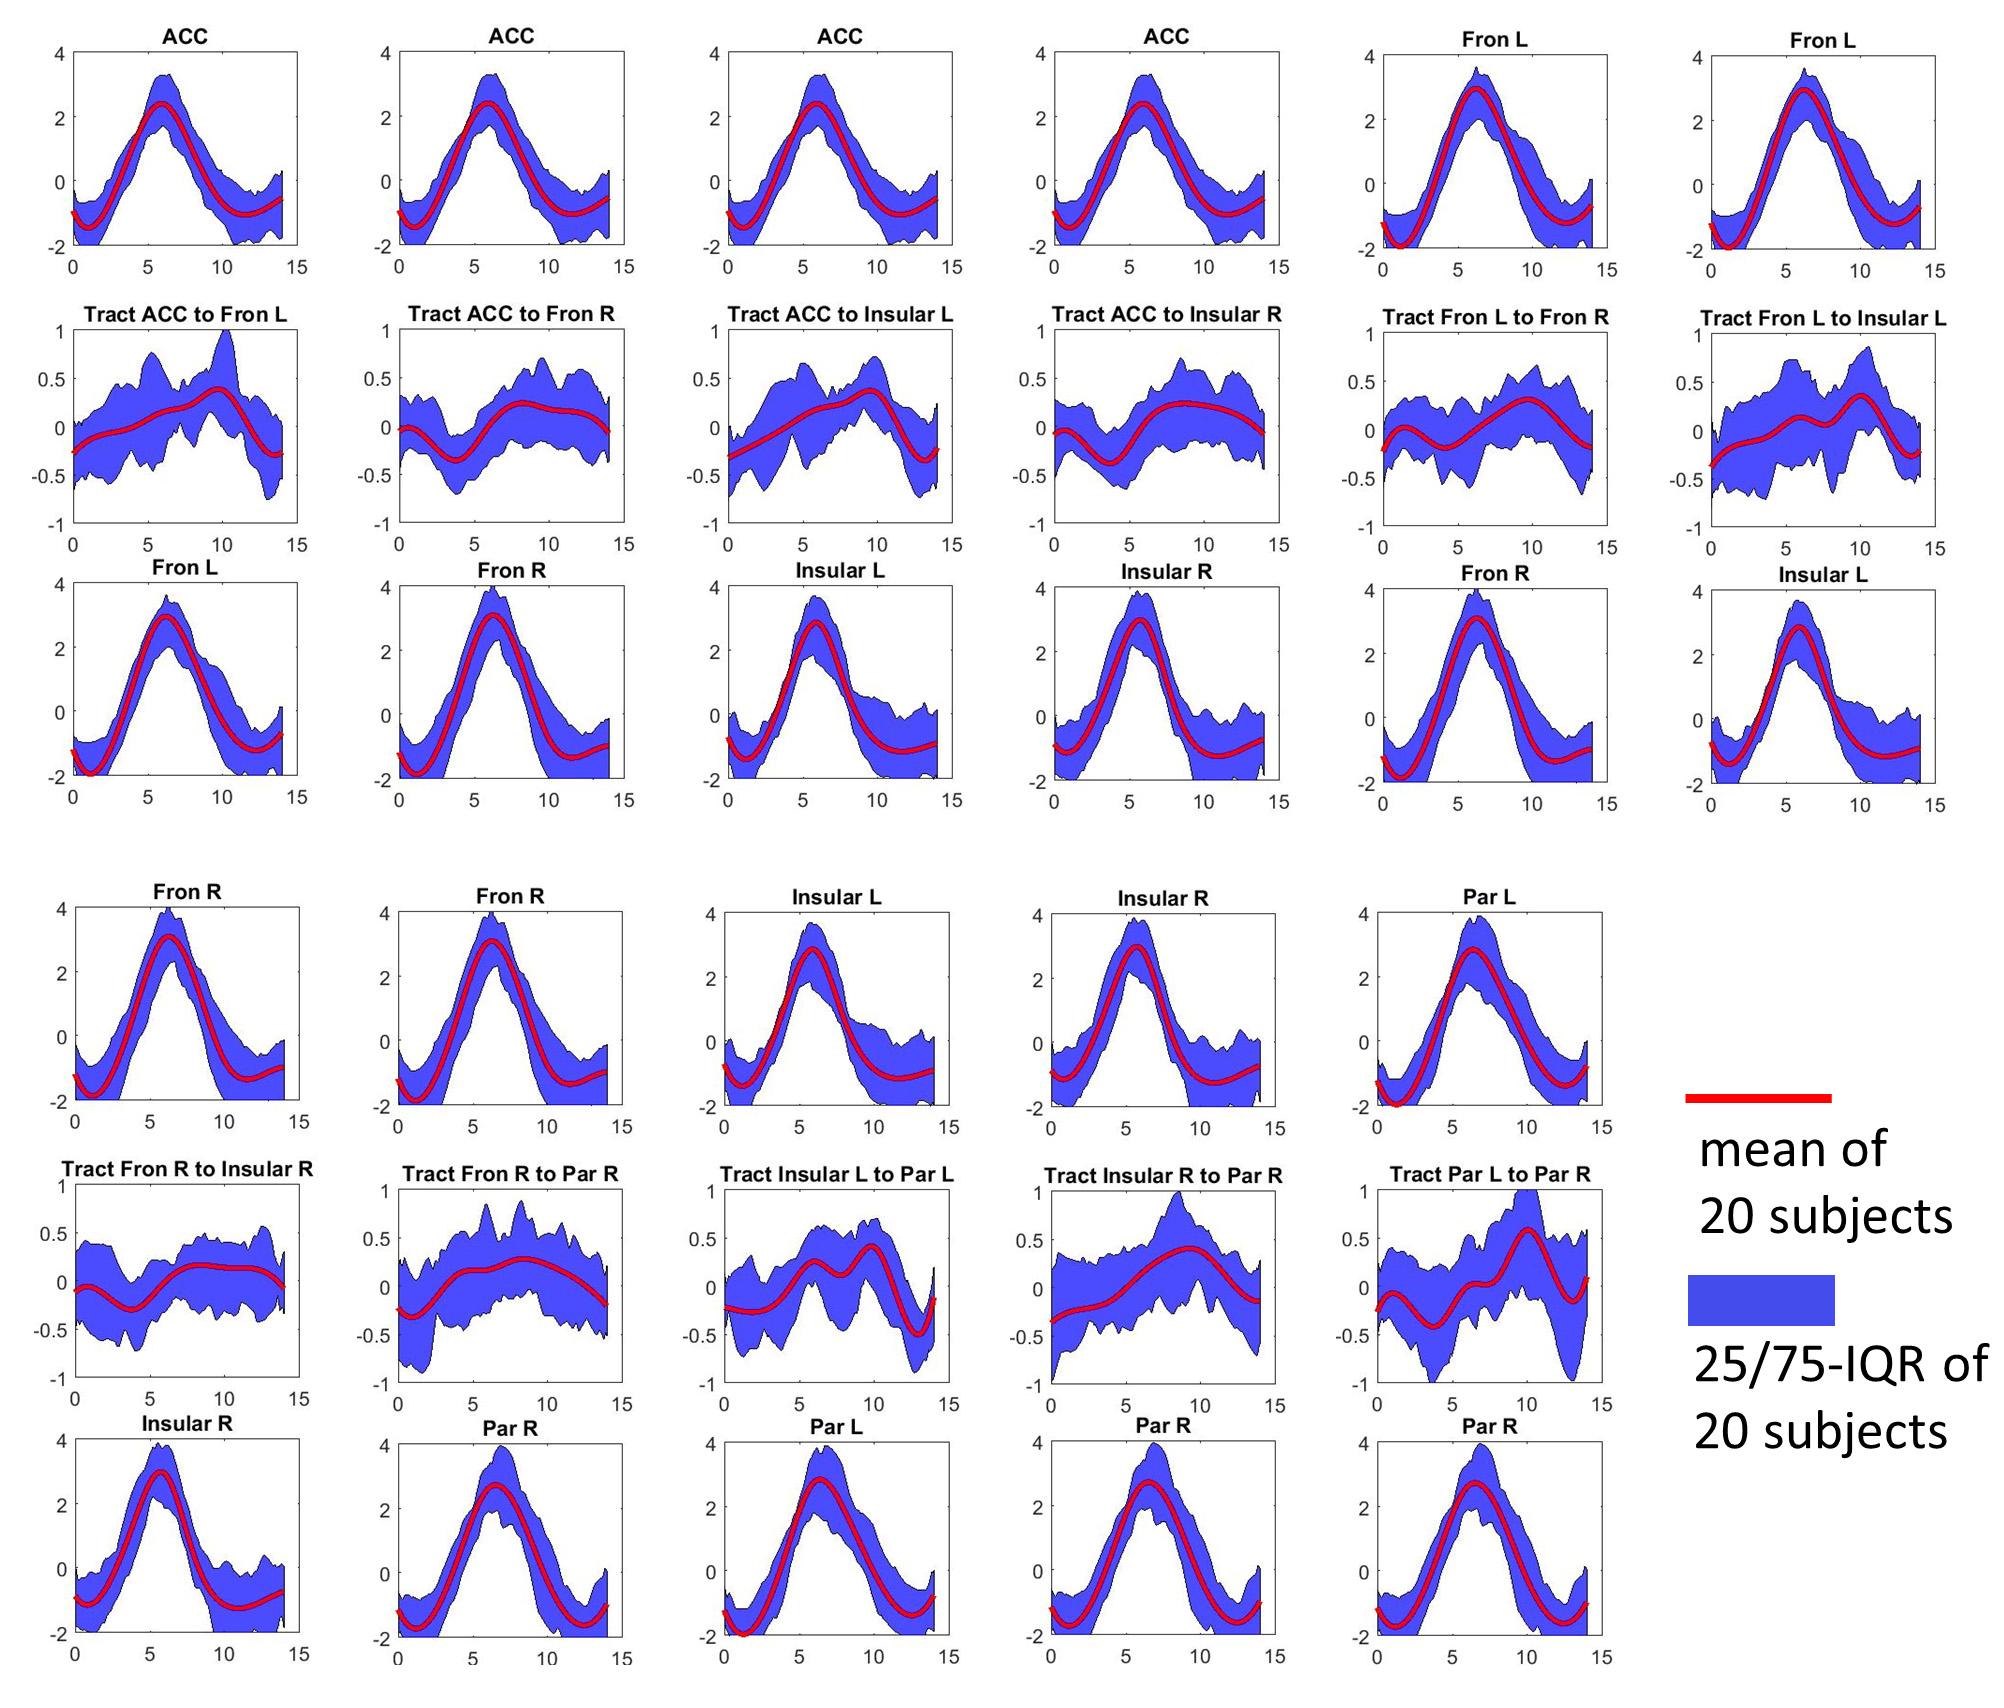
In Figure 3, the time course of a WM tract is displayed in the center of each panel with the time courses of the GM clusters that it connects vertically aligned at the top and bottom. The time courses of the seven GM clusters were similar to one another, with the peak arising at 6.14 ± 0.29 s. In contrast, the WM tracts demonstrated delayed responses which ranged from 8.57 to 9.97 s. The averaged peak magnitude of the signal intensity in GM clusters was 2.84 ± 0.22 (a.u.), which was approximately 7.4 times higher than that of WM tracts (0.34 ± 0.11 (a.u.)).
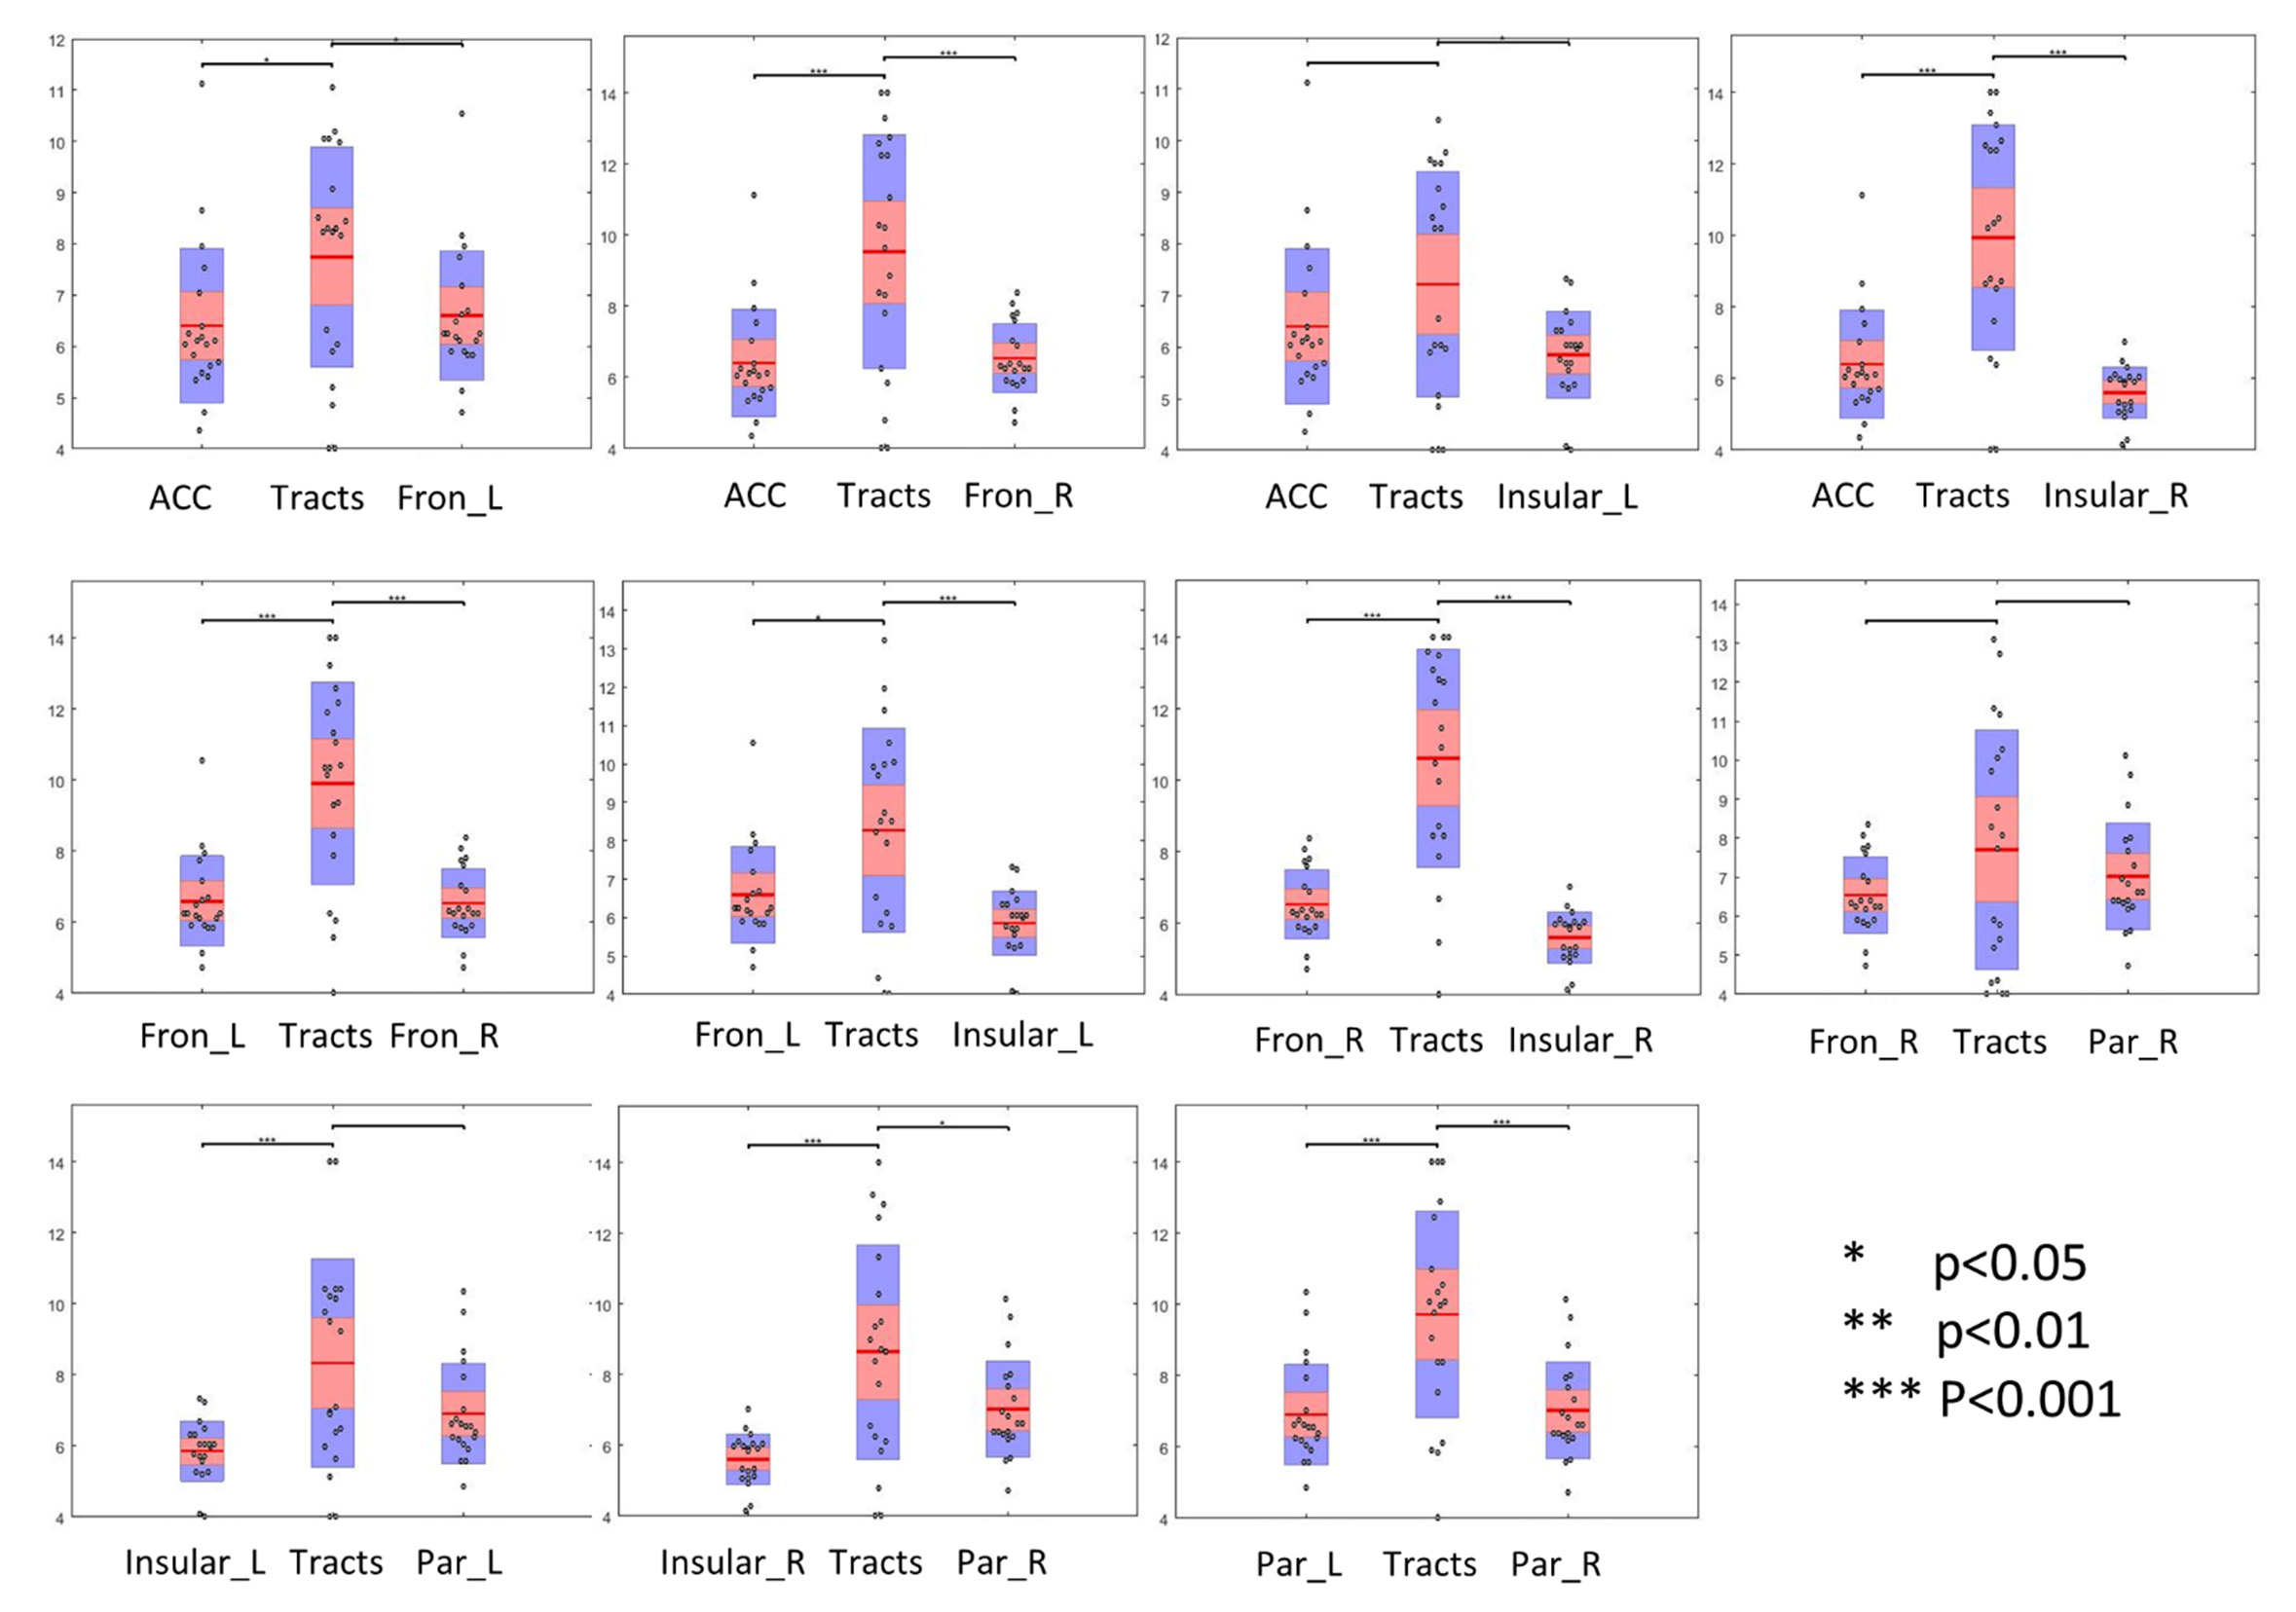
For each WM tract, the TTP was compared with its connecting GM clusters using a t-test across the population. In Figure 4, the average TTP of one WM tract is displayed in the center of each panel with the average TTP of its connecting GM clusters on either side. It can be observed that 8 of 11 tracts required a significantly longer time to reach the peak response in comparison with their connecting GM clusters.
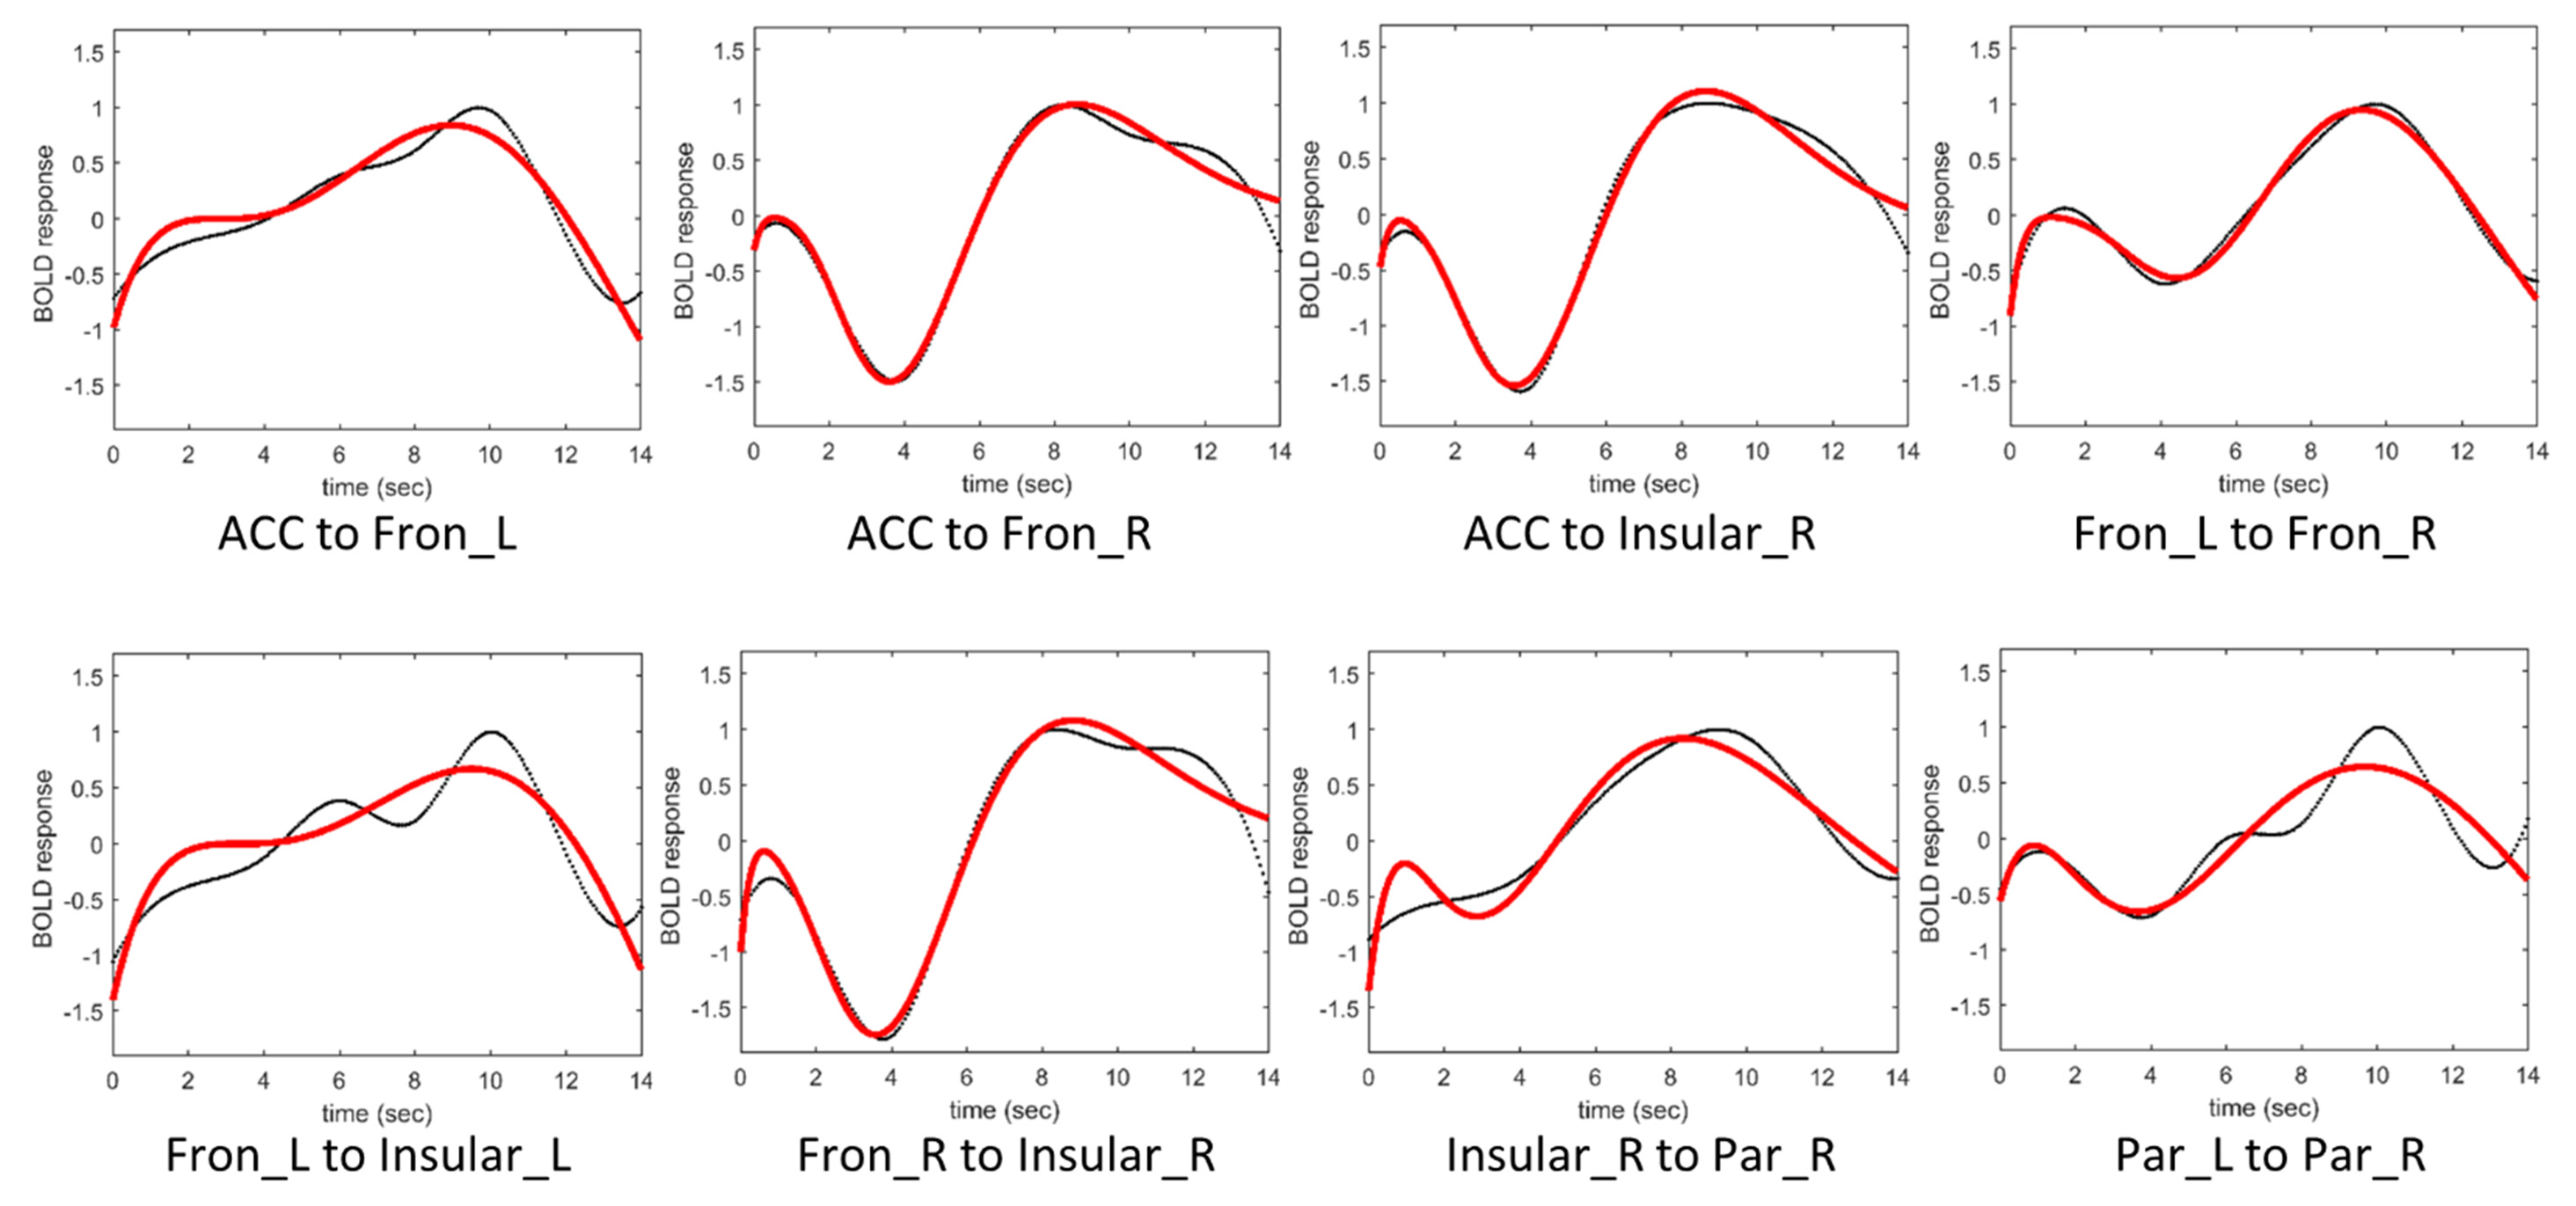
We used a balloon model-based function to fit the average time courses of the WM tracts that were delayed relative to their connecting GM clusters. The fitted data are displayed in Figure 5. These curves, most of which showed pronounced apparent initial dips, were well-fit by two gamma functions after the introduction of time delays into the first term.
Discussion
In this study, we evaluated the HRF of the WM tracts that were structurally connected with the activated GM clusters evoked by a Stroop task. We observed strong task-specific HRFs with significantly reduced magnitudes and increased TTPs in WM tracts compared with their connected GM clusters. Moreover, some WM tracts exhibited prolonged initial dips in their HRFs, which were presumably due to longer-lasting period of oxygen extraction before the vessels could supply sufficient oxygenated blood to meet the regional metabolic demand in WM. Together, these findings, again, demonstrate the detectability of neural activities in WM, and more importantly, reveal the nature of WM HRFs which agrees with the underlying neurovascular mechanism.Acknowledgements
This work was supported by NIH grant R01 NS093669 (J.C.G).References
1. Ding, Z. et al. Detection of synchronous brain activity in white matter tracts at rest and under functional loading. Proc Natl Acad Sci USA. 115, 1–6 (2017).
2. Ding, Z. et al. Spatio-temporal correlation tensors reveal functional structure in human brain. PLoS One 8, (2013).
3. Ding, Z. et al. Visualizing functional pathways in the human brain using correlation tensors and magnetic resonance imaging. Magn. Reson. Imaging 34, 8–17 (2016).
Figures