3755
Blocking AQP4 channels impacts BOLD fMRI but not Diffusion fMRI response patterns induced by visual stimulation1NeuroSpin, CEA, Saclay, France
Synopsis
We compared BOLD and Diffusion fMRI mouse brain maps obtained through visual stimulation before and after TGN-020 administration, an AQP4 receptor antagonist and astrocyte swelling inhibitor. Activations were observed in the primary visual cortex and the superior colliculus with both methods. BOLD signal changes were significantly increased after AQP4 inhibition, while the DfMRI signals were not affected. These results suggest that the DfMRI signal does not originate from astrocyte swelling.
INTRODUCTION
Diffusion functional MRI (DfMRI) has been proposed as an alternative to BOLD fMRI to monitor neural activity noninvasively1. The hypothetical contrast mechanism of DfMRI is thought to directly reflect neural activity through induced cell swelling2, while BOLD fMRI relies on the indirect neurovascular coupling mechanism. Indeed, previous studies reporting differential responses between DfMRI and BOLD fMRI under pharmacological challenges involving a neurovascular-coupling inhibitor3 and a specific neuronal swelling blocker4 have shown that the DfMRI response was not of vascular origin, but linked to activation induced neuronal swelling. In this study, we investigated the contribution of astrocytes to the BOLD fMRI and DfMRI responses using an aquaporin 4 (AQP4) channel antagonist (TGN-020). AQP4 channels are not expressed on neurons but are present on astrocyte membranes, controlling the astrocyte volume. TGN-020 has been shown to interfere with BOLD fMRI5.METHODS
The MRI experiments were performed on 9 adult mice (C57BL/6J, male, 20-24 g) using a 17.2T MRI system equipped with a quadrature volume coil and a 1T/m gradient system. The DfMRI signals were acquired using a diffusion-weighted twice refocused spin echo (SE)-EPI sequence: TE = 24.5 ms, TR = 2000ms (time resolution), 1 average, resolution: 200× 200 × 500 μm3, 16 slices, FOV = 15 x 15 mm2, b-values = 1000, 1800 s/mm2, 180 repetitions (6min acquisition time). The SE-BOLD signals were acquired using the same SE-EPI sequence and parameters as for DfMRI but with for b-value = 0.
First, a first series of visual stimulation BOLD and DfMRI images were acquired under medetomidine anesthesia (0.2 mg/kg). Then TGN-020, an AQP4 channel inhibitor5, was administrated (200 mg/kg i.p.) and, after a 15-30 minutes interval, a second series of BOLD and DfMRI images were acquired. The visual stimulation paradigm consisted of 20 seconds activation using a blue LED (2 Hz, 10ms)6 followed by 40 seconds rest repeated 6 times for a total of 6 minutes. The respiratory cycle was monitored during scanning and the body temperature was maintained at 37 °C using circulating hot water.
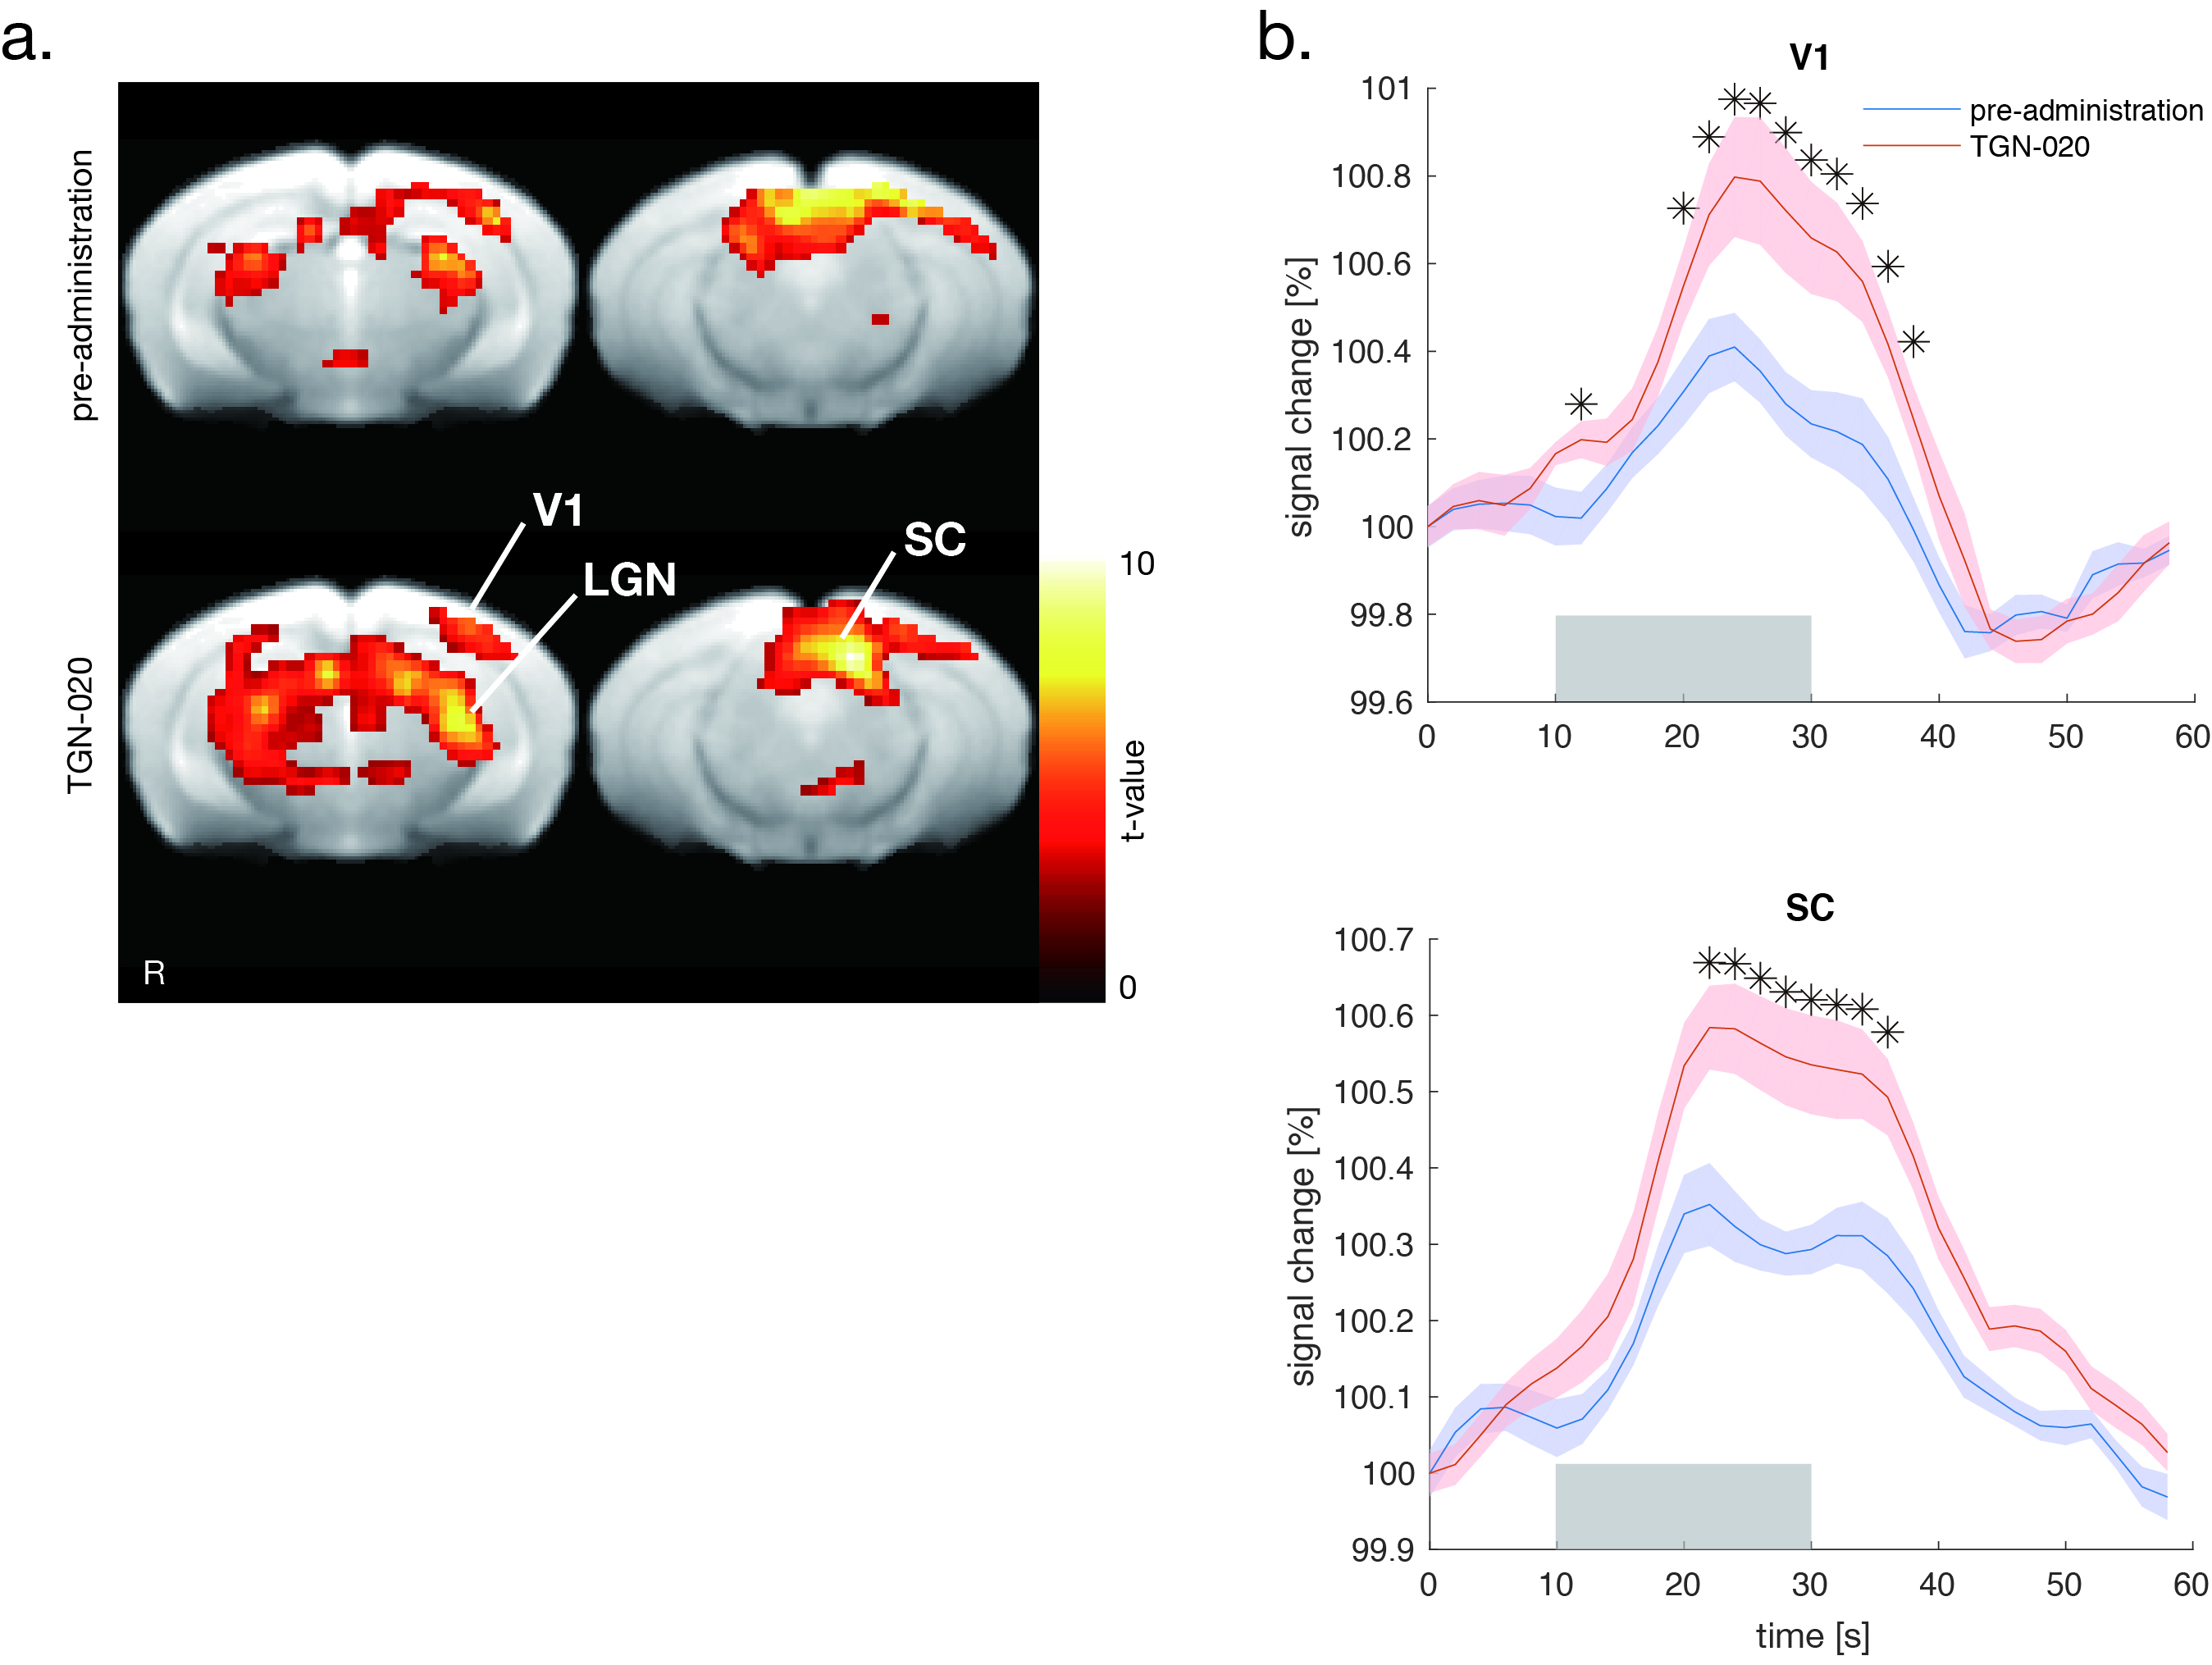
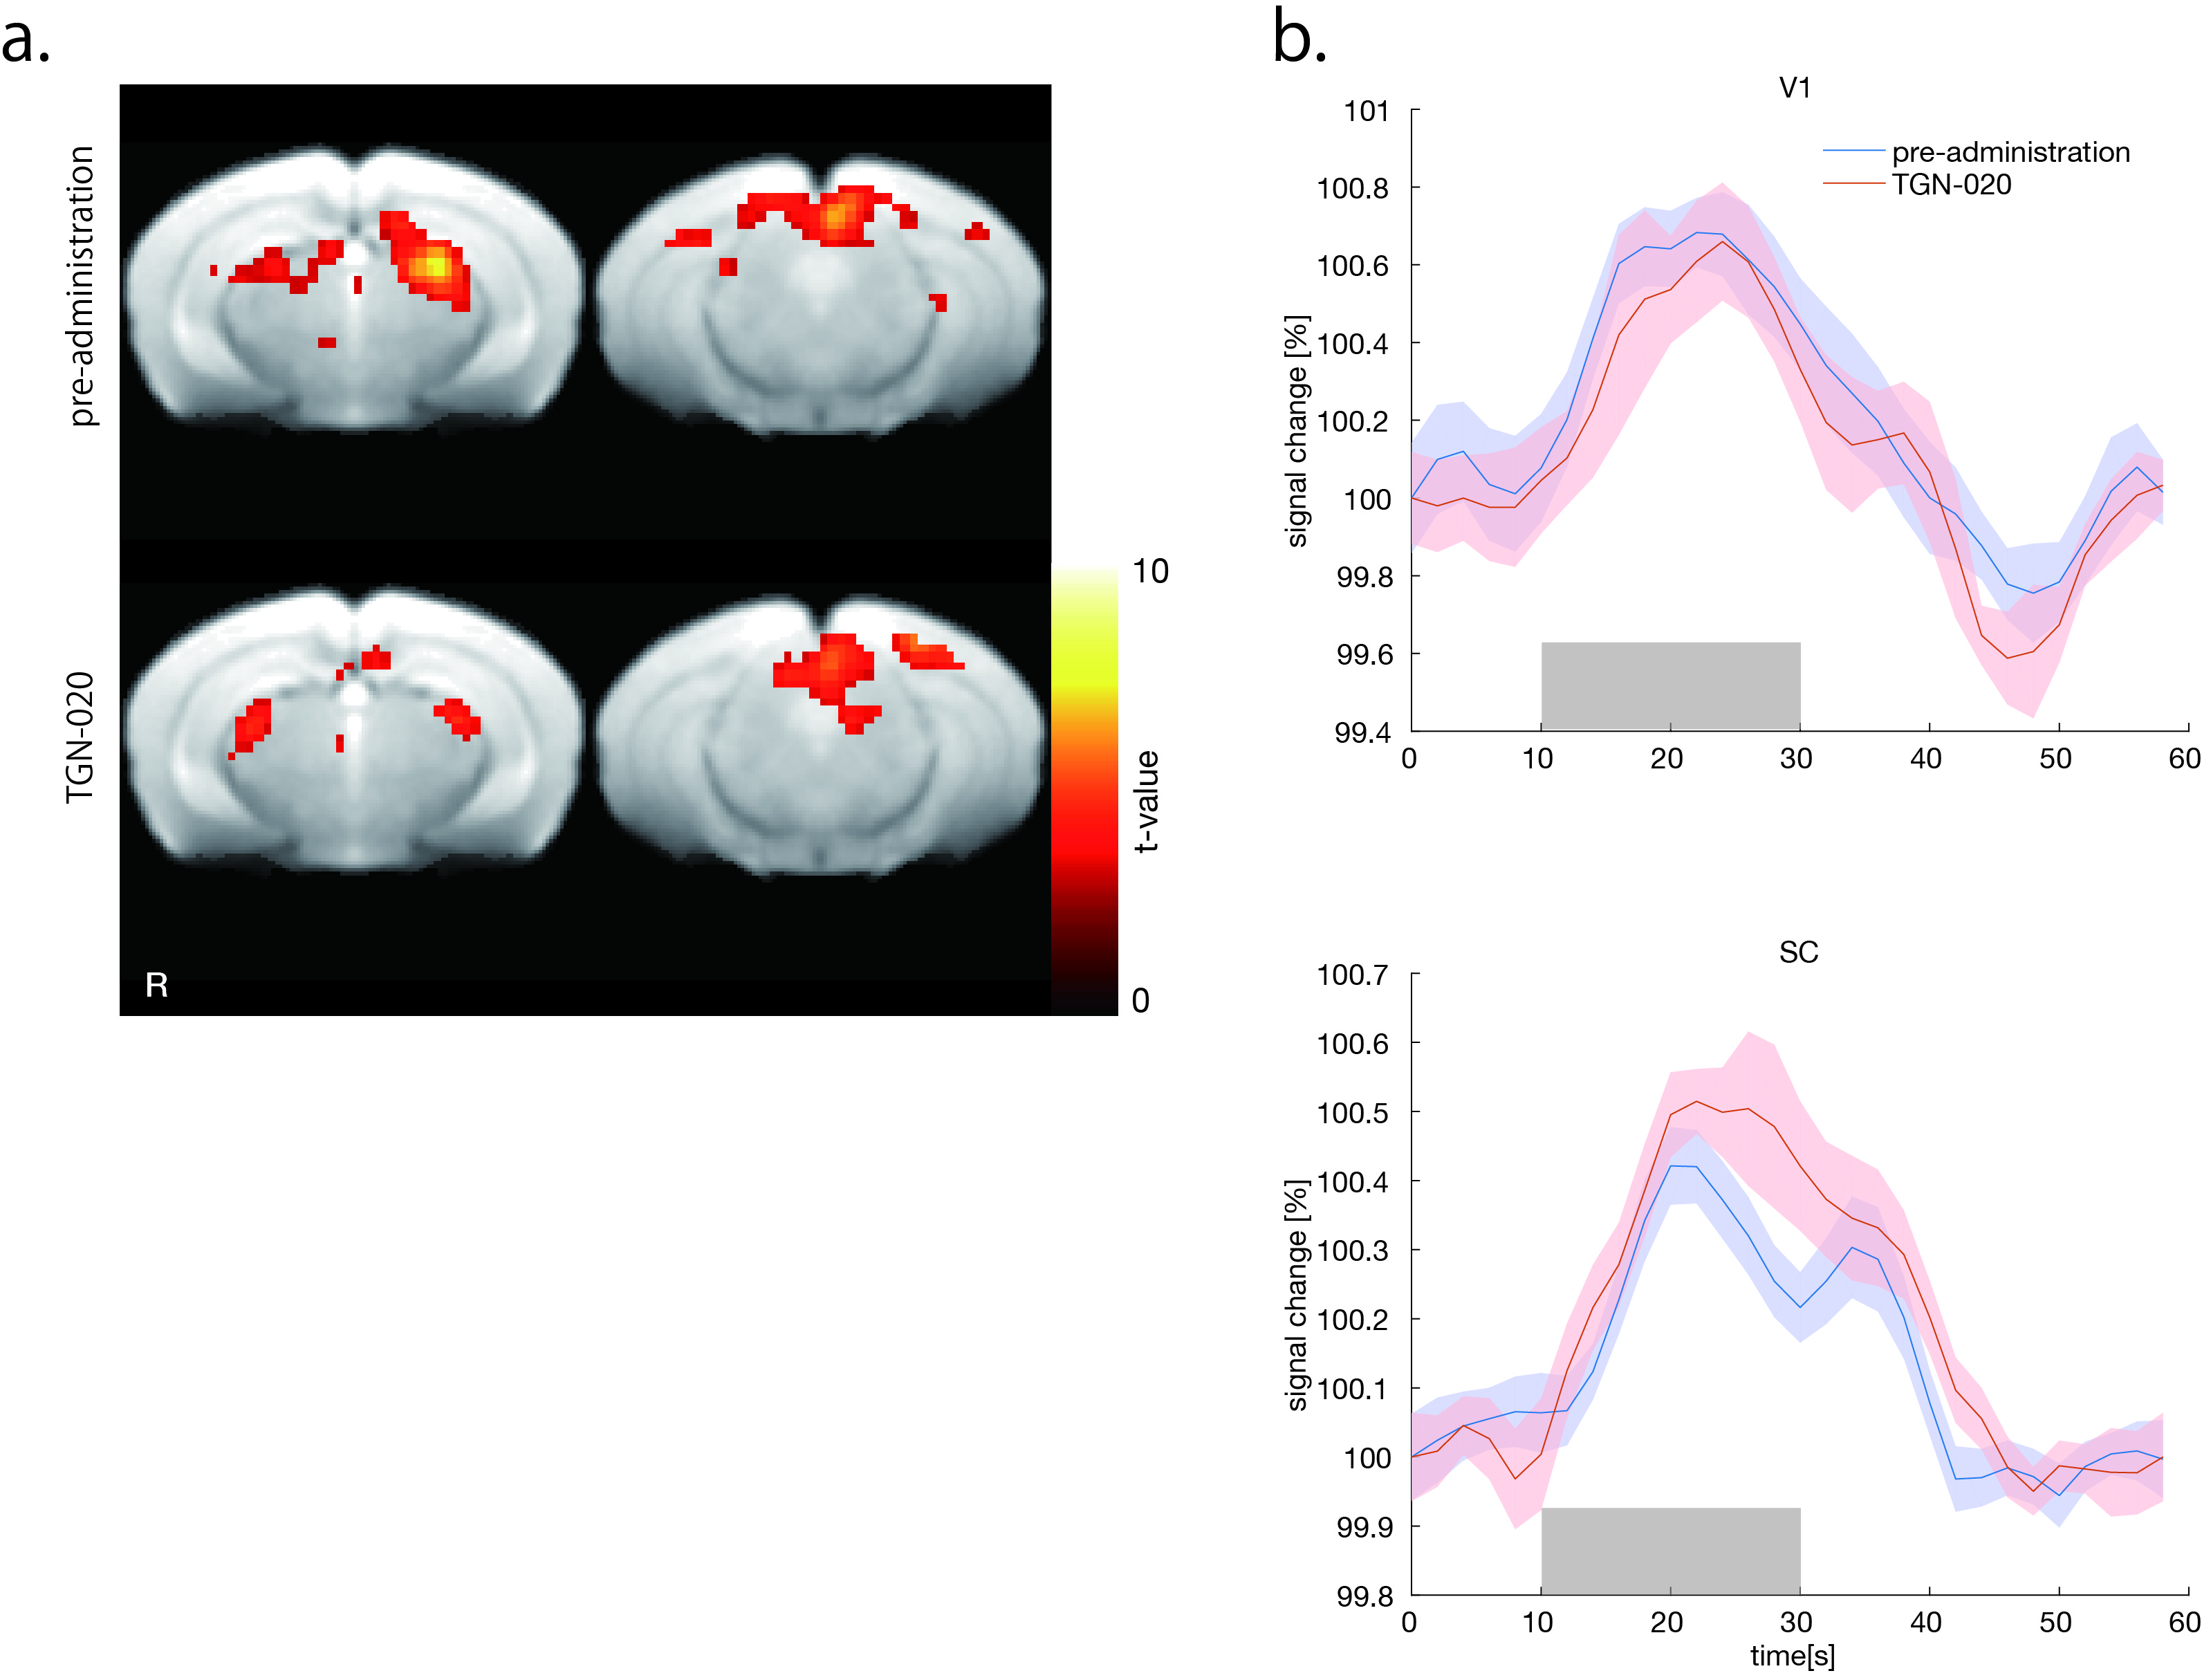
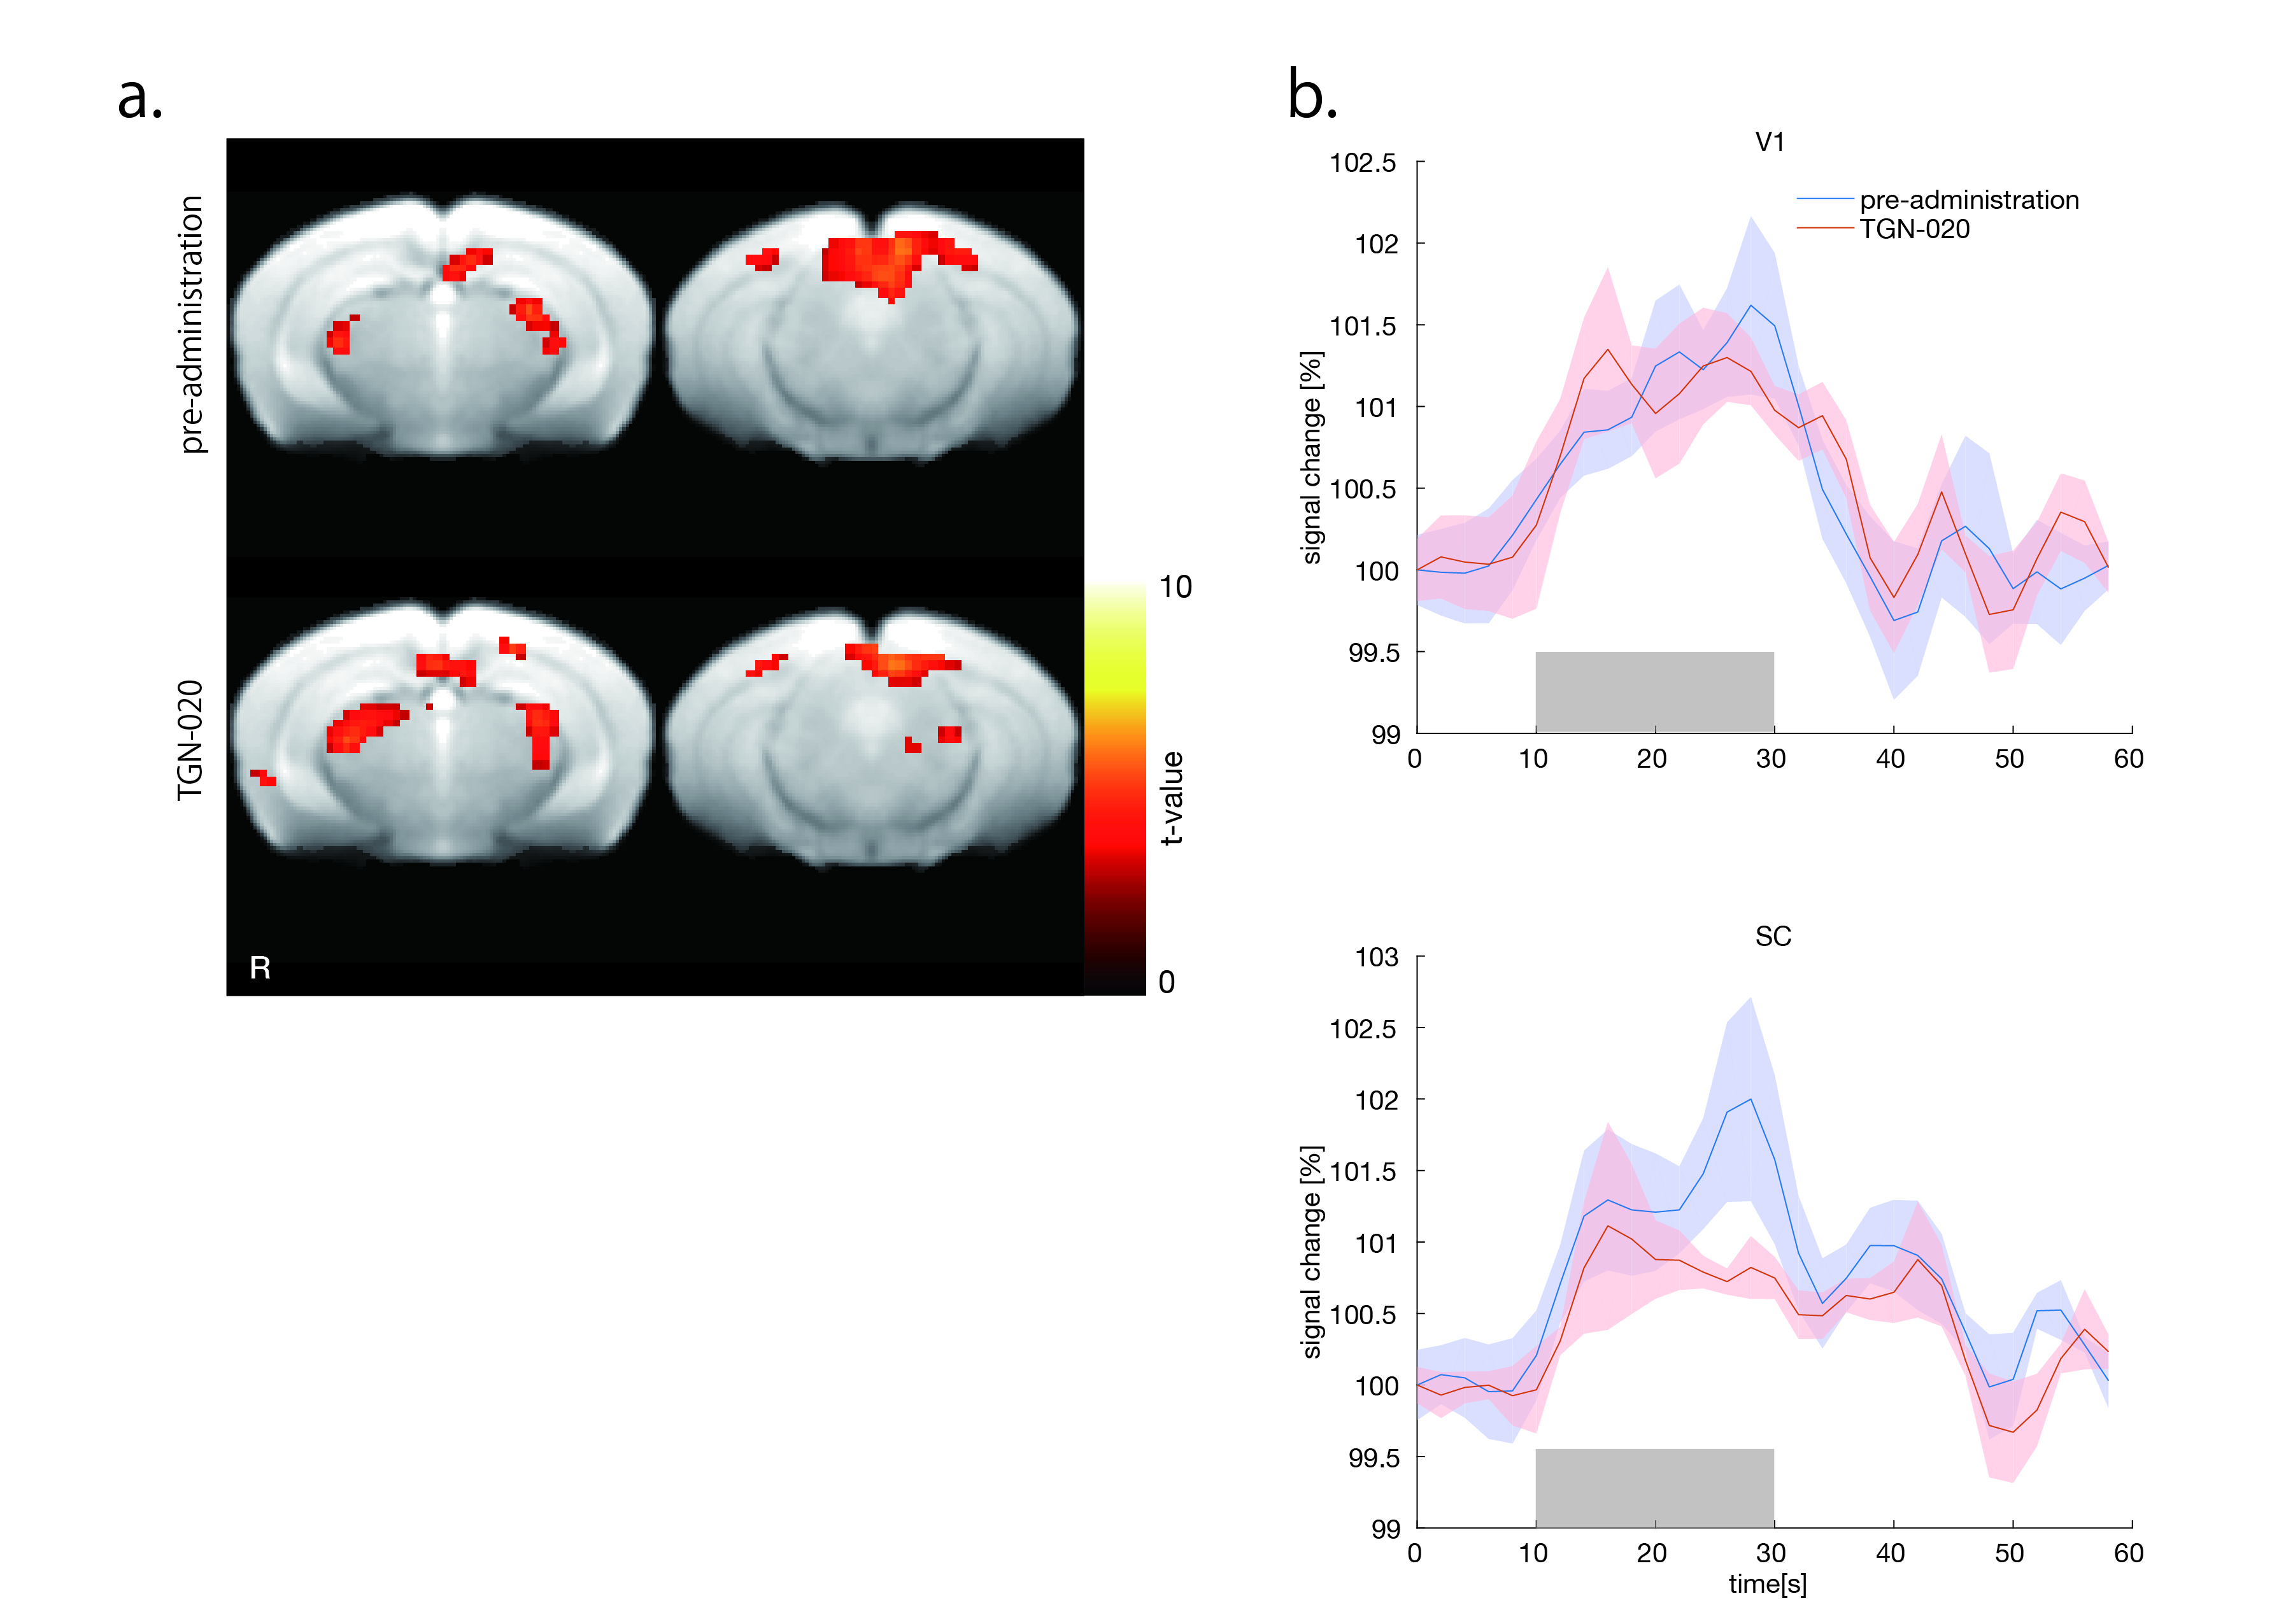
SPM12 software (Welcome Trust Center for Neuroimaging, UK) and a tailor-made program (Matlab, The MathWorks, Inc., USA) was used for fMRI analysis7. Statistical t-maps were calculated using a general linear model analysis regarding the stimulation paradigm. Activation was detected using a statistical threshold of p < 0.05 (false discovery rate (FDR) corrected for multiple comparisons) for all experiments. For the time course analysis, regions of interest corresponding to the primary visual cortex (V1) and the superior colliculus (SC) were defined using the Allen Mouse Brain Atlas8. Statistical significance was assessed by Turkey-Kramer multiple comparison test.
RESULTS and DISCUSSION
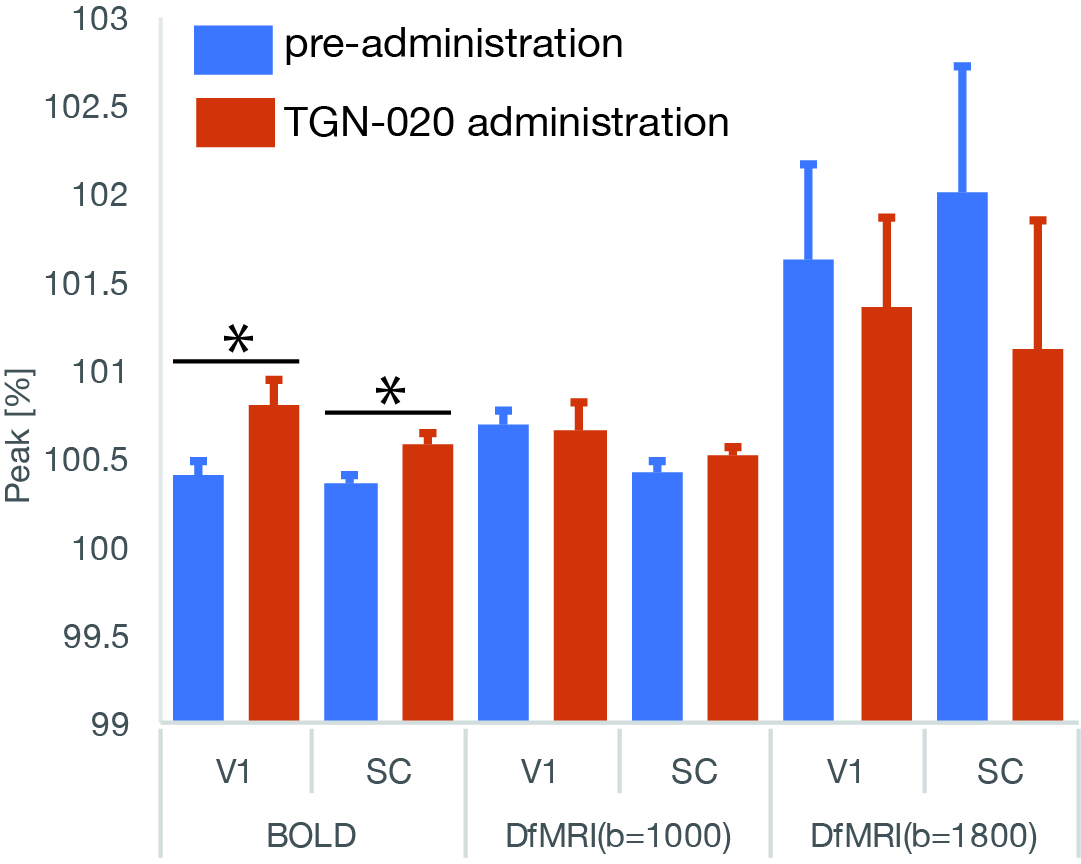
With BOLD fMRI activation was observed in V1, SC and lateral geniculate nucleus (LGN) (Fig.1a). Following TGN-020 administration, the areas of BOLD activation were expanded (Fig. 1a) and the BOLD response amplitude was significantly increased (Fig. 1b and 4) in V1 and SC.
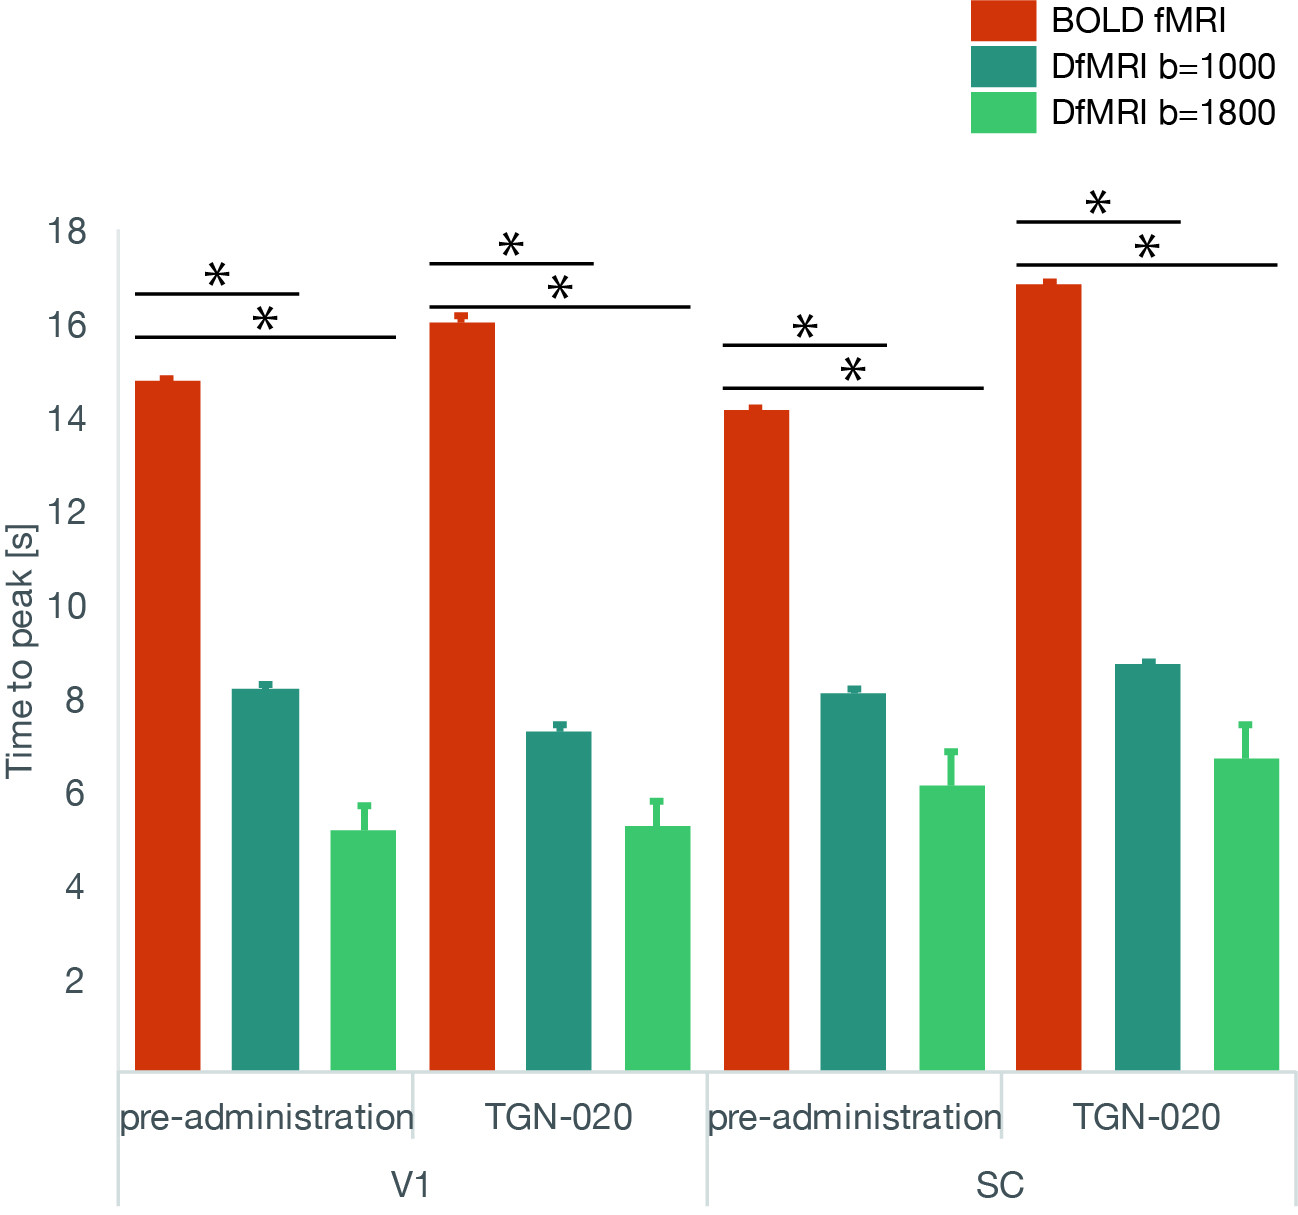
In contrast the b1000 and b1800 DfMRI responses were not affected by TGN-020 administration (Fig. 2, 3 and 4). The time-to-peak for DfMRI (8.2±0.1s for b1000 and 5.1±0.5s for b1800 in V1; 8.1±0.1s for b1000 and 6.1±0.7s for b1800 in SC) were significantly shorter than with BOLD fMRI (14.7±0.1s in V1; 14.1±0.1s in SC) (Fig. 5), as reported earlier1. There was no significant change of these parameters following TGN-020 administration.
Also, as expected the amplitude of the b1800 DfMRI response was larger than the b1000 DfMRI response (Fig.4), indicating an ADC decrease and confirming the molecular diffusion nature of the response. Beside, the shorter time-to-peak for b1800 over b1000, although not significant, might suggest compartmental effects as the weight of diffusion hindrance increases at high b values. These results clearly demonstrate that DfMRI signals were not affected by the disruption of the astrocyte function (inhibition of swelling9) induced by AQP4 inhibition through TGN-020 administration, confirming the hypothesis that the DfMRI response is of neuronal and not astrocyte origin4 and not related to neurovascular coupling. As expected the BOLD fMRI response was affected by TGN-020 administration, as astrocytes play a central role in neurovascular coupling10. Indeed, TGN-020 has been shown to significantly increase regional cerebral blood flow5, yet the exact mechanism leading to this increase under AQP4 inhibition has not yet been investigated.
CONCLUSION
Contrary to the BOLD fMRI response, the DfMRI response induced by visual stimulation is not affected by AQP4 inhibition which blocks astrocyte swelling and interferes with neurovascular coupling. These results comfort the neuronal origin of the DfMRI response3,4.Acknowledgements
This work was supported by postdoctoral fellowship from the Uehara Memorial Foundation in Japan and by the Louis-Jeantet Prize for Medicine from the Fondation Louis-Jeantet.References
- Le Bihan, D., Urayama, S., Aso, T., Hanakawa, T. & Fukuyama, H. Direct and fast detection of neuronal activation in the human brain with diffusion MRI. Proc Natl Acad Sci U S A 103, 8263–8268 (2006).
- Le Bihan, D. Diffusion MRI : what water tells us about the brain. EMBOMol Med. 6, 569–573 (2014).
- Tsurugizawa, T., Ciobanu, L. & Le Bihan, D. Water diffusion in brain cortex closely tracks underlying neuronal activity. Proc. Natl. Acad. Sci. (2013).
- Abe, Y., Tsurugizawa, T. & Le Bihan, D. Water diffusion closely reveals neural activity status in rat brain loci affected by anesthesia. PLoS Biol. 15, 1–24 (2017).
- Igarashi, H., Tsujita, M., Suzuki, Y., Kwee, I. L. & Nakada, T. Inhibition of aquaporin-4 significantly increases regional cerebral blood flow. Neuroreport 24, 324–328 (2013).
- Niranjan, A., Christie, I. N., Solomon, S. G., Wells, J. A. & Lythgoe, M. F. fMRI mapping of the visual system in the mouse brain with interleaved snapshot GE-EPI. Neuroimage 139, 337–345 (2016).
- Komaki, Y. et al. Functional brain mapping using specific sensory-circuit stimulation and a theoretical graph network analysis in mice with neuropathic allodynia. Sci. Rep. 6, 37802 (2016).
- Oh, S. W. et al. A mesoscale connectome of the mouse brain. Nature 508, 207–214 (2014).
- Verkman, A. S., Binder, D. K., Bloch, O., Auguste, K. & Papadopoulos, M. C. Three distinct roles of aquaporin-4 in brain function revealed by knockout mice. Biochim. Biophys. Acta - Biomembr. 1758, 1085–1093 (2006).
- Petzold, G. C. & Murthy, V. N. Role of Astrocytes in Neurovascular Coupling. Neuron 71, 782–797 (2011).
Figures