3751
Optogenetic fMRI of large-scale vestibular system and their cross-modal functions1Laboratory of Biomedical Imaging and Signal Processing, The University of Hong Kong, Hong Kong SAR, China, 2Department of Electrical and Electronic Engineering, The University of Hong Kong, Hong Kong SAR, China, 3Institute of Neuroscience, CAS Center for Excellence in Brain Science and Intelligence Technology, Chinese Academy of Sciences, Shanghai, China, 4School of Biomedical Sciences, The University of Hong Kong, Hong Kong SAR, China
Synopsis
The vestibular system - pivotal for our sense of balance and orientation - integrates input from our other dominant senses, such as audition and vision, to create a multisensory percept. However, little is known regarding the extent of modulatory effects (if any) that the vestibular system exerts on the other sensory processing. Here, our report combined fMRI, optogenetics and sensory stimuli to provide large-scale brain-wide insights into the extent of cross-modal modulatory effects of the vestibular system on sensory processing. We reveal that vestibular nucleus optogenetic stimulation can modulate auditory and visual sensory processing at midbrain, thalamic and cortical regions.
Purpose
fMRI is used extensively to map brain-wide functions in response to specific sensory or cognitive tasks. However, fMRI mapping of the vestibular system (i.e., critical for balance and orientation) and examination of its functions pose significant challenges. Subjects are unable to perform motion- and balance-related tasks inside scanners, and current stimulation techniques for fMRI are nonspecific to delineate the complex functions and pathways of the vestibular system. Hence, it is imperative to deploy new fMRI approaches that can stimulate and examine the spatially segregated yet functionally integrated vestibular functions. The vestibular nucleus (VN) in the brainstem plays a central role in all vestibular processes. The VN has numerous projections that extend brain-wide to pivotal regions including the sensory, motor and prefrontal cortices; hippocampus; and thalamus1, making it an ideal stimulation site to study the functions of the vestibular system. In this study, we interrogated the large-scale vestibular cross-modal functions by combined use of fMRI, optogenetic neuromodulation of VN excitatory neurons, and external sensory stimuli (i.e., auditory or visual).Methods
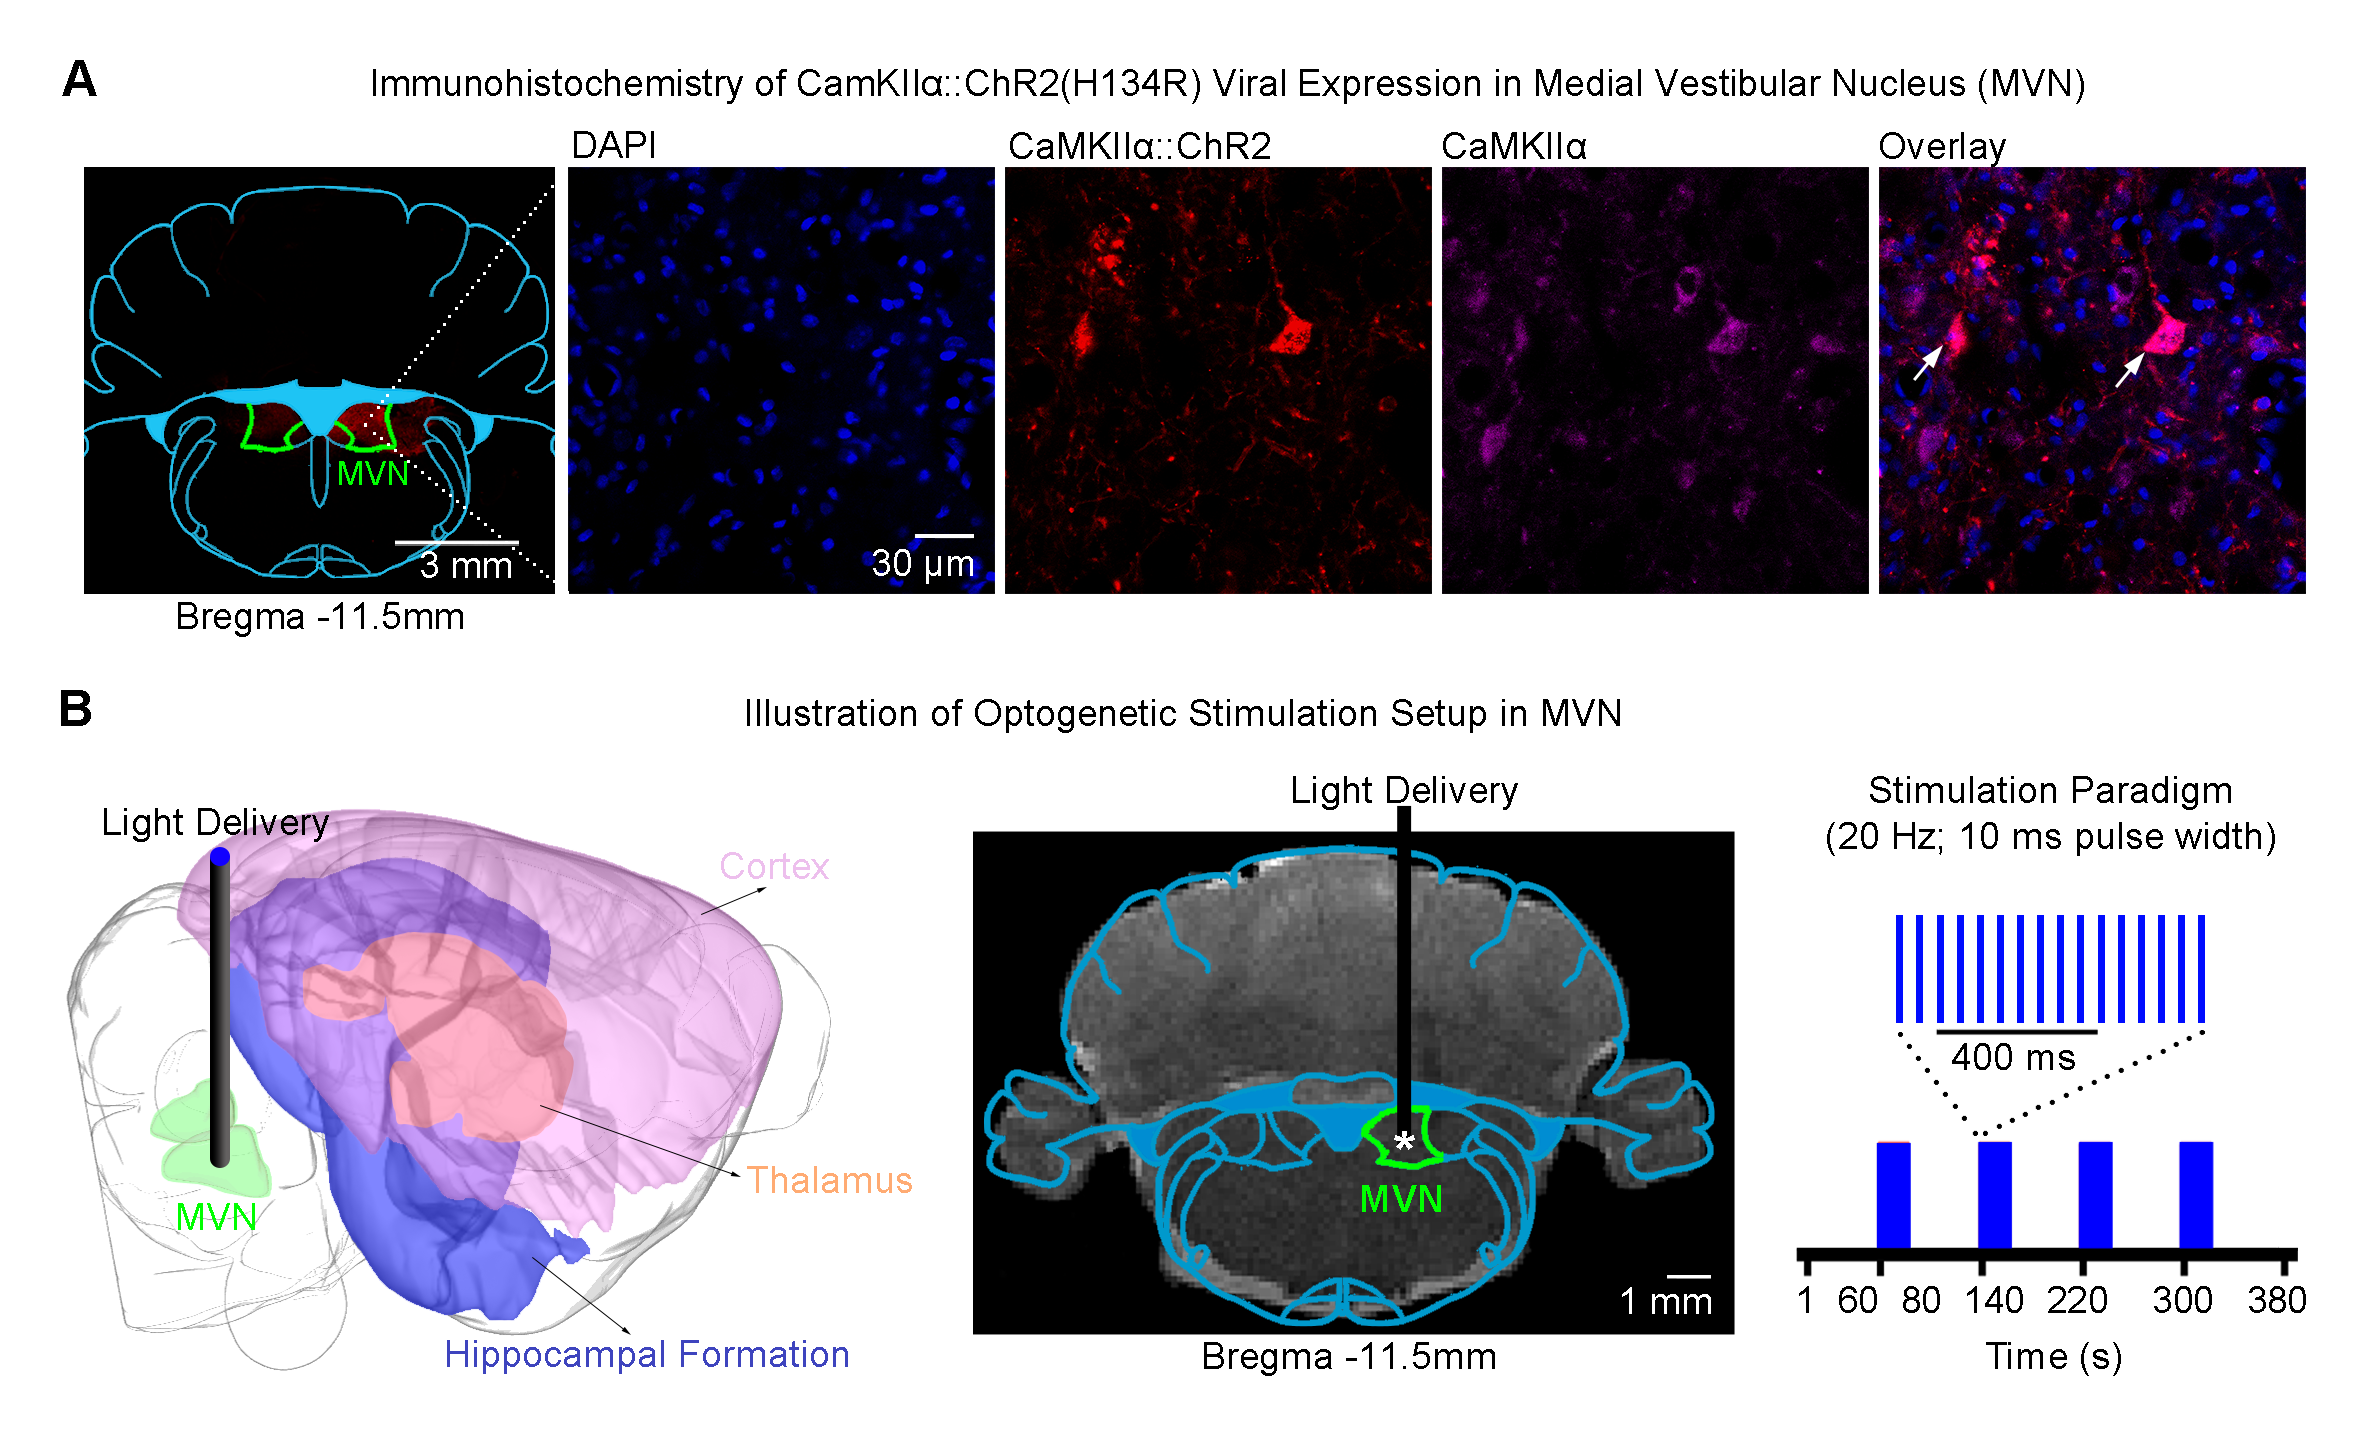
Optogenetics: 3μl of AAV5-CaMKIIa::ChR2(H134R)-mCherry was injected to medial VN (MVN; -11.5mm posterior to Bregma, +1.5mm medial-lateral right hemisphere, -8.5mm from surface of dura) of adult SD rats (200-250g, male, n=6; Figure 1A). Four weeks after injection, an opaque optical fiber cannula (d=450μm) was implanted at the injection site (Figure 1B).
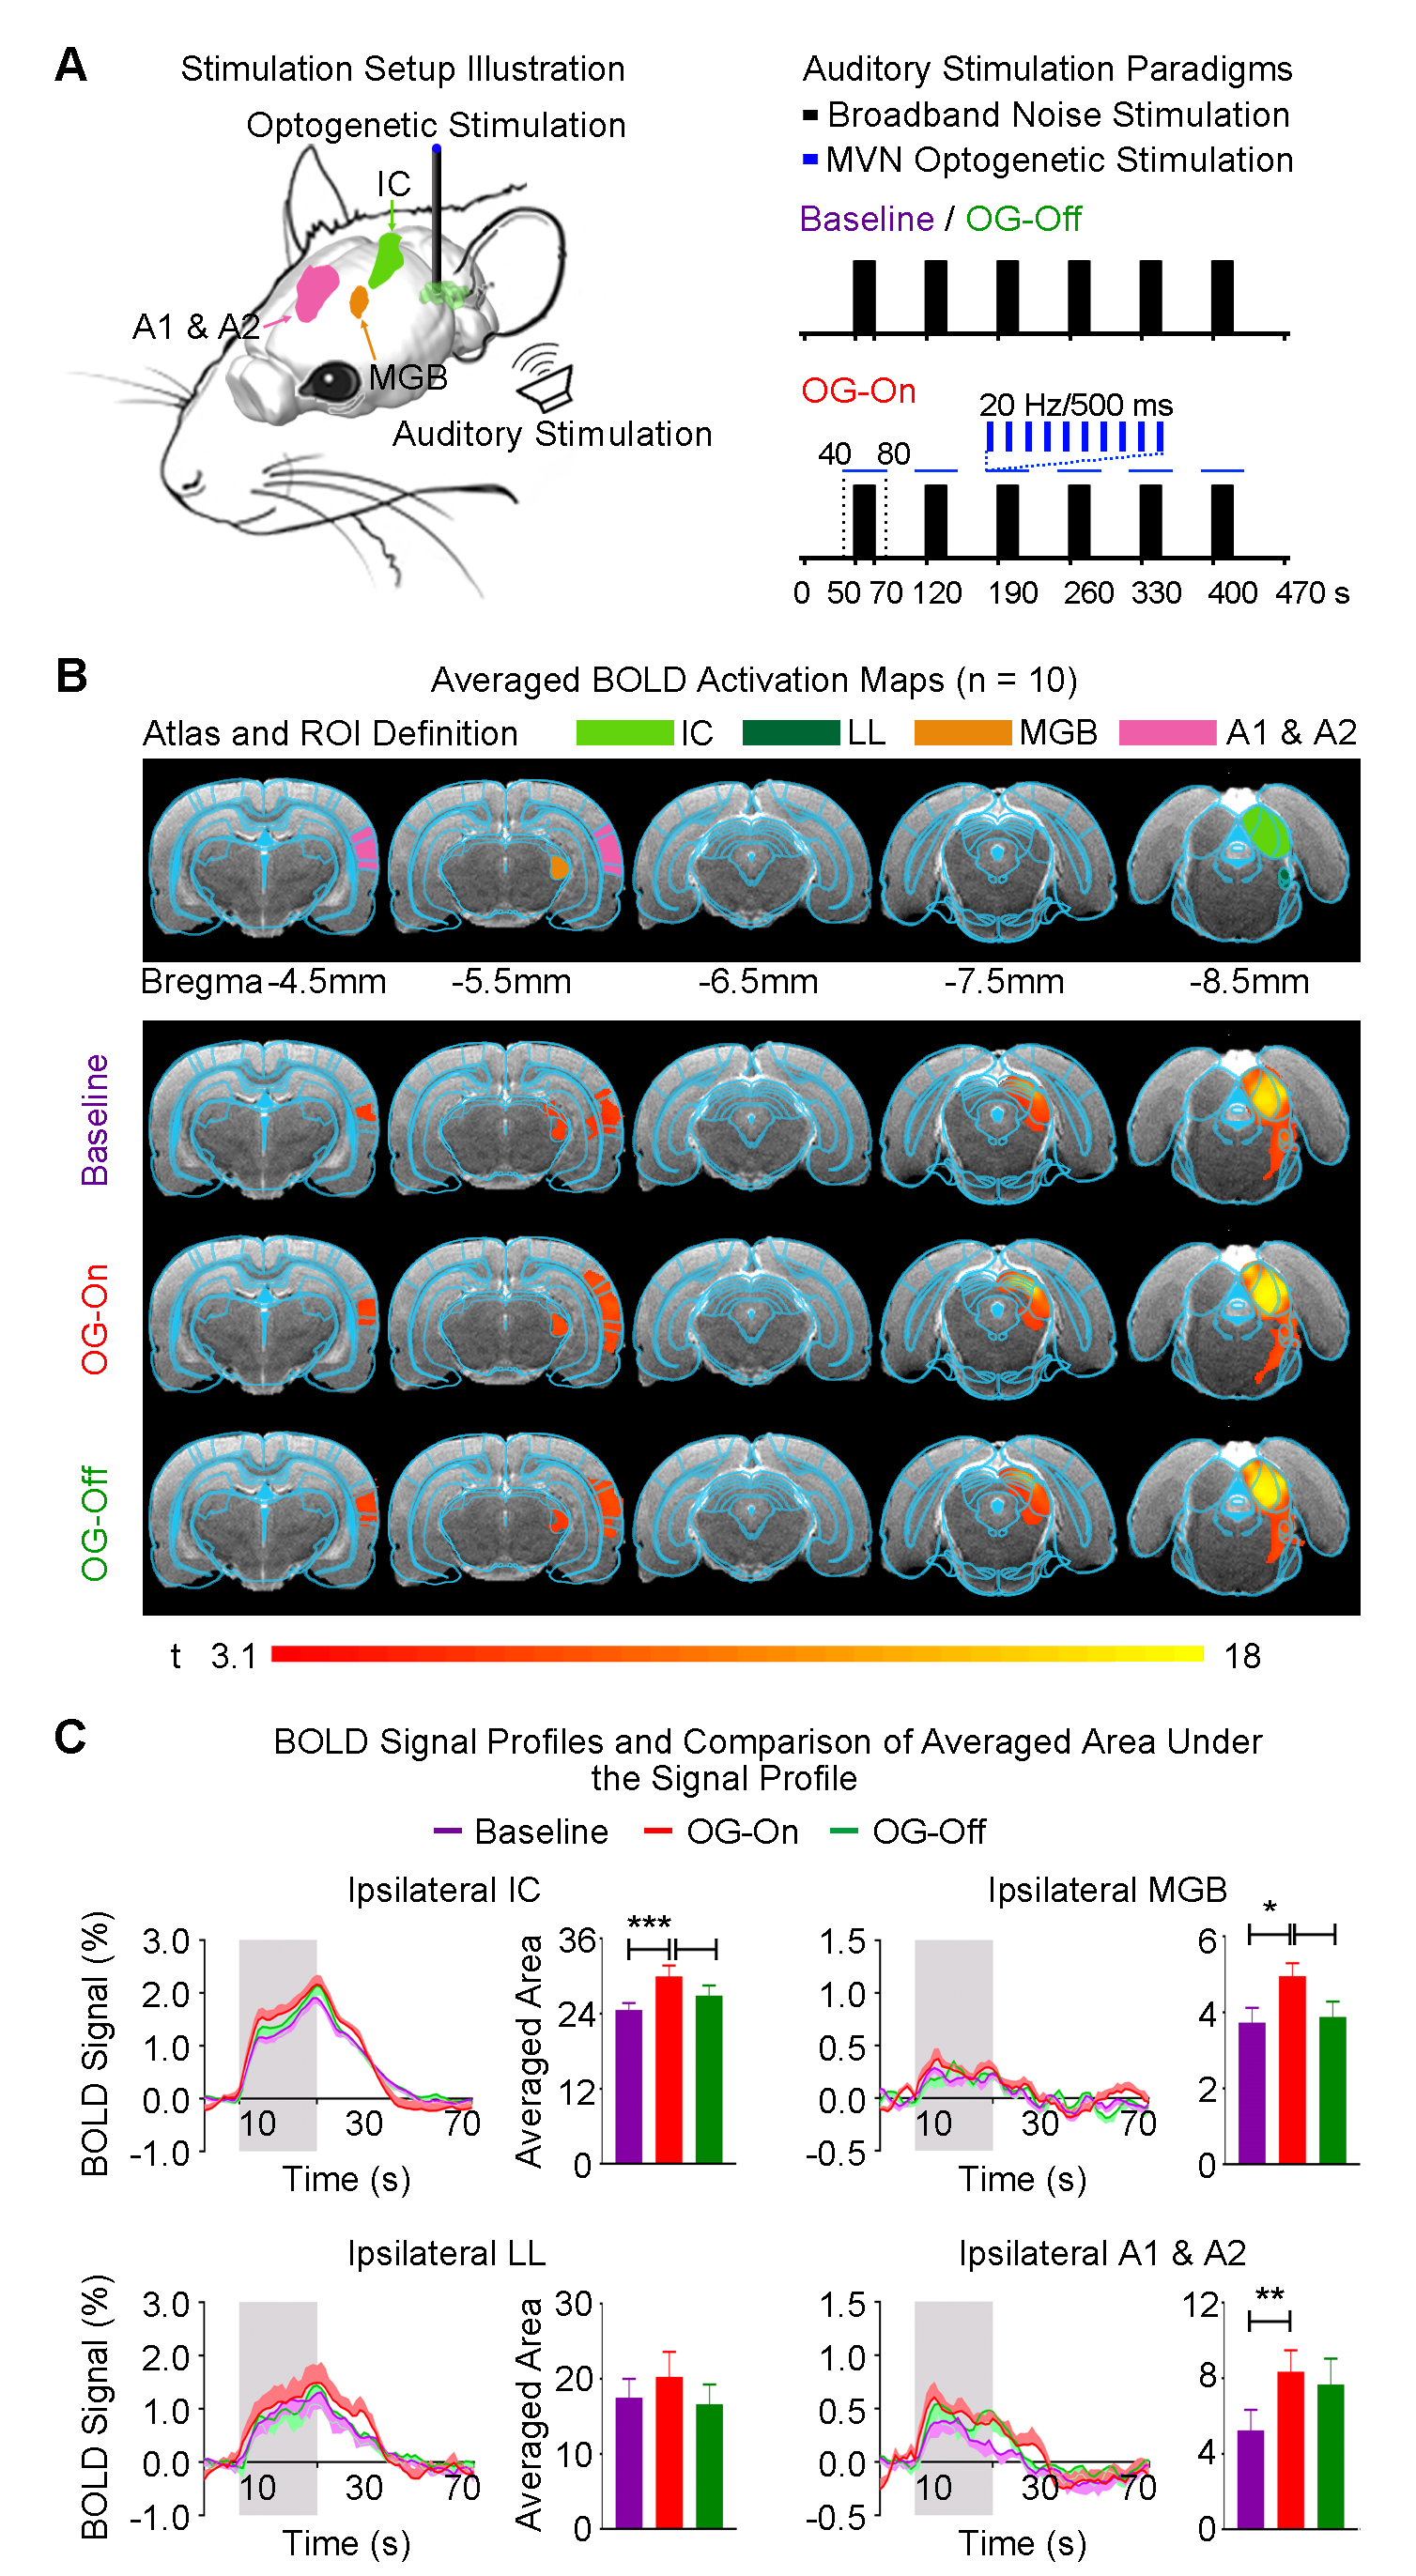
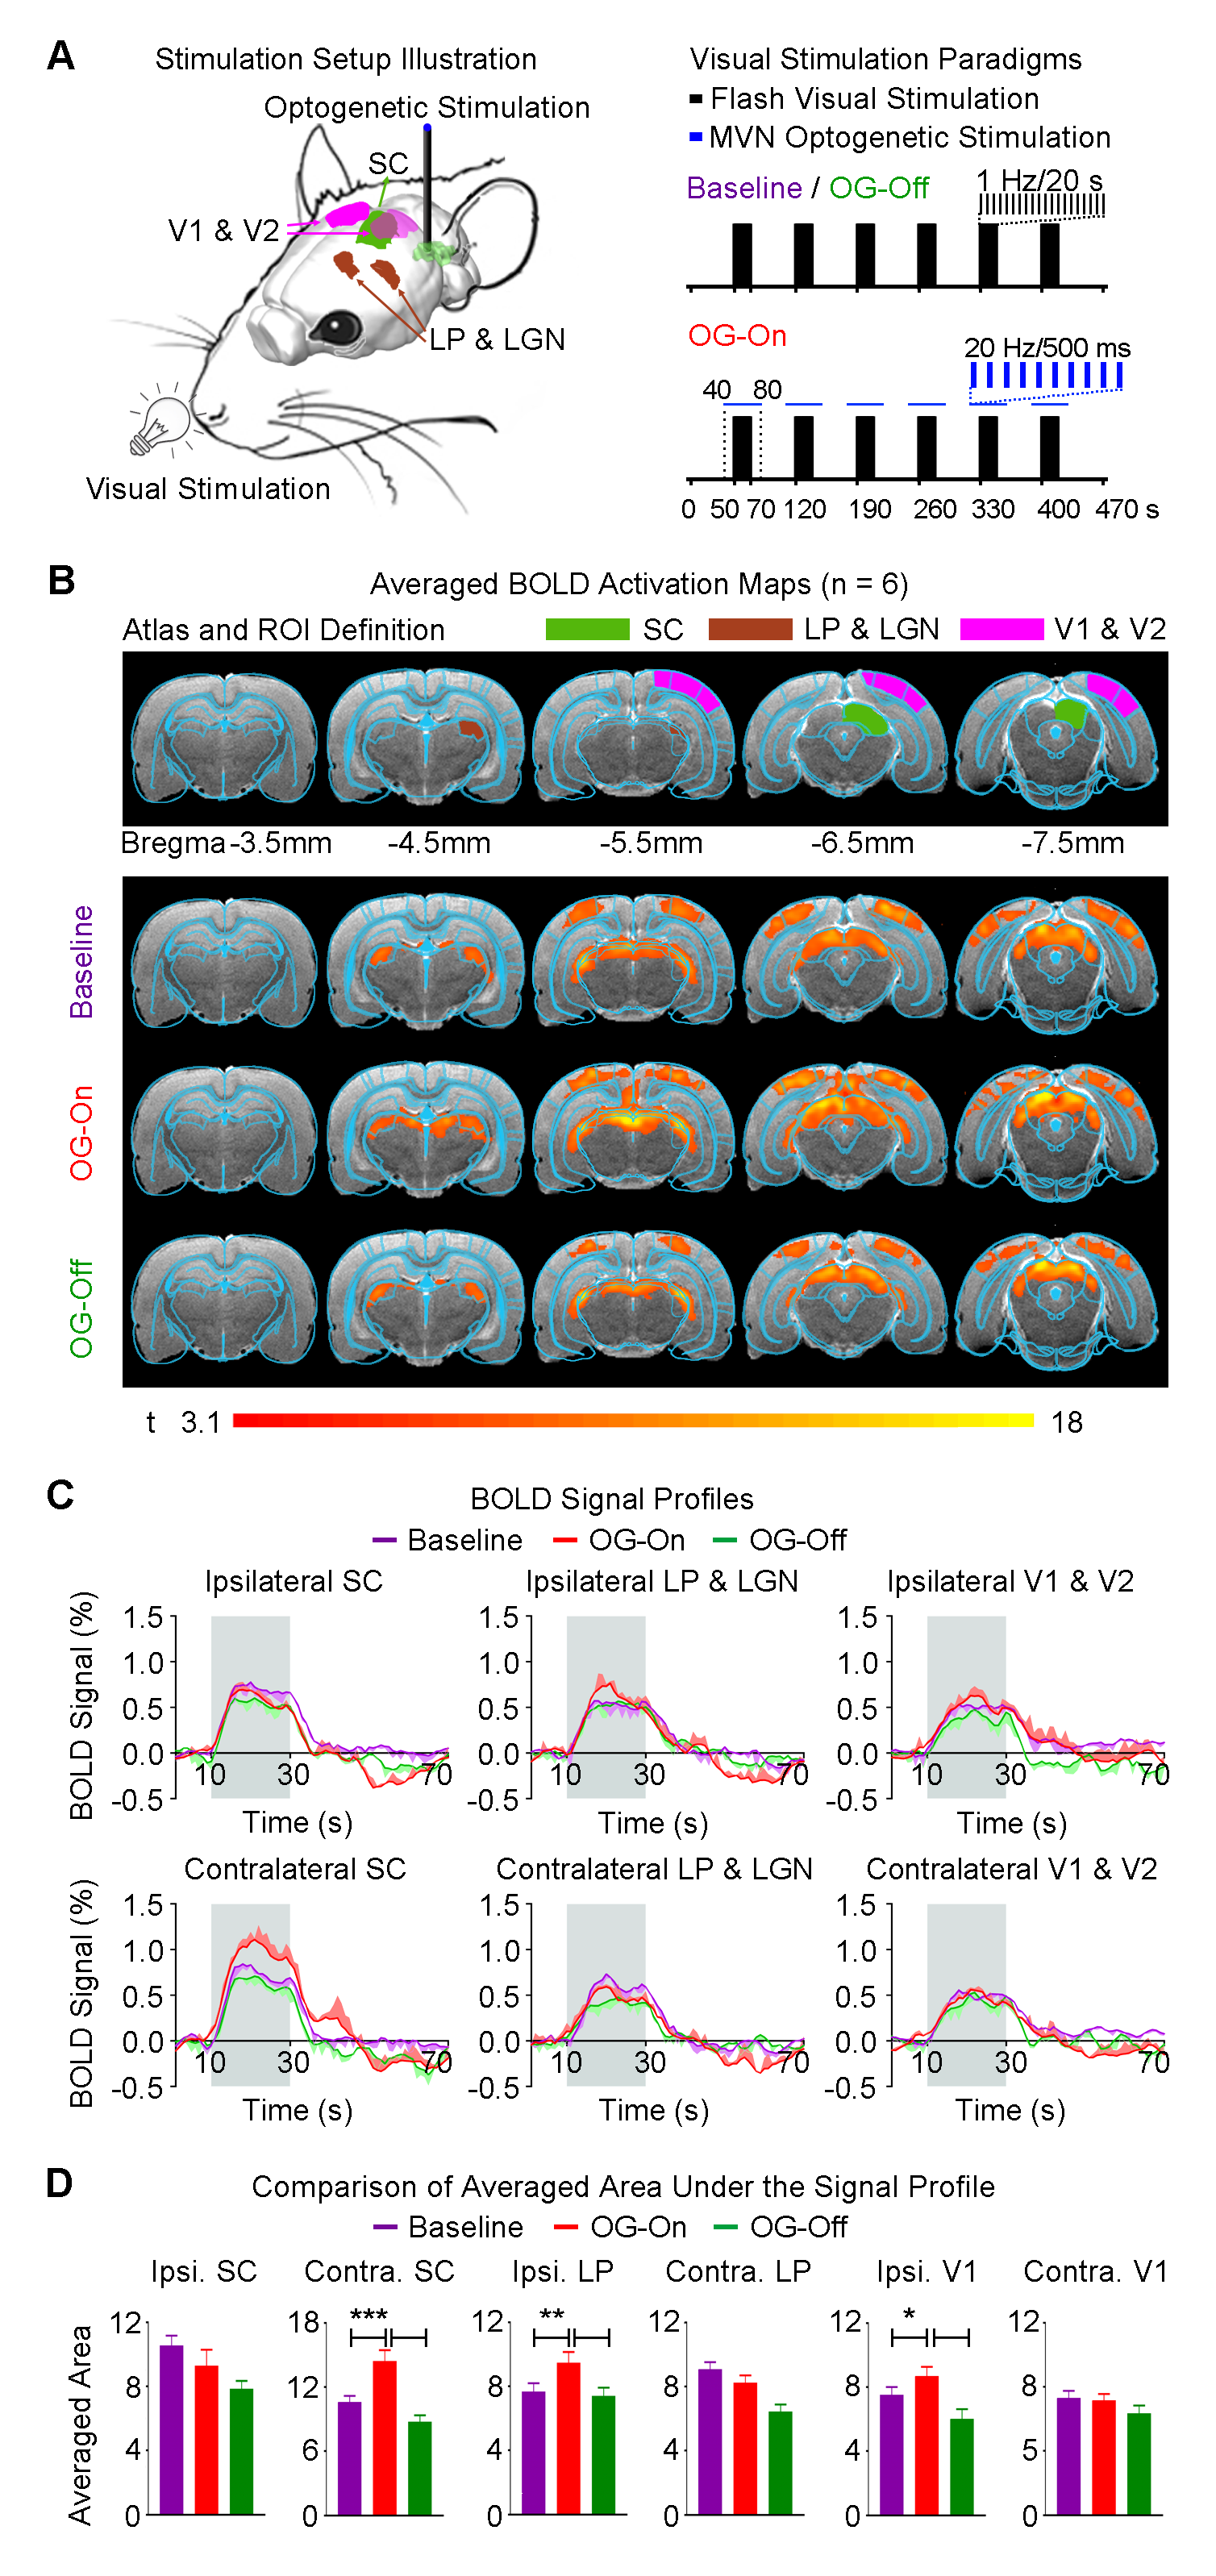
Auditory stimulus with optogenetic stimulation: Broadband noise (bandwidth=1-40kHz; sound pressure level, SPL=90dB) was presented to the left ear of animals (50s sound-off followed by 6 blocks of 20s sound-on and 50s sound-off) while blue light pulses (20Hz; pulse width=10ms; 40mW/mm2) were presented to the right MVN from 10s before to 10s after every sound-on period (Figure 2A). Visual stimulus with optogenetic stimulation:Identical experimental protocols were adopted, with the exception that the monoaural auditory stimulus was replaced with a binocular visual stimulus (1Hz and 10% duty cycle; 0.5mW; Figure 3A).
fMRI acquisition and analysis: fMRI data was acquired on 7T Bruker scanner using GE-EPI (FOV=32×32mm2; matrix=64×64; α=56°; TE/TR=20/1000ms; and 10 contiguous slices with 1mm thickness). Data were preprocessed before standard GLM analysis was applied to identify significant BOLD responses (P<0.001).
Results
Modulatory effects of the vestibular system on auditory processing: Baseline monoaural auditory stimulation to the contralateral ear of animals evoked positive BOLD responses along the auditory pathway in the ipsilateral hemisphere, including the lateral lemniscus (LL), inferior colliculus (IC), medial geniculate body (MGB) and auditory cortex (A1 & A2; Figure 2B). In the presence of optogenetic stimulation at ipsilateral MVN, auditory-evoked BOLD responses significantly increased in the ipsilateral IC, MGB and A1 & A2 (Figure 2C). In addition, BOLD responses did not appear to remain elevated after cessation of optogenetic stimulation during the ~2.5hrs experimental window.
Modulatory effects of the vestibular system on visual processing: Baseline binocular visual stimulation evoked positive BOLD responses bilaterally along the visual pathway, including the lateral posterior thalamus (LP) and lateral geniculate nucleus (LGN), superior colliculus (SC) and visual cortex (V1 & V2; Figure 3B). In the presence of ipsilateral MVN optogenetic stimulation, visually-evoked BOLD responses significantly increased in the ipsilateral LP & LGN, and V1 & V2 (Figure 3C). Surprisingly, we found a significant enhanced response in the contralateral visual midbrain SC, and not the ipsilateral SC (Figure 3C). BOLD responses also did not remain elevated after cessation of optogenetic stimulation during the ~2.5hrs experimental window.
Discussion
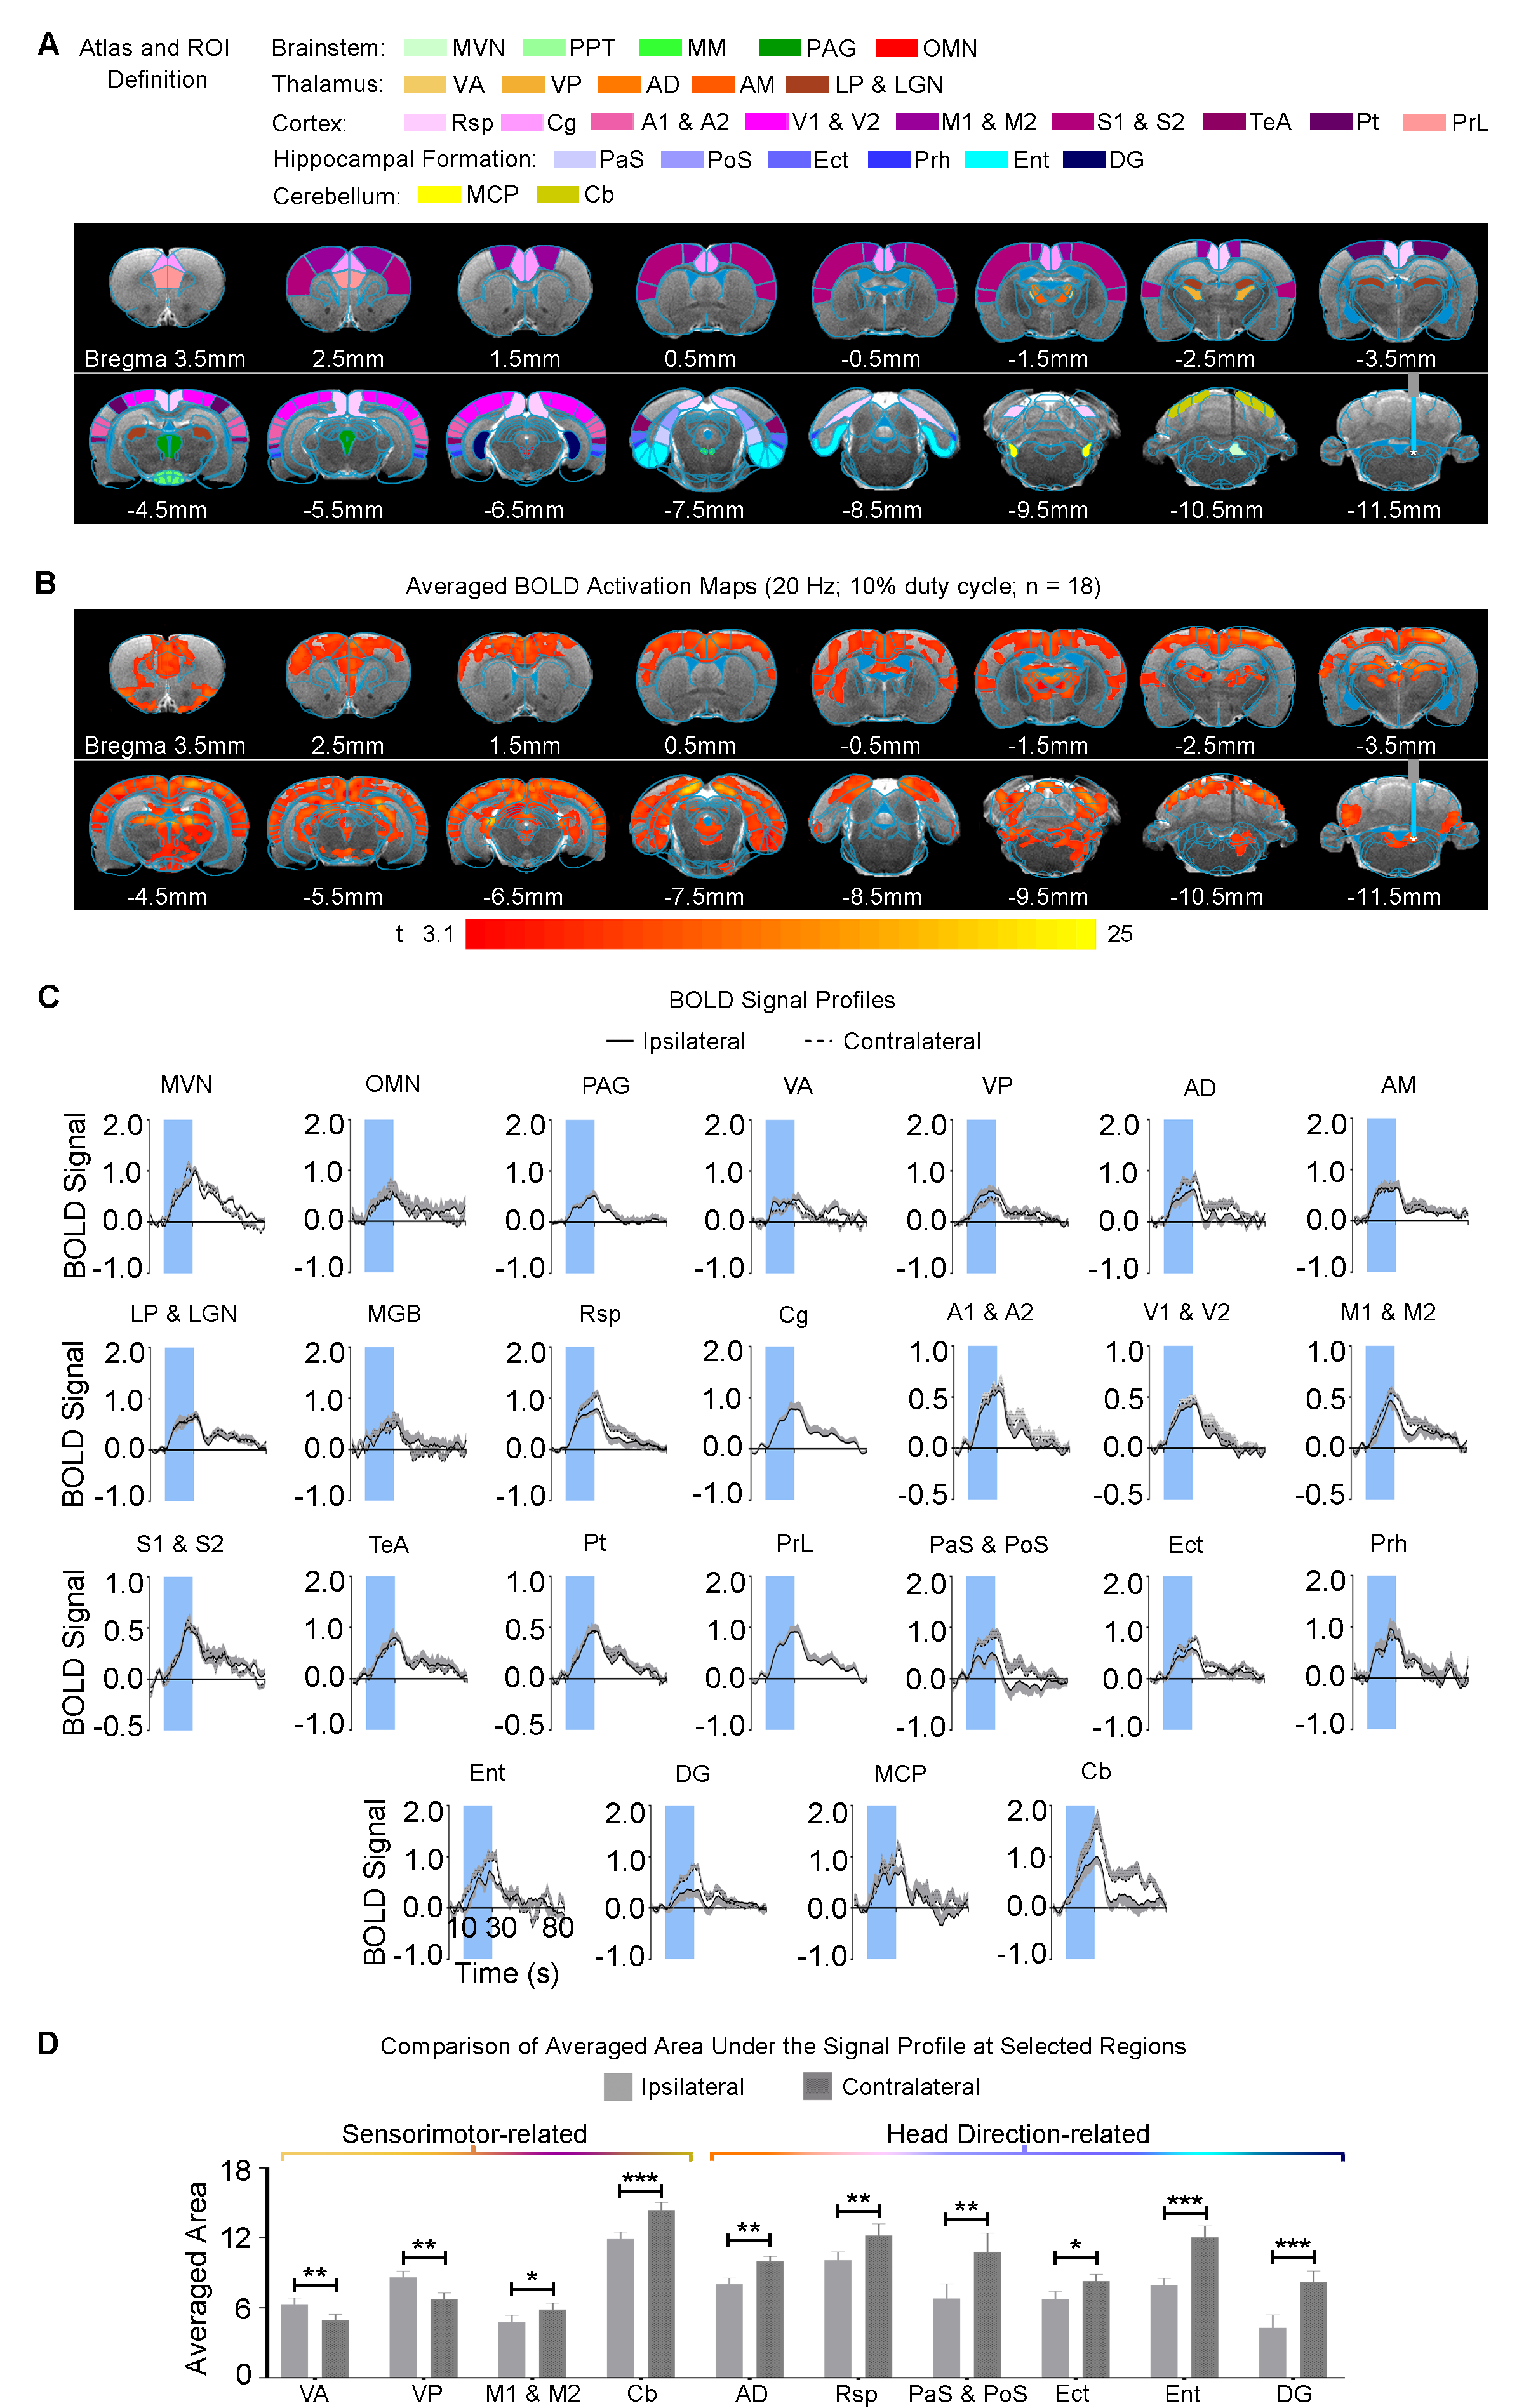
The vestibular system integrates input from our other dominant senses, such as audition and vision to create a multisensory percept. However, we do not know the extent of modulatory effects (if any) that the vestibular system exerts on sensory processing. We found that activation of ipsilateral MVN enhanced only the ipsilateral auditory and visual cortical and thalamic pathways. This indicates differences in hemispheric modulatory effects2-6 by the vestibular system on sensory processing. We surprisingly discovered different hemispheric activations that showed enhanced ipsilateral IC and contralateral SC. Our findings suggest different functional roles of SC and IC in their respective sensory processing pathways. SC can mediate visual saccades7, which occur during the vestibulo-ocular reflex. So, the effect we observed in the contralateral, not ipsilateral SC, could reflect the strong bias exerted by the vestibulo-oculomotor pathway that predominantly projects to and activates the contralateral hemisphere, as shown in our optogenetic stimulation findings (Figure 4) and by others1,8.Conclusion
In summary, we revealed the extent of large-scale cross-modal modulatory effects of the vestibular system on visual and auditory processing. This study presents a fMRI approach to provide critical knowledge on the functions of the vestibular system, which at present remains poorly understood.Acknowledgements
This work was supported by the Hong Kong Research Grant Council (C7048-16G and HKU17103015 to E.X.W.).References
1. Vidal, P.P., et al. The Vestibular System. in The Rat Nervous System 805-864 (Academic Press, San Diego, 2015).
2. Dieterich, M. & Brandt, T. Global orientation in space and the lateralization of brain functions. Curr Opin Neurol 31, 96-104 (2018).
3. Oh, S.Y., Boegle, R., Ertl, M., Stephan, T. & Dieterich, M. Multisensory vestibular, vestibular-auditory, and auditory network effects revealed by parametric sound pressure stimulation. Neuroimage 176, 354-363 (2018).
4. Ueberfuhr, M.A., Braun, A., Wiegrebe, L., Grothe, B. & Drexl, M. Modulation of auditory percepts by transcutaneous electrical stimulation. Hear Res 350, 235-243 (2017).
5. Della-Justina, H.M., et al. Interaction of brain areas of visual and vestibular simultaneous activity with fMRI. Experimental Brain Research 233, 237-252 (2015).
6. Dieterich, M. & Brandt, T. The bilateral central vestibular system: its pathways, functions, and disorders. Ann N Y Acad Sci 1343, 10-26 (2015).
7. Lee, C., Rohrer, W.H. & Sparks, D.L. Population coding of saccadic eye movements by neurons in the superior colliculus. Nature 332, 357-360 (1988).
8. Dieterich, M. & Brandt, T. Vestibulo-ocular reflex. Curr Opin Neurol 8, 83-88 (1995).
Figures