3745
Rhythmic EEG inputs modulate the thalamocortical network in epilepsy1University of Electronic Science and Technology of China, Chengdu, China
Synopsis
Thalamus has the capacity to generate oscillations characterized by different frequency and levels of synchrony. However, little is known of what function the generated EEG dynamic pattern may serve in thalamocortical interactions. In this study, we used psychophysiological interaction framework to detect fMRI thalamocortical coupling modulated by dynamic EEG connectivity patterns, and tested the alteration of the modulatory couplings in juvenile myoclonic epilepsy. The results found frequency-dependent characteristics for the thalamocortical coupling. The group comparison revealed the couplings were altered with certain thalamus sets involved in JME, which may have implications for better understanding of the thalamocortical circuit influenced by epileptic activity.
Abstract
Introduction: Thalamus subserves cognitive functions by interacting with cortical and other subcortical areas, generating different types of oscillation characterized by their frequency and levels of synchrony1. However, little is known of what function the generated synchrony pattern may serve in thalamocortical and cortiocortical interactions. Epilepsy, as is a system disease, has been frequently reported involving aberrant thalamocortical coupling2-4. Moreover, computational analysis suggests the spike-wave generation may be associated with increased cortical firing, then resulting in the low-frequency thalamocortical oscillation5, 6. The association between EEG oscillation variation and thalamocortical may contribute to our understanding of the origins of the epileptic activity. Technically, simultaneous EEG-fMRI has been a powerful approach to link the EEG activity and the whole brain, even the deep sub-cortical structures7, 8. Therefore, we hypothesized that the thalamocortical connectivity can be modulated by the dynamic connectivity patterns of the rhythmic EEG, and this modulation may be altered in epilepsy.
Methods: In the current study, simultaneous EEG-fMRI data was acquired from 20 juvenile myoclonic epilepsy (JME), and 20 healthy controls (HC). Adapted directed transfer function (ADTF) was applied to construct scalp EEG time-varying connectivity patterns, and the dynamic ADTF variation of different frequency bands was then used as a modulator in psychophysiological interaction (PPI) framework to detect fMRI thalamocortical functional coupling. Here, the Power-264 meta-analysis cortical regions of interest 9 and 8 thalamus sets of Human Brainnetome Atlas 10 were used. The alteration of thalamocortical coupling with EEG modulation in JME was analyzed. Furthermore, the association between corticocortical connectivity and modulatory thalamocortical coupling was examined.
Results: The
results revealed that these thalamocortical couplings have frequency band
specificity, and posterior and lateral thalamus sets were more sensitive to the
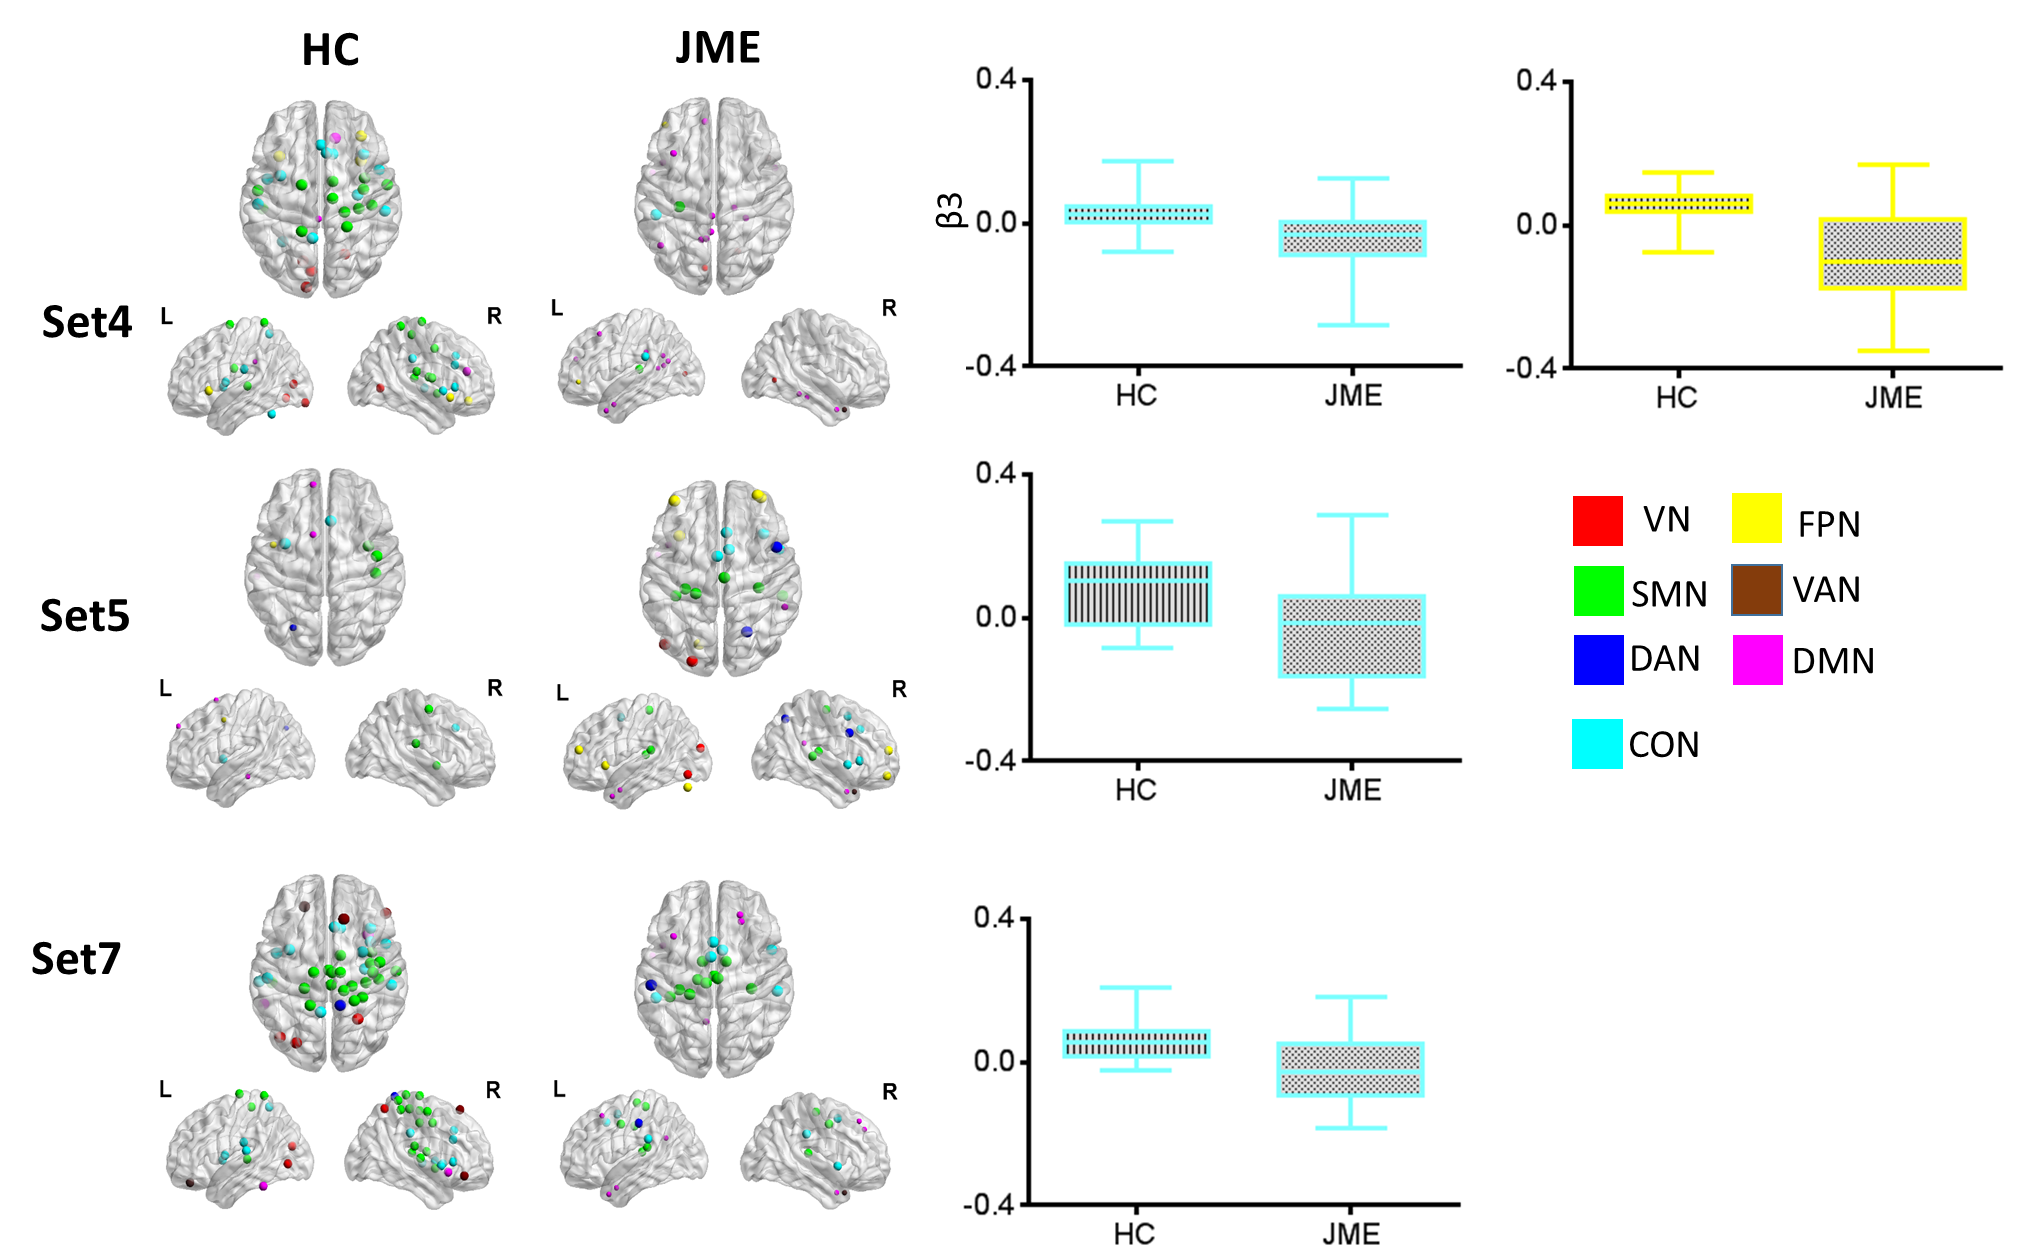
modulations. For theta frequency band, positive modulatory effects were found
mainly in thalamus sets to the sensorimotor network (SMN) and cingulo-opercular
network (CON), while the modulations were mainly decreased in JME (Figure 1).
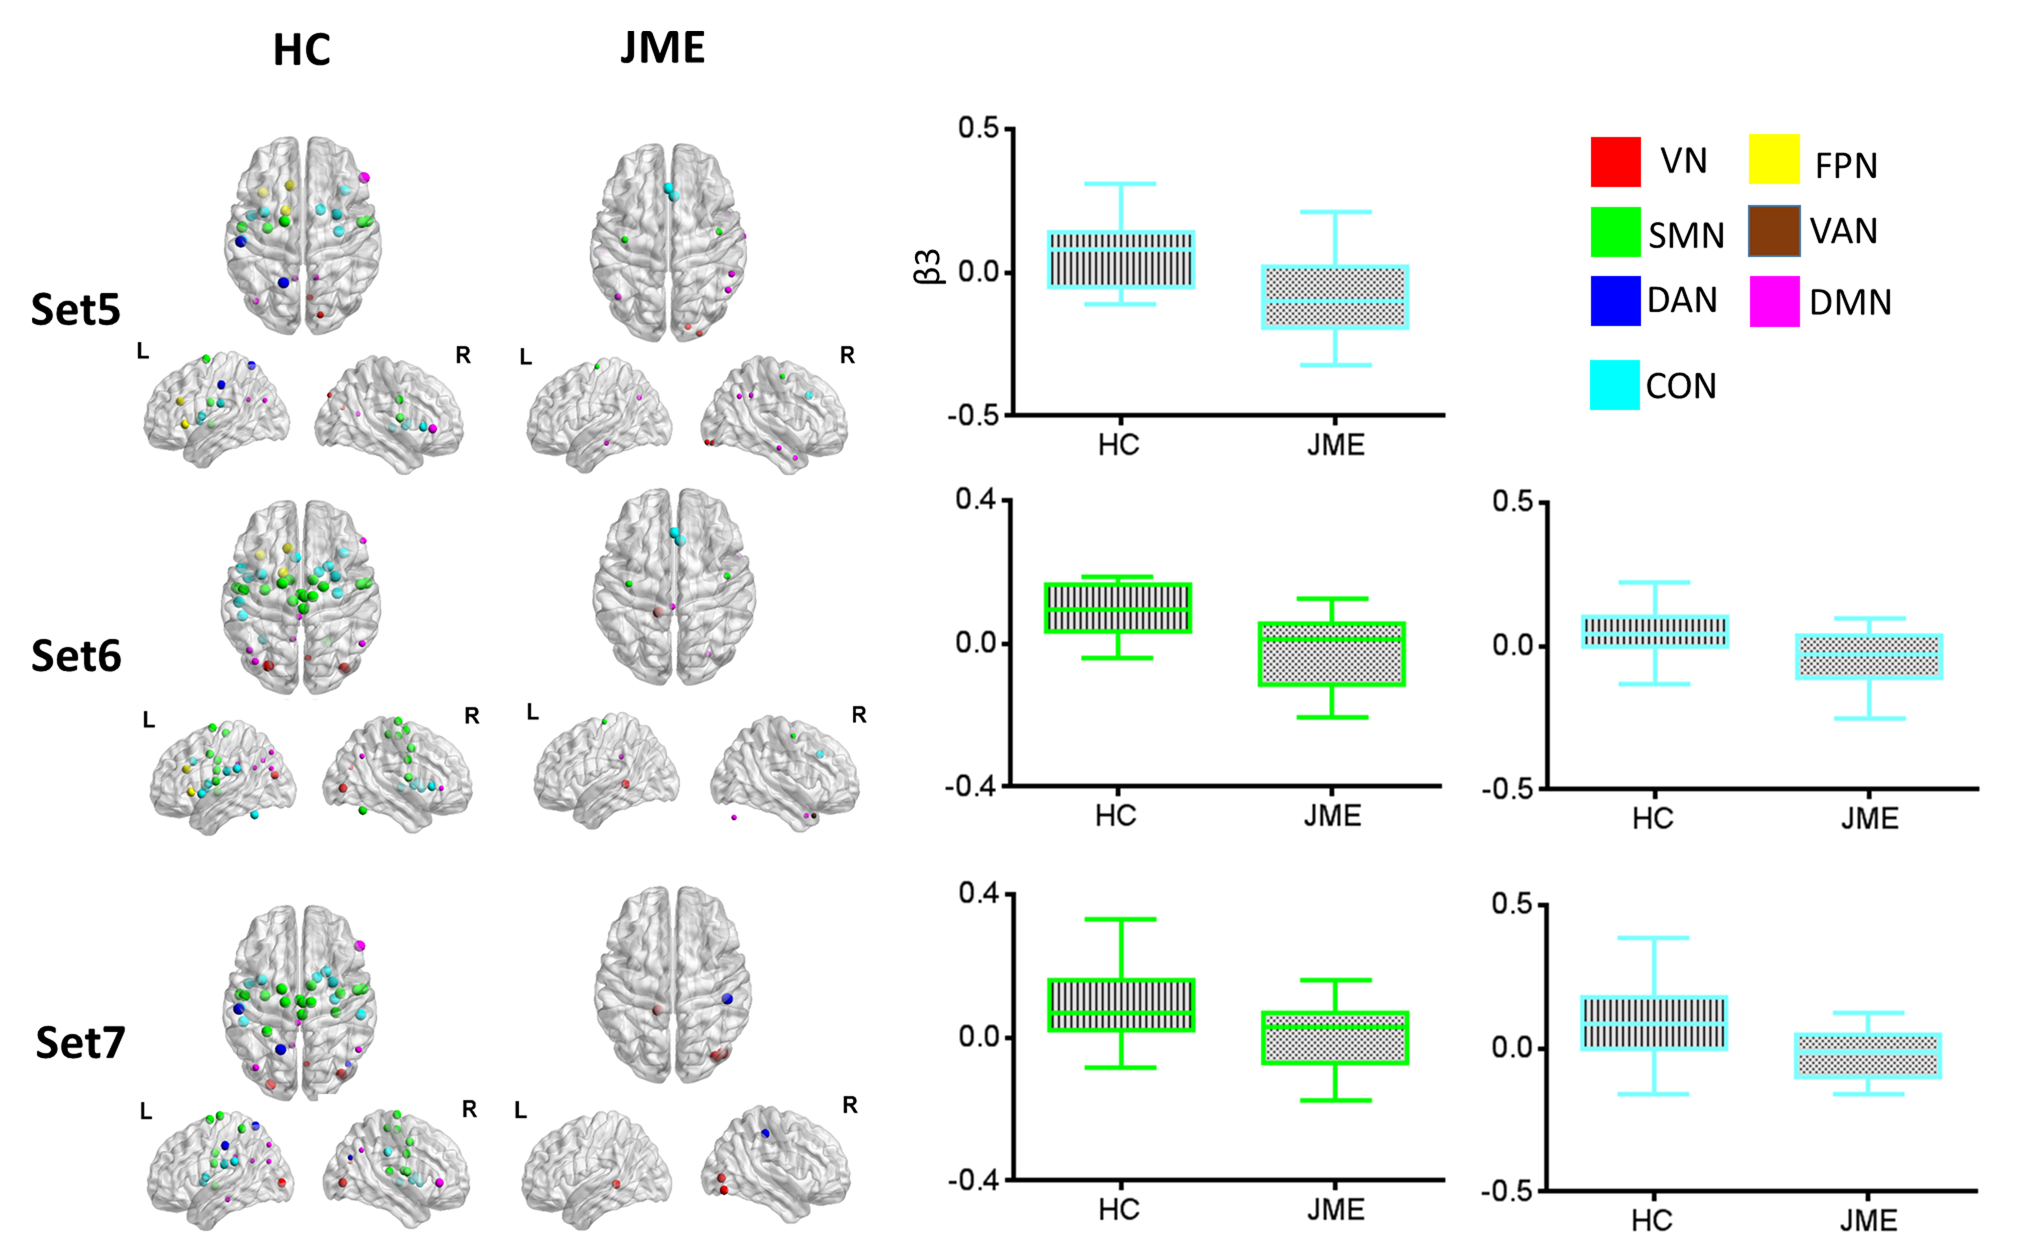
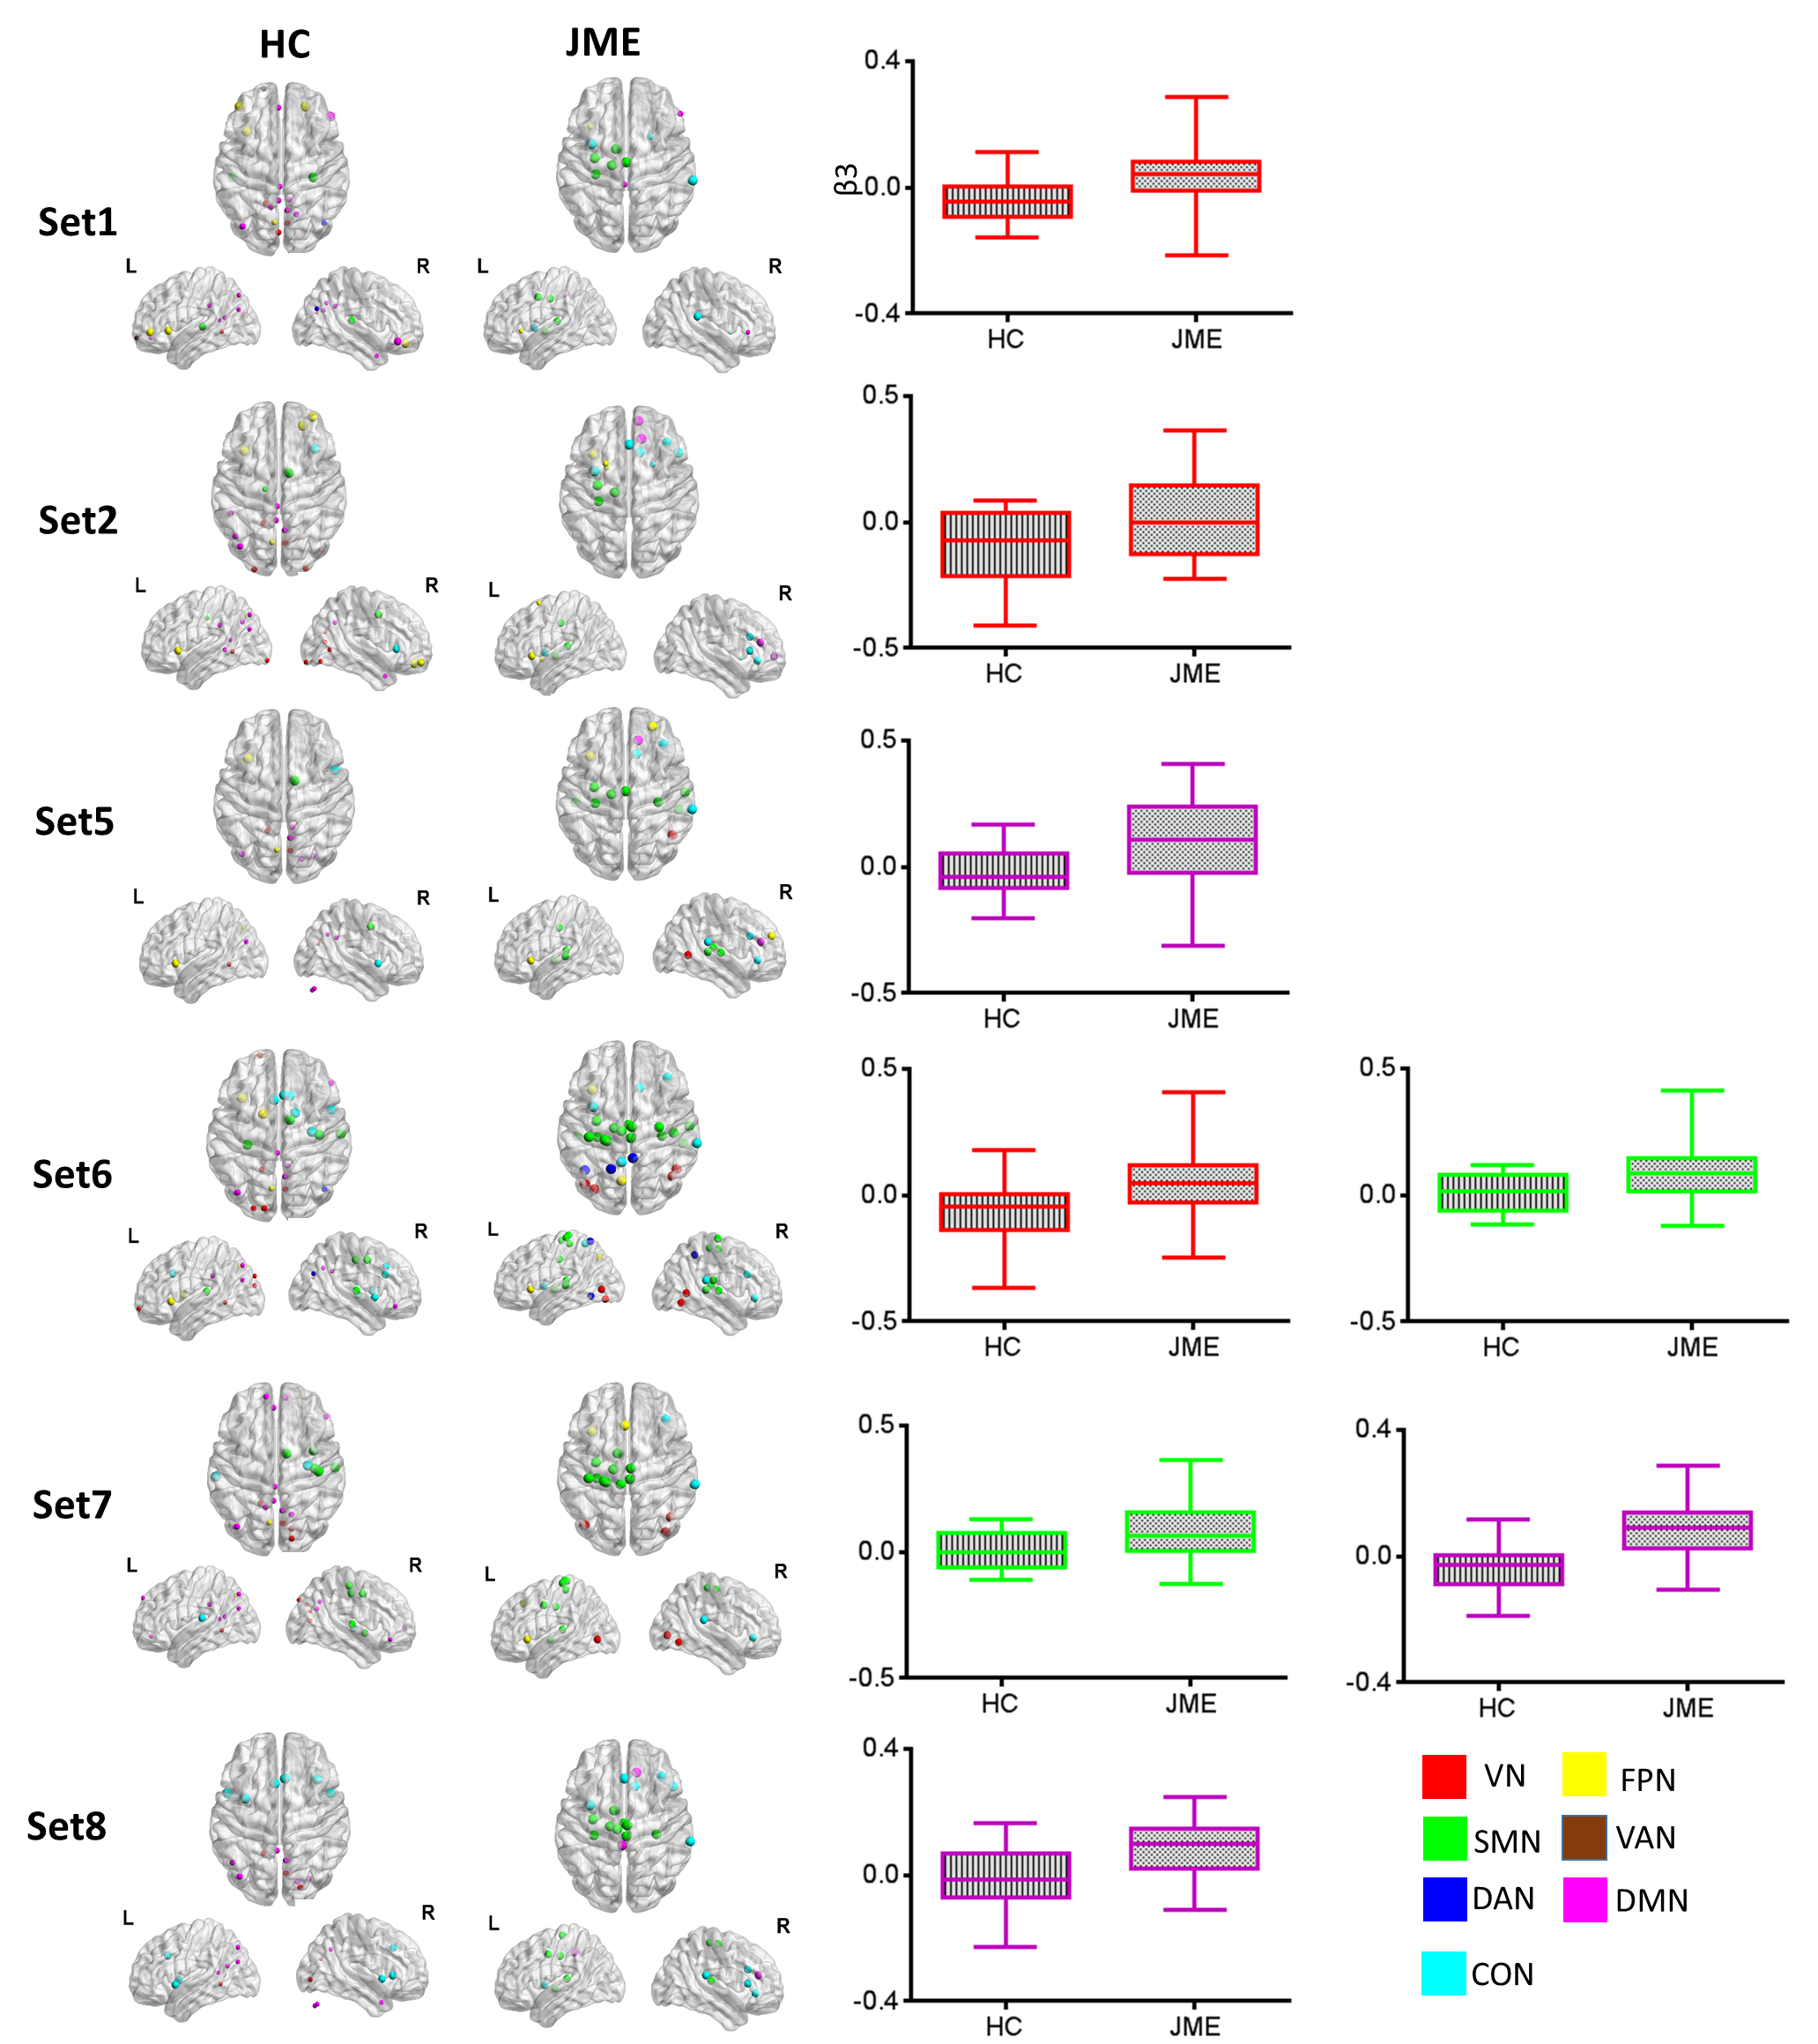
For alpha, most thalamus sets demonstrated negative modulatory couplings to
visual network (VN) and default mode network (DMN) in HC group, while JME
showed inversed positive modulatory couplings in VN and DMN, as well as distinct
increased coupling to SMN. For beta band, JME showed significant decreased
connectivity to CON (Figure 3). In addition, modulatory thalamocortical
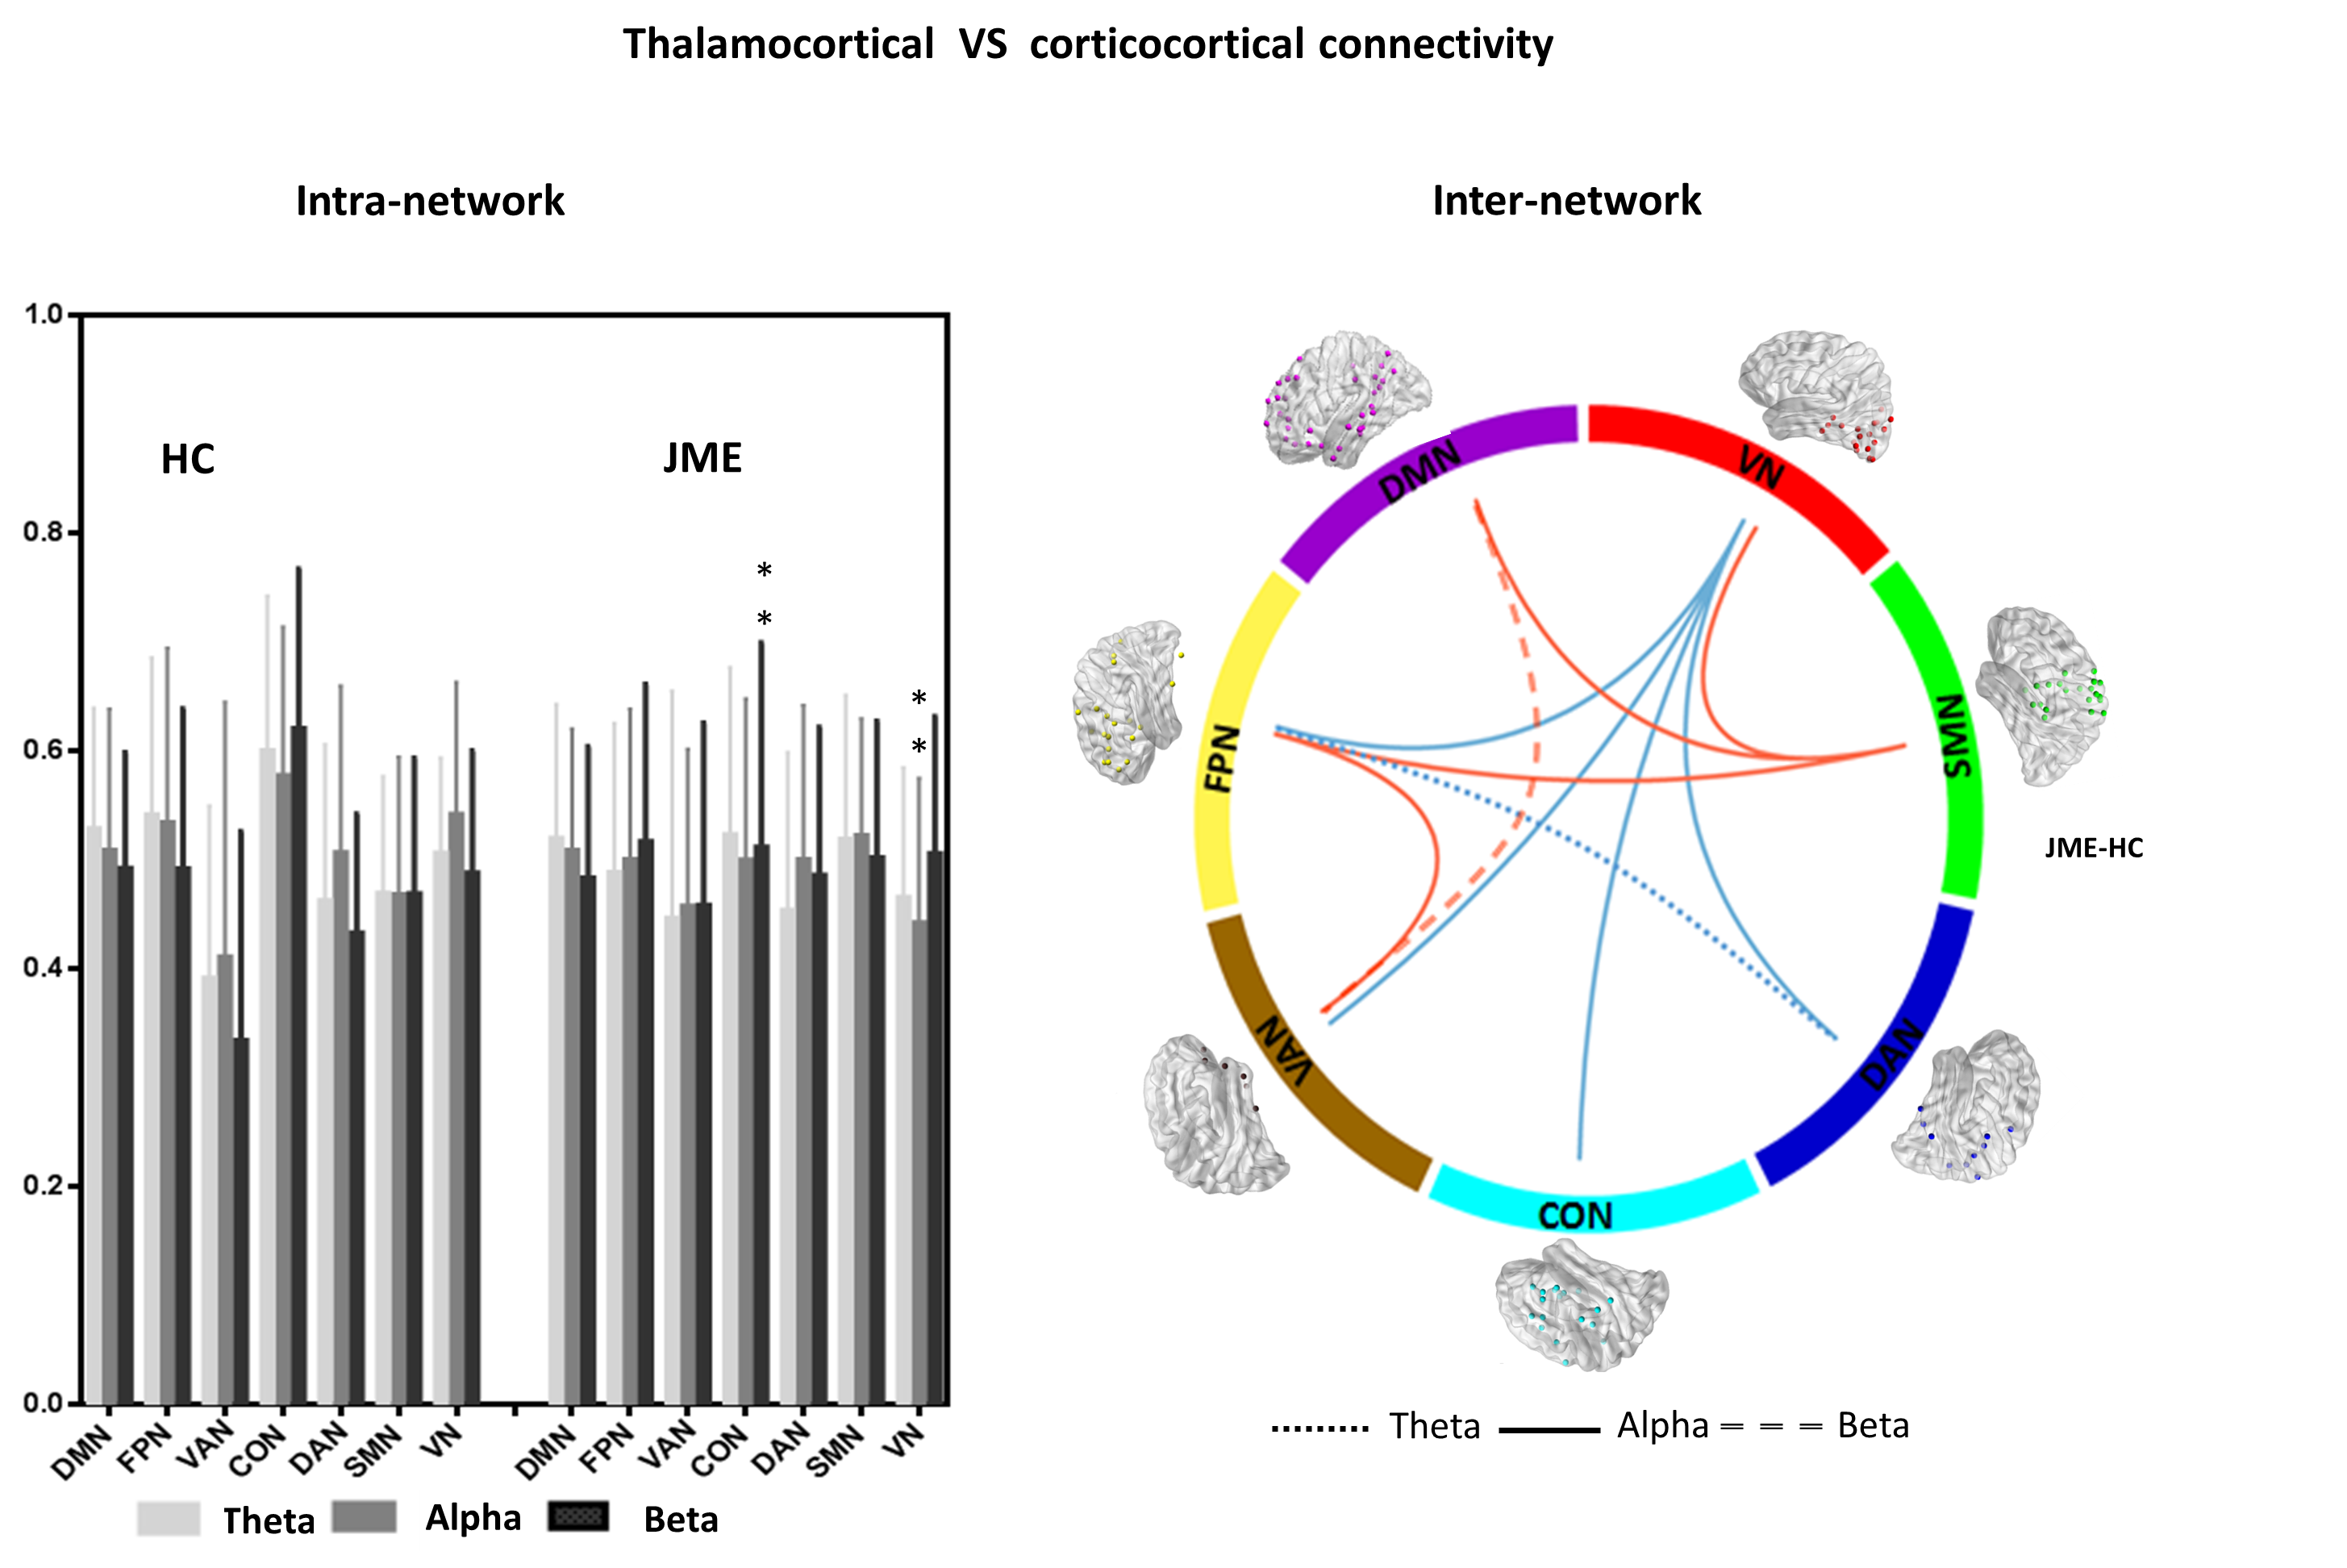
coupling was highly associated with corticocortical functional connectivity,
while mismatch in visual and sensorimotor pathway was prevailingly presented in
JME patients (Figure 4).
Discussion: In HC group, negative relationship has been found between the alpha power and the connectivity between thalamus sets and visual network/DMN, which may be associated with specific functional inhibition during alpha activity11. The positive modulation from theta and beta bands mainly act on the coupling from thalamus to SMN, CON areas, which was consistent with the main projections originating from thalamus and limbic thalamus12, 13. Thalamocortical network is the vulnerable system in epilepsy. This study confirmed the abnormal thalamocortical couplings in JME, and established the association between the phenomenon and modulatory EEG variation inputs. Inversed thalamus-VN, thalamus-DMN coupling may be related with the abnormal visual pathway and self-reference system in epilepsy group. Also, altered thalamus-SMN and thalamus-CON coupling with theta and beta modulation in epilepsy implied that theta and beta are the main precursor frequency bands positively modulating the connectivity between thalamus and cortex14. In addition, we found that the parietal, occipital and temporal thalamus were all sensitive areas to low frequency dynamic oscillation, which may represent the spatial pattern of thalamocortical as a mechanism due to the spontaneous oscillation feedback. Furthermore, the specific increased association of motor and visual pathway in terms of alpha modulation may imply the potential mechanism of altered intrinsic network connectivity in JME.
Conclusion: In summary, this study investigated the modulation from rhythmic variation in thalamocortical system, and found frequency-dependent characteristics for these modulations. Moreover, the modulatory thalamocortical coupling was altered with certain thalamus sets involved in JME patients. In addition, the association between thalamocortical and corticocortical connecitivty was also detected. This modulation analysis may have implications for a better understanding of the descending control of thalamocortical circuit and the influences by epileptic activity.
Acknowledgements
This work was supported by grants from the National Nature Science Foundation of China (grant number: 81771822,81701778, 31771149, 81330032), , The Chinese Fundamental Research Funding for Central Universities in UESTC (ZYGX2016J121, ZYGX2017KYQD166).References
1. Baars BJ, Franklin S, Ramsoy TZ. Global workspace dynamics: cortical "binding and propagation" enables conscious contents. Front Psychol 2013;4. 2. Benjamin CFA, Saling MM, Wood AG, Reutens DC. Elemental Spatial and Temporal Association Formation in Left Temporal Lobe Epilepsy. Plos One 2014;9. 3. Engel J. A proposed diagnostic scheme for people with epileptic seizures and with epilepsy: Report of the ILAE Task Force on Classification and Terminology. Epilepsia 2001;42:796-803. 4. Luo C, Li QF, Xia Y, et al. Resting state basal ganglia network in idiopathic generalized epilepsy. Hum Brain Mapp 2012;33:1279-1294. 5. Blumenfeld H, McCormick DA. Corticothalamic inputs control the pattern of activity generated in thalamocortical networks. J Neurosci 2000;20:5153-5162. 6. Destexhe A, McCormick DA, Sejnowski TJ. Thalamic and thalamocortical mechanisms underlying 3 Hz spike-and-wave discharges. Progress in brain research 1999;121:289-307. 7. Laufs H, Kleinschmidt A, Beyerle A, et al. EEG-correlated fMRI of human alpha activity. Neuroimage 2003;19:1463-1476. 8. Ritter P, Moosmann M, Villringer A. Rolandic alpha and beta EEG rhythms' strengths are inversely related to fMRI-BOLD signal in primary somatosensory and motor cortex. Hum Brain Mapp 2009;30:1168-1187. 9. Power JD, Cohen AL, Nelson SM, et al. Functional Network Organization of the Human Brain. Neuron 2011;72:665-678. 10. Fan LZ, Li H, Zhuo JJ, et al. The Human Brainnetome Atlas: A New Brain Atlas Based on Connectional Architecture. Cereb Cortex 2016;26:3508-3526. 11. Scheeringa R, Petersson KM, Kleinschmidt A, Jensen O, Bastiaansen MC. EEG alpha power modulation of fMRI resting-state connectivity. Brain Connect 2012;2:254-264. 12. Darian-Smith C, Darian-Smith I, Cheema SS. Thalamic projections to sensorimotor cortex in the macaque monkey: use of multiple retrograde fluorescent tracers. J Comp Neurol 1990;299:17-46. 13. Locke S, Angevine JB, Jr., Yakovlev PI. Limbic nuclei of thalamus and connections of limbic cortex. VI. Projection of the lateral dorsal nucleus to the posterior cingulate gyrus in the cat and monkey. Transactions of the American Neurological Association 1964;89:216-217. 14. van Luijtelaar G, Hramov A, Sitnikova E, Koronovskii A. Spike-wave discharges in WAG/Rij rats are preceded by delta and theta precursor activity in cortex and thalamus. Clin Neurophysiol 2011;122:687-695.Figures