3744
Divergent structural and functional changes across brain hierarchy account for population variation in demographics and behaviorFeng Han1 and Xiao Liu1,2
1Biomedical Engineering, Pennsylvania State University, State College, PA, United States, 2Institute for Cyber Science, Pennsylvania State University, State College, PA, United States
Synopsis
A robust link was recently established between resting-state functional connectivity and human behavioral measures. To understand the structural basis underlying this relationship, we examined the population covariation of the cortical thickness, resting-state connectivity, and a set of demographic and behavioral measures. We found that divergent changes at the lower- and higher-order brain regions in the cortical thickness and resting-state connectivity are structural and functional imaging features that are most tightly linked to the population behavioral variation. The findings suggest that differentiated changes across brain hierarchy could be important to brain function.
Introduction
Understanding the neural basis of individual differences is an important goal of modern neuroscience. A data-driven canonical correlation analysis (CCA) on imaging and behavioral data of a large cohort of subjects in the Human Connectome Project (HCP) has identified a single mode of population variation that links individuals’ functional brain connectivity with their demographic and behavioral measures and also features a behavioral change from negative to positive personal traits1. However, the structural basis of such a one-dimensional functional connectivity-behavior relationship remains largely unknown. Here, we investigate the potential role of brain structures in this relationship by examining the covariation of the population covariation of the cortical thickness, resting-state connectivity, and behavioral measures.Methods
We used imaging and behavioral data from 818 HCP subjects2. Resting-state functional connectivity among 200 distinct brain regions are provided by the HCP PTN (Parcellation + Timeseries + Netmats) datset3. We also used the cortical thickness map on the brain surface of 32K resolution and included 129 behavioral/demographic measures for analysis. We performed the principal component analysis (PCA) to reduce non-subject dimensions to 100 before applying CCA to explore pairwise relationships among these three modalities. The age, gender, brain size, and head motions were regressed out from the CCA analyses. Permutation test were used to derive statistical significance1. The first CCA mode was taken as the principal mode for each CCA analysis. The measures of three modalities were correlated with corresponding canonical variates across subjects to derive thickness scores, behavior scores and connectivity scores. For each brain region/parcel, we then count the number of its connections showing significantly increased or decreased strength along the direction of CCA mode to represent regional modulations in functional connectivity. We also used the first principal component to represent an eigen-direction of 6 canonical variates from the three CCA analyses.Results
The CCA found a single significant mode (r = 0.70, p = 1.0×10⁻⁴) linking the cortical thickness with demographic/behavioral measures. Positive and negative personal traits show opposite correlations with this identified CCA mode, similar to what has been previously observed with the connectivity-behavior CCA mode. More interestingly, the cortical thickness across the neocortex displays distinct correlations with this CCA mode: the lower-level sensory regions, including sensorimotor, auditory and visual cortices, show significant positive correlations whereas the higher-order brain regions, mostly the default mode network (DMN) and frontal regions, are characterized by negative values (Fig. 1). The finding suggests that individuals with more positive personal traits tend to have thinner gray matter at the higher-order brain regions but thicker cortex at the sensory areas. We also applied CCA to resting-state connectivity and behavioral data and replicated the previous finding about the connectivity-behavior CCA mode. A close inspection on the modulation of functional connectivity along the connectivity-behavior mode revealed a similar divergent change in these two sets of brain areas. The connectivity strength increase along the mode direction is the highest in the higher-order regions, particularly the DMN, but the lowest at the sensory areas. In contrast, the connectivity strength decrease showed completely opposite pattern of changes (Fig. 2). Finally, we derived the CCA mode between the cortical thickness and functional connectivity data in a similar way and compared it with the previous two modes. The result suggests that the three CCA modes are highly correlated with each other with the same modality of data modulating in a similar way in different CCA analyses (Fig. 3).Discussion
By examining the population covariation of the cortical thickness, resting-state functional connectivity, and demographic/behavioral measures from a large cohort of subjects, we found a specific direction linking the three modalities of data, along which they all show specific patterns of change. Individuals tend to have more positive personal traits towards one end of this direction, which are also associated with divergent changes at the lower- and higher-order brain regions in both structural and functional imaging data: the thinner cortex and stronger resting-state connectivity at the higher-order areas but opposite modulations at the lower-order sensory regions. The cortical area of these two sets of brain regions has been found to expand disproportionally with the brain size increase, over the developmental course, and across species4, suggesting their distinct roles in brain functions. Our findings suggest that divergent changes of the cortical thickness at the brain regions of distinct hierarchy could be an important structural feature that is tightly linked to human behavior.Conclusion
Divergent changes at the lower- and higher-order brain regions in the cortical thickness and resting-state functional connectivity are the structural and functional imaging features most strongly correlated with inter-subject behavioral variation.Acknowledgements
This study is supported by the NIH Pathway to Independence Award (K99/R00).References
- Smith SM, Nichols TE, Vidaurre D, et al. A positive-negative mode of population covariation links brain connectivity, demographics and behavior. Nat Neurosci. 2015;18(11):1565-1567.
- Van Essen DC, Smith SM, Barch DM, Behrens TEJ, Yacoub E, Ugurbil K. The WU-Minn Human Connectome Project: An overview. Neuroimage. 2013;80:62-79.
- Bijsterbosch J, Harrison S, Duff E, Alfaro-Almagro F, Woolrich M, Smith S. Investigations into within- and between-subject resting-state amplitude variations. Neuroimage. 2017;159(March):57-69.
- Reardon PK, Seidlitz J, Vandekar S, et al. Normative brain size variation and brain shape diversity in humans. Science. 2018;10(1126)/science. aar2578.
Figures

Figure 1 Behavior and thickness scores of the principal thickness-behavior CCA
mode. (A) Top 10 positive and 10 negative behavioral/demographic
measures most strongly associated with the CCA mode. (B) Brain surface
map showing thickness scores (Fisher’s Z-scores, thresholded at p<0.05).
(C) Thickness changes in two masks (covering regions with significant
positive/negative thickness scores in (B)) in 4 groups of subjects along
the CCA mode direction. (D) Scatter-plot of thickness variate versus
behavioral variate; one point per subject with color encoding fluid
intelligence values. (E) Statistical significance (p-values) of first 10 thickness-behavior CCA modes derived by
comparing with permuted null distributions.

Figure 2 Connectivity strength modulations along the principal connectivity-behavior
CCA mode. (A) The surface map displaying, for each parcel, the number of
its functional connections whose strength (the original score is multiplied by
the sign of mean connectivity) shows significant positive correlation with the
CCA mode. (B) The surface map displaying the number of sign-corrected connections
whose strength shows significant negative correlation with the CCA mode. (C)
The difference between results shown in (A)
and (B). (D) Accompanying with (C),
averaged map statistics within masks of the lower-level sensory region (red) and
higher-order brain areas (blue, significantly different from red).
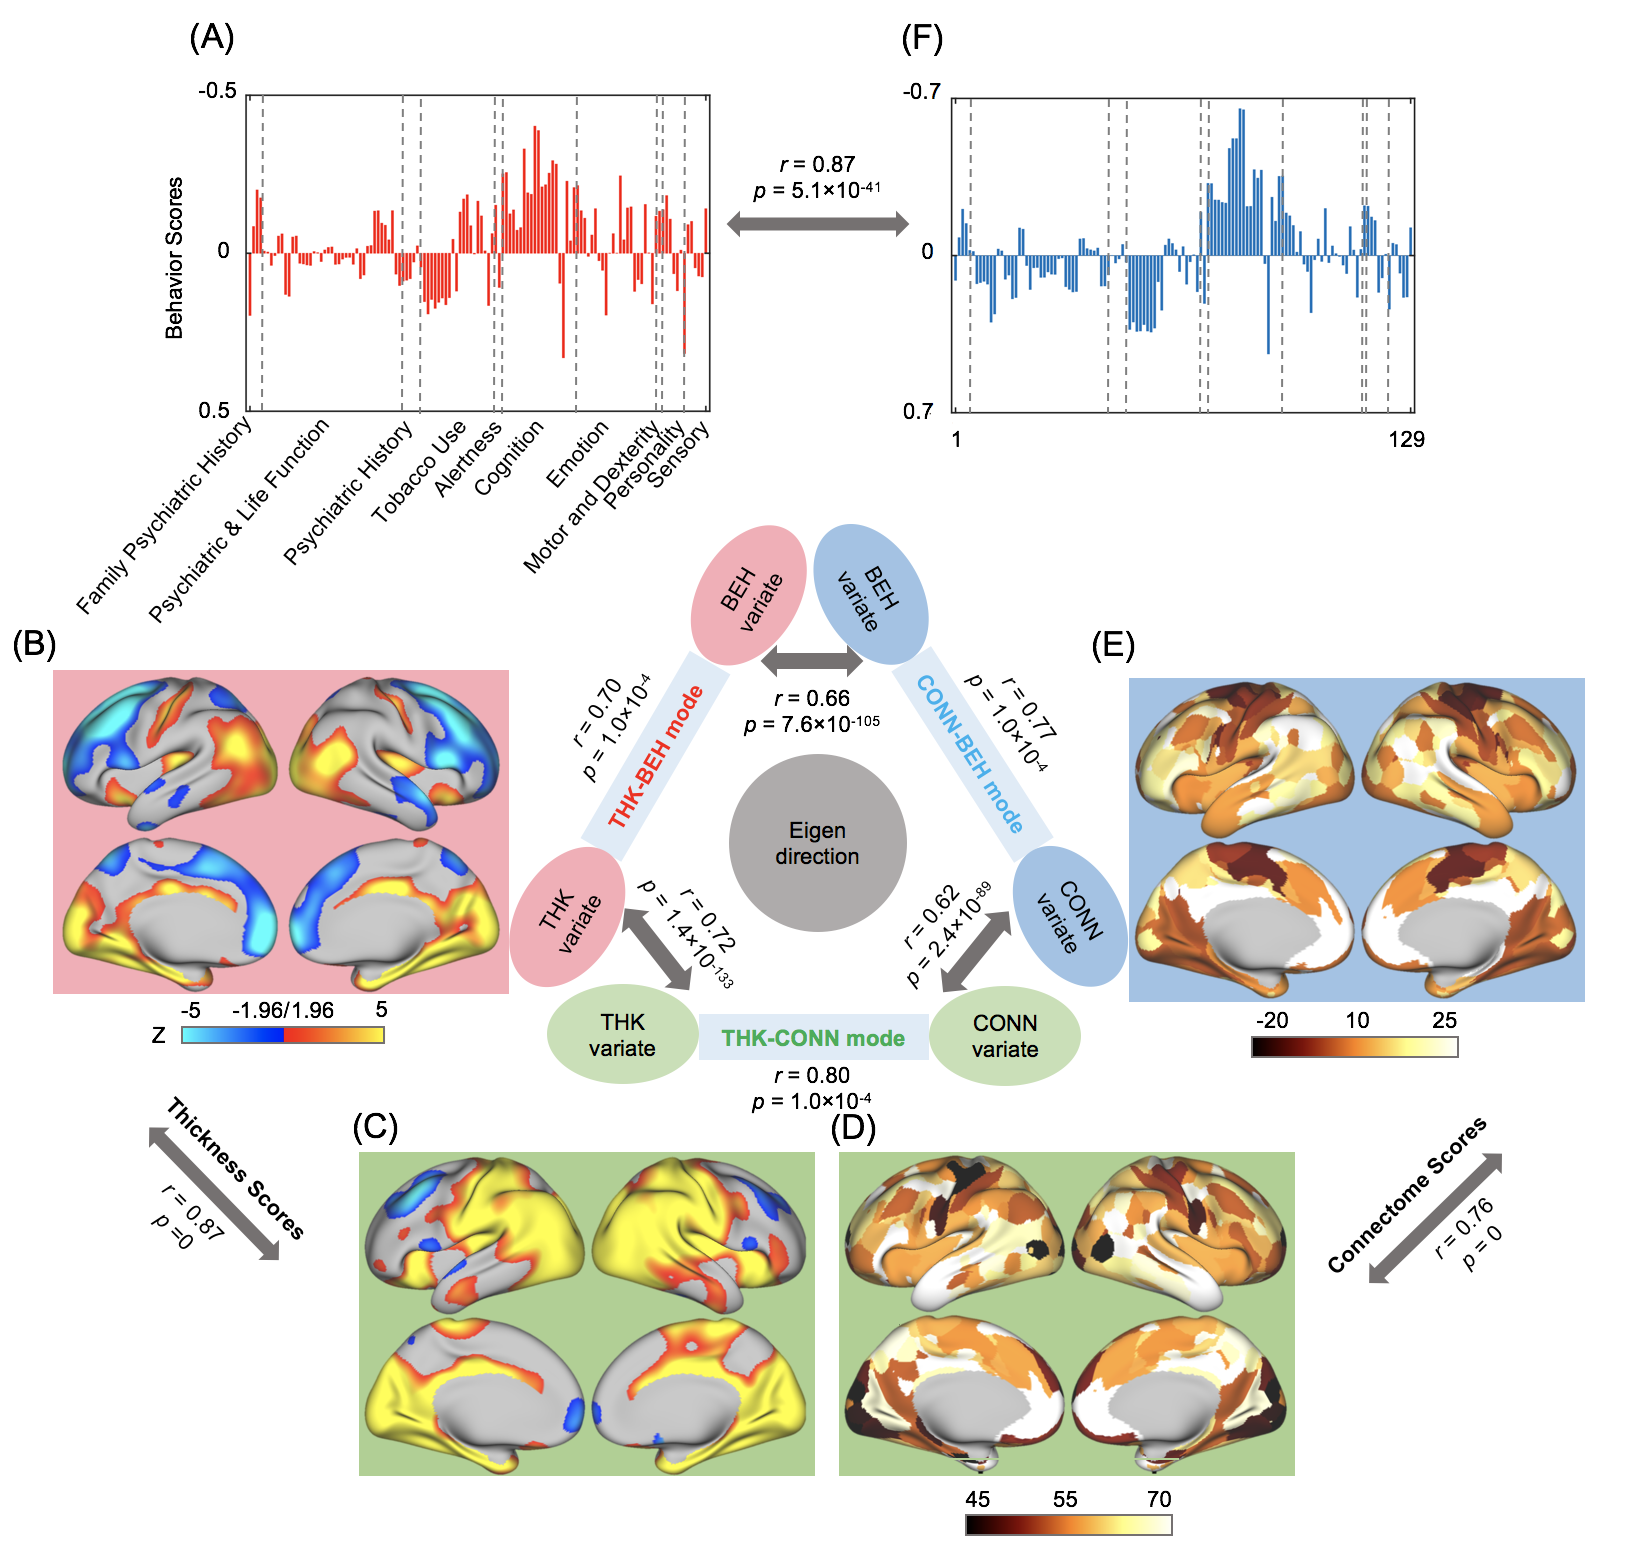
Figure 3 A summary of pairwise CCA results among the cortical thickness (THK), resting-state connectivity (CONN), and
behavioral/demographic measures (BEH). The three CCA modes are aligned in a
similar direction as evident by similarities between the corresponding THK scores
(B and C), the CONN scores (D
and E), and BEH scores (A and F). Three pairs of variates derived from corresponding CCA modes
are highly correlated.