3743
The Relationship between Local Field Potential and Blood-oxygenation-level Dependent Signal Can Be Nonlinear1Biomedical Engineering, Georgia Institute of Technology and Emory University, Atlanta, GA, United States
Synopsis
Many studies that involve simultaneous local field potential (LFP) and blood-oxygenation-level dependent (BOLD) signal measurements use correlation analysis, which assumes a linear relationship between the two. To experimentally determine whether the relationship is linear, we obtained a LFP vs BOLD response curve from simultaneous LFP and BOLD measurements. The relationship between the two was nonlinear under isoflurane but not under dexmedetomidine, which suggests that correlation may not always correctly capture the relationship between LFPs and BOLD.
Purpose
Recent studies have shown the blood-oxygenation-level dependent (BOLD) signal in resting-state fMRI is correlated with the power modulations of the local field potential (LFP) under various conditions1-5. However, these analysis involving Pearson correlation automatically assume a linear relationship between LFP and BOLD, which is not necessarily true. From the perspective of basic neuroscience, the type of relationship between LFPs and BOLD can help in interpreting neuroimaging studies. Here we closely examined the simultaneous LFP and BOLD recording data, and found that the relationship between LFP and BOLD can be nonlinear, depending on the anesthetic agent used. Subsequent analysis suggests that such nonlinearity solely comes from the non-Gaussian distribution of LFP power.Methods
Experiments: Resting state-fMRI scans and LFP recordings were acquired simultaneously on 22 Sprague-Dawley rats, with 32 sessions from 12 rats under Isoflurane (ISO) ranging from 1.2% to 2%, and 22 sessions from 10 rats under dexmedetomidine (DMED) anesthesia (subcutaneous infusion stepping from 0.05 mg/kg/h to 0.15 mg/kg/h after 1.5 hours). Single slice gradient echo EPI scans were obtained on a 9.4T small animal MRI system (Bruker, Billerica, MA) with scan parameters: TR/TE = 500/15ms, voxel size = 0.3*0.3*2mm, matrix size=64*64, repetitions=1000. LFPs were recorded using glass electrodes placed on the primary somatosensory cortex (S1) in both hemispheres at a sampling rate of 12KHz. FMRI preprocessing: Motion-correction, spatially smoothing (FWHM=0.84mm), bandpass filtering (0.01~0.1Hz under ISO and 0.01~0.25Hz under DMED), global signal and linear trend regression were performed sequentially. LFP preprocessing: the gradient-induced artifacts was removed following established methods4 and the LFP time courses were low pass filtered to 100Hz. The LFP band-limited power time courses were calculated by integrating the power spectral density (PSD) function estimated from a 1-second long sliding window, (which moves 0.5 second at each step to match the fMRI temporal resolution) and then band pass filtered (0.01~0.1Hz under ISO and 0.01~0.25Hz under DMED). LFP vs BOLD response: both LFP and BOLD time points were z-scored and pooled together, then the BOLD time points were evenly divided into 10 groups based on the amplitude, and the LFP power time points a certain lag before the corresponding BOLD time points (4 seconds under ISO, 2.5 seconds under DMED) were averaged within each BOLD group, producing the experimental LFP vs BOLD response.Results and Discussions
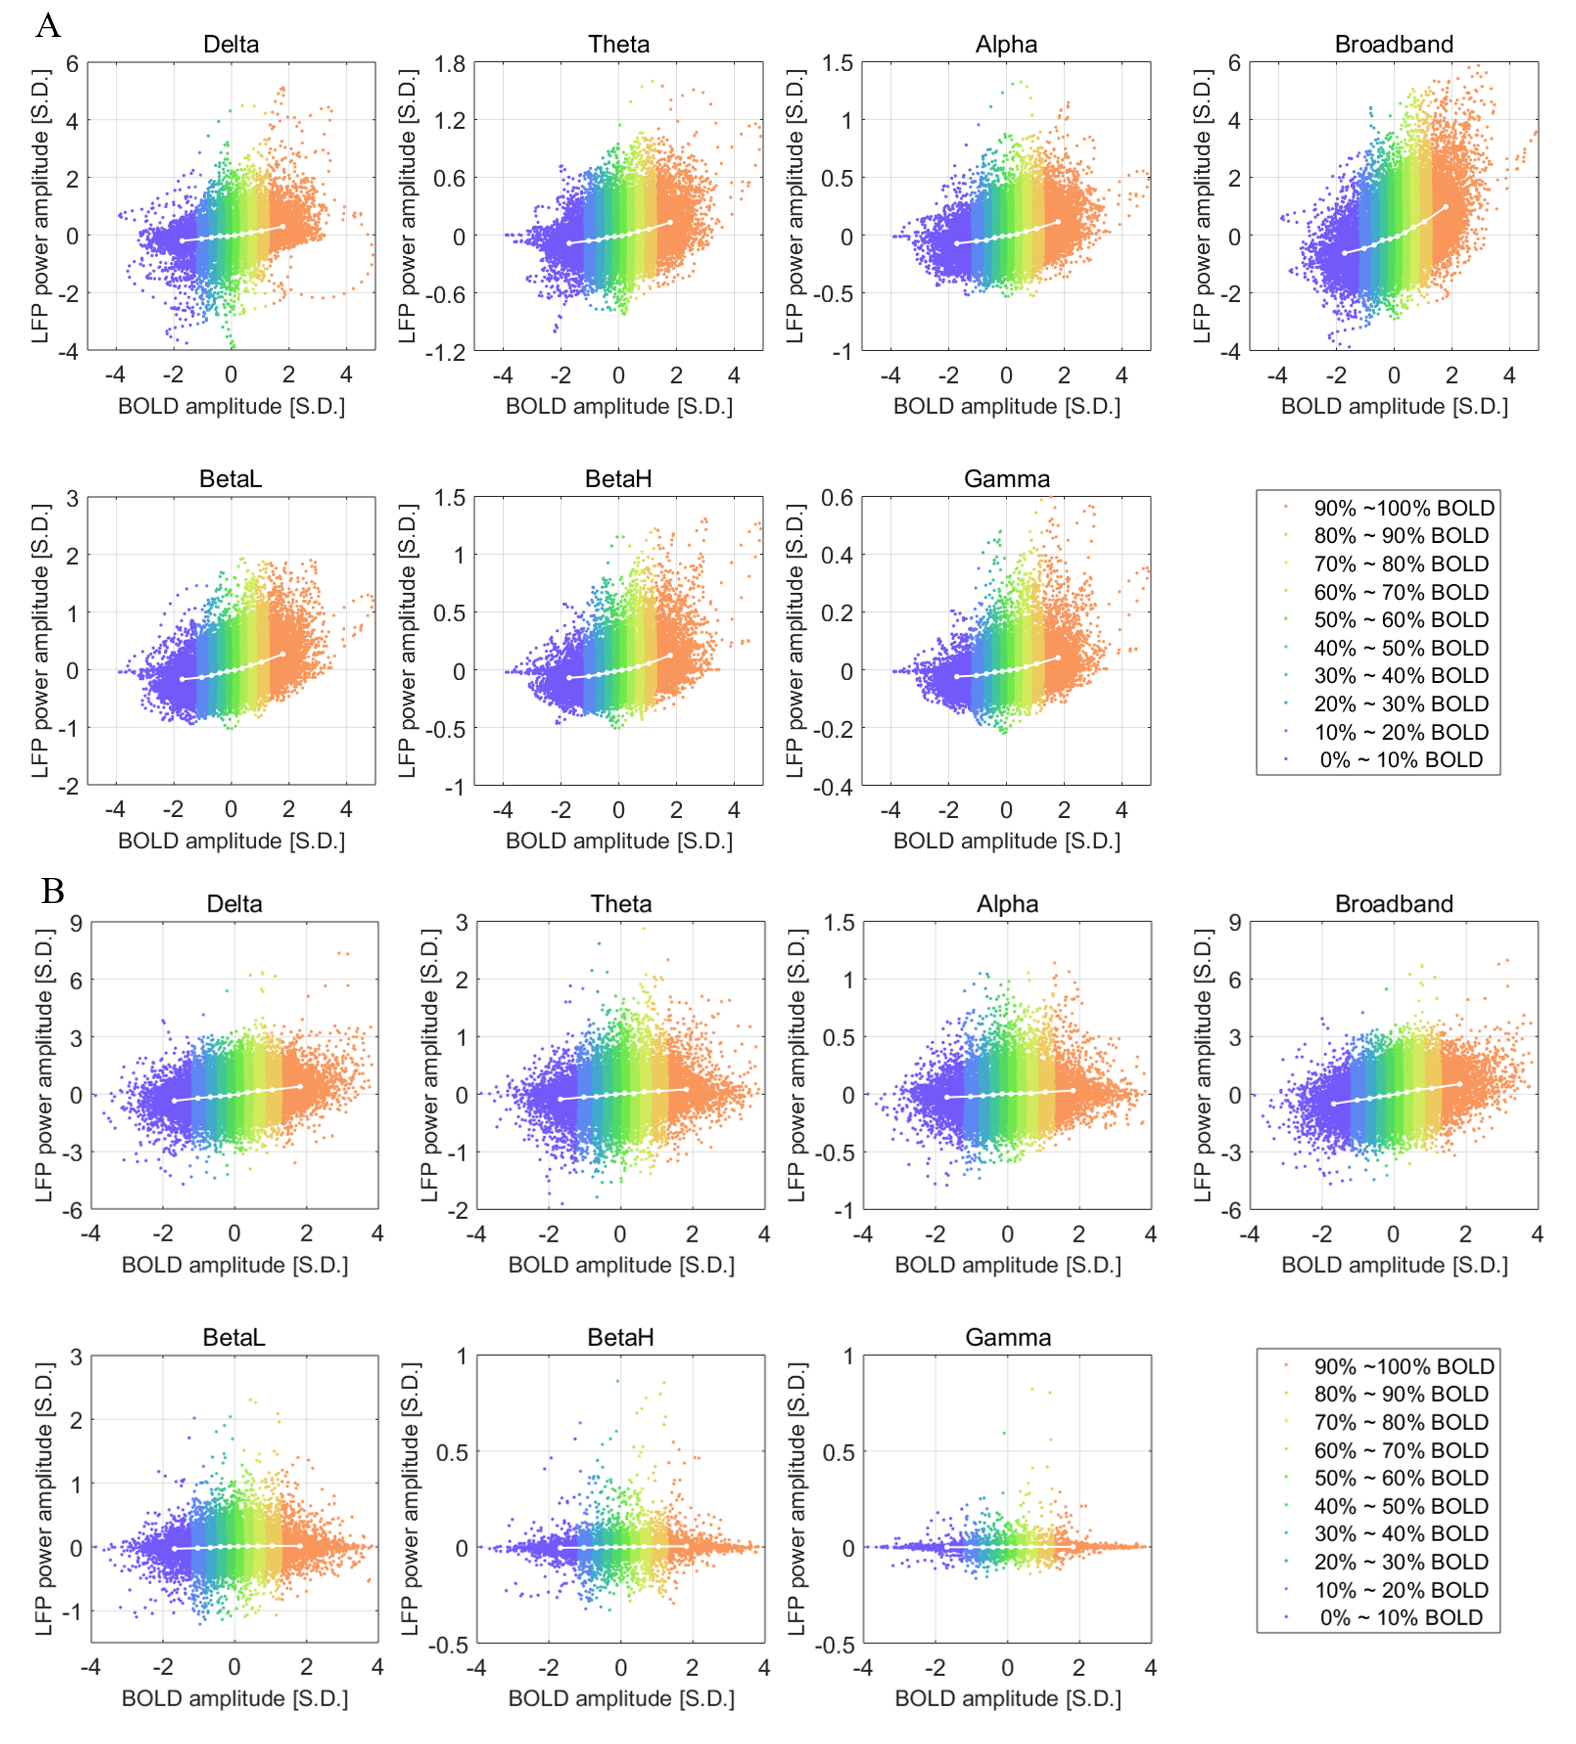
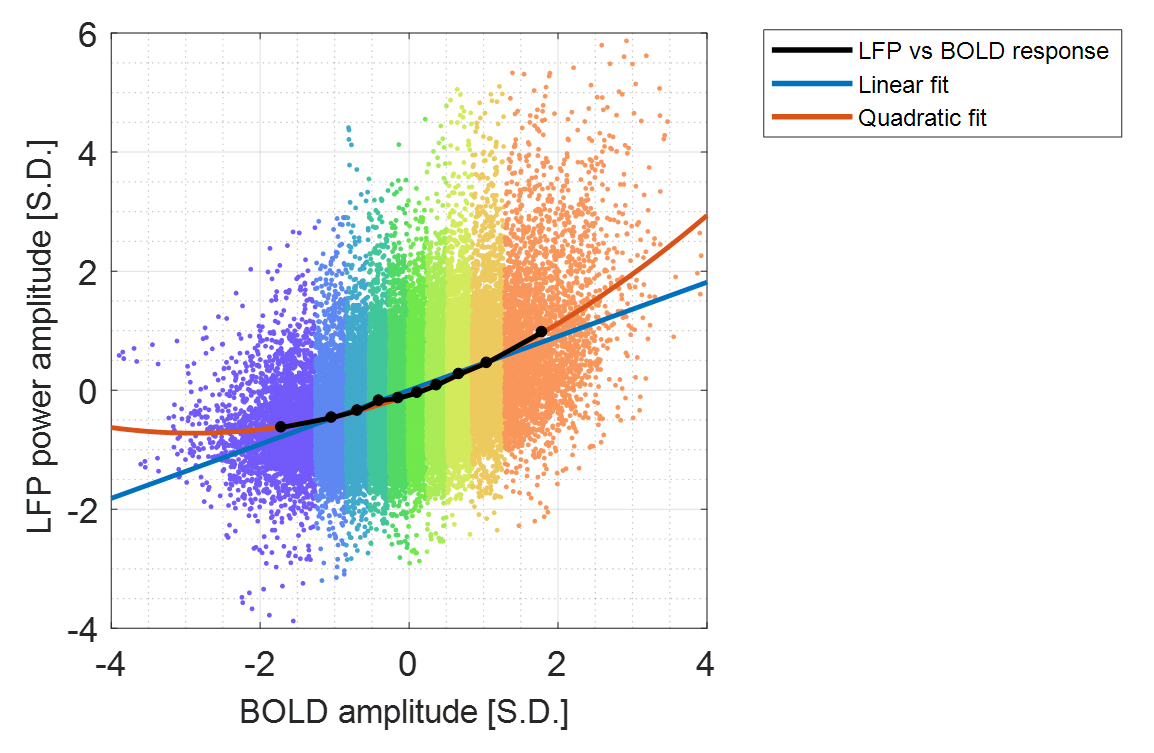
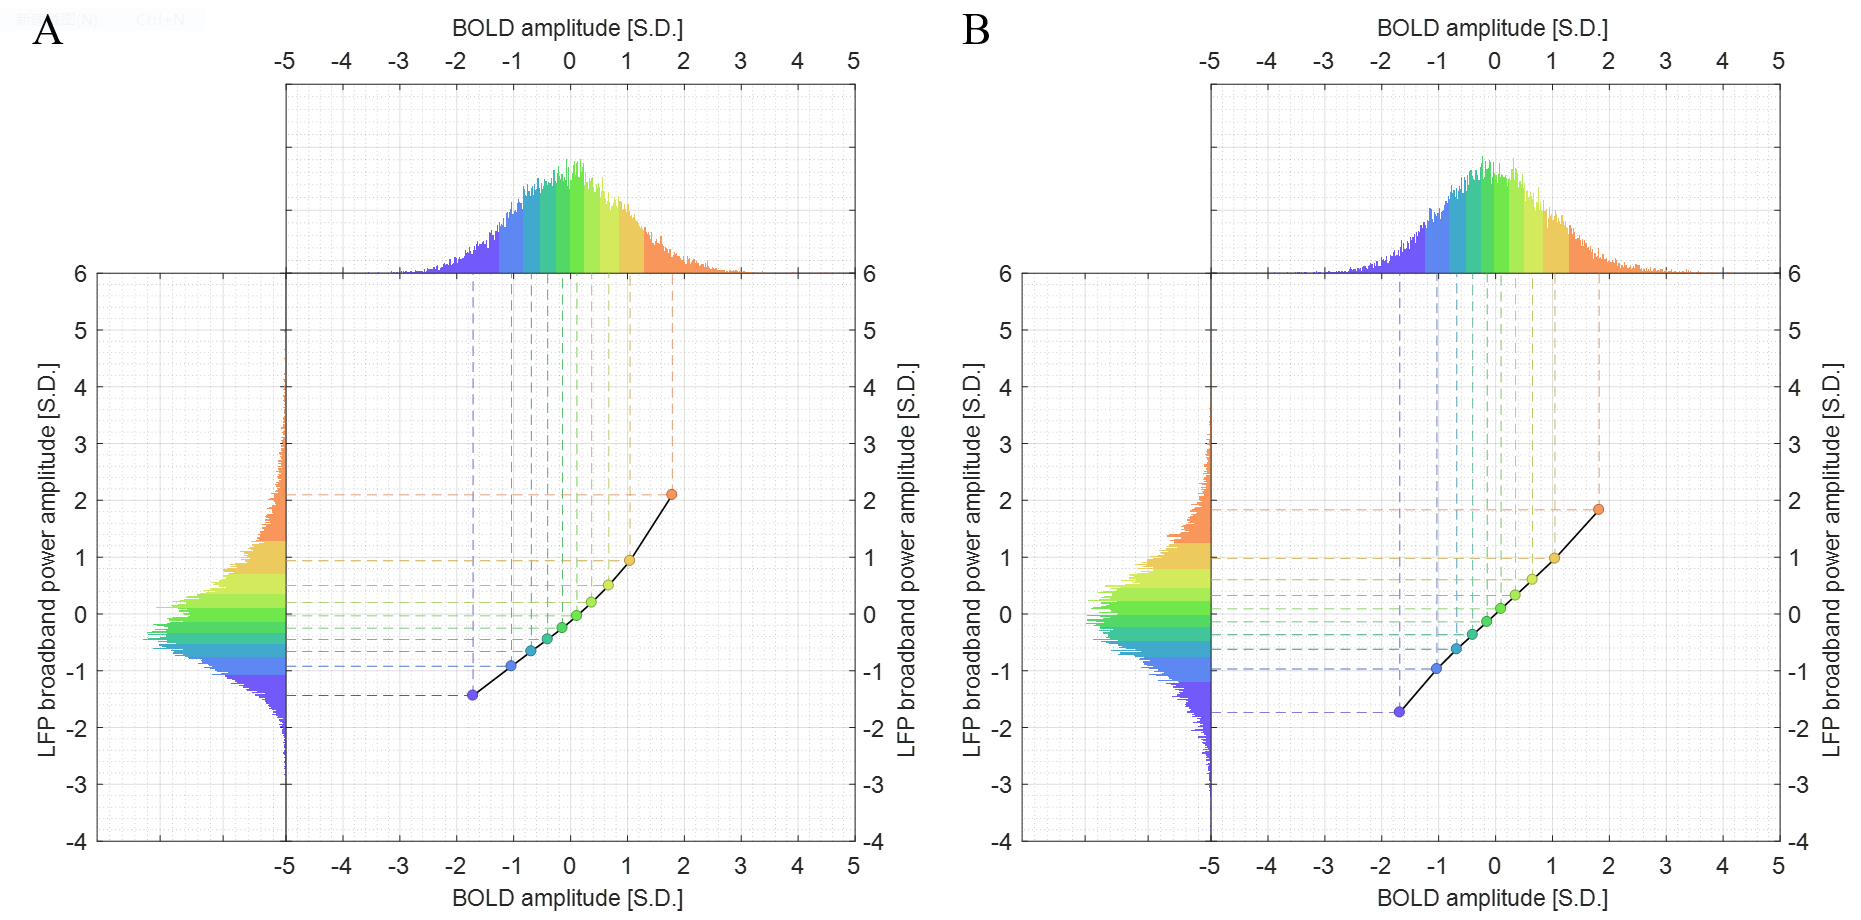
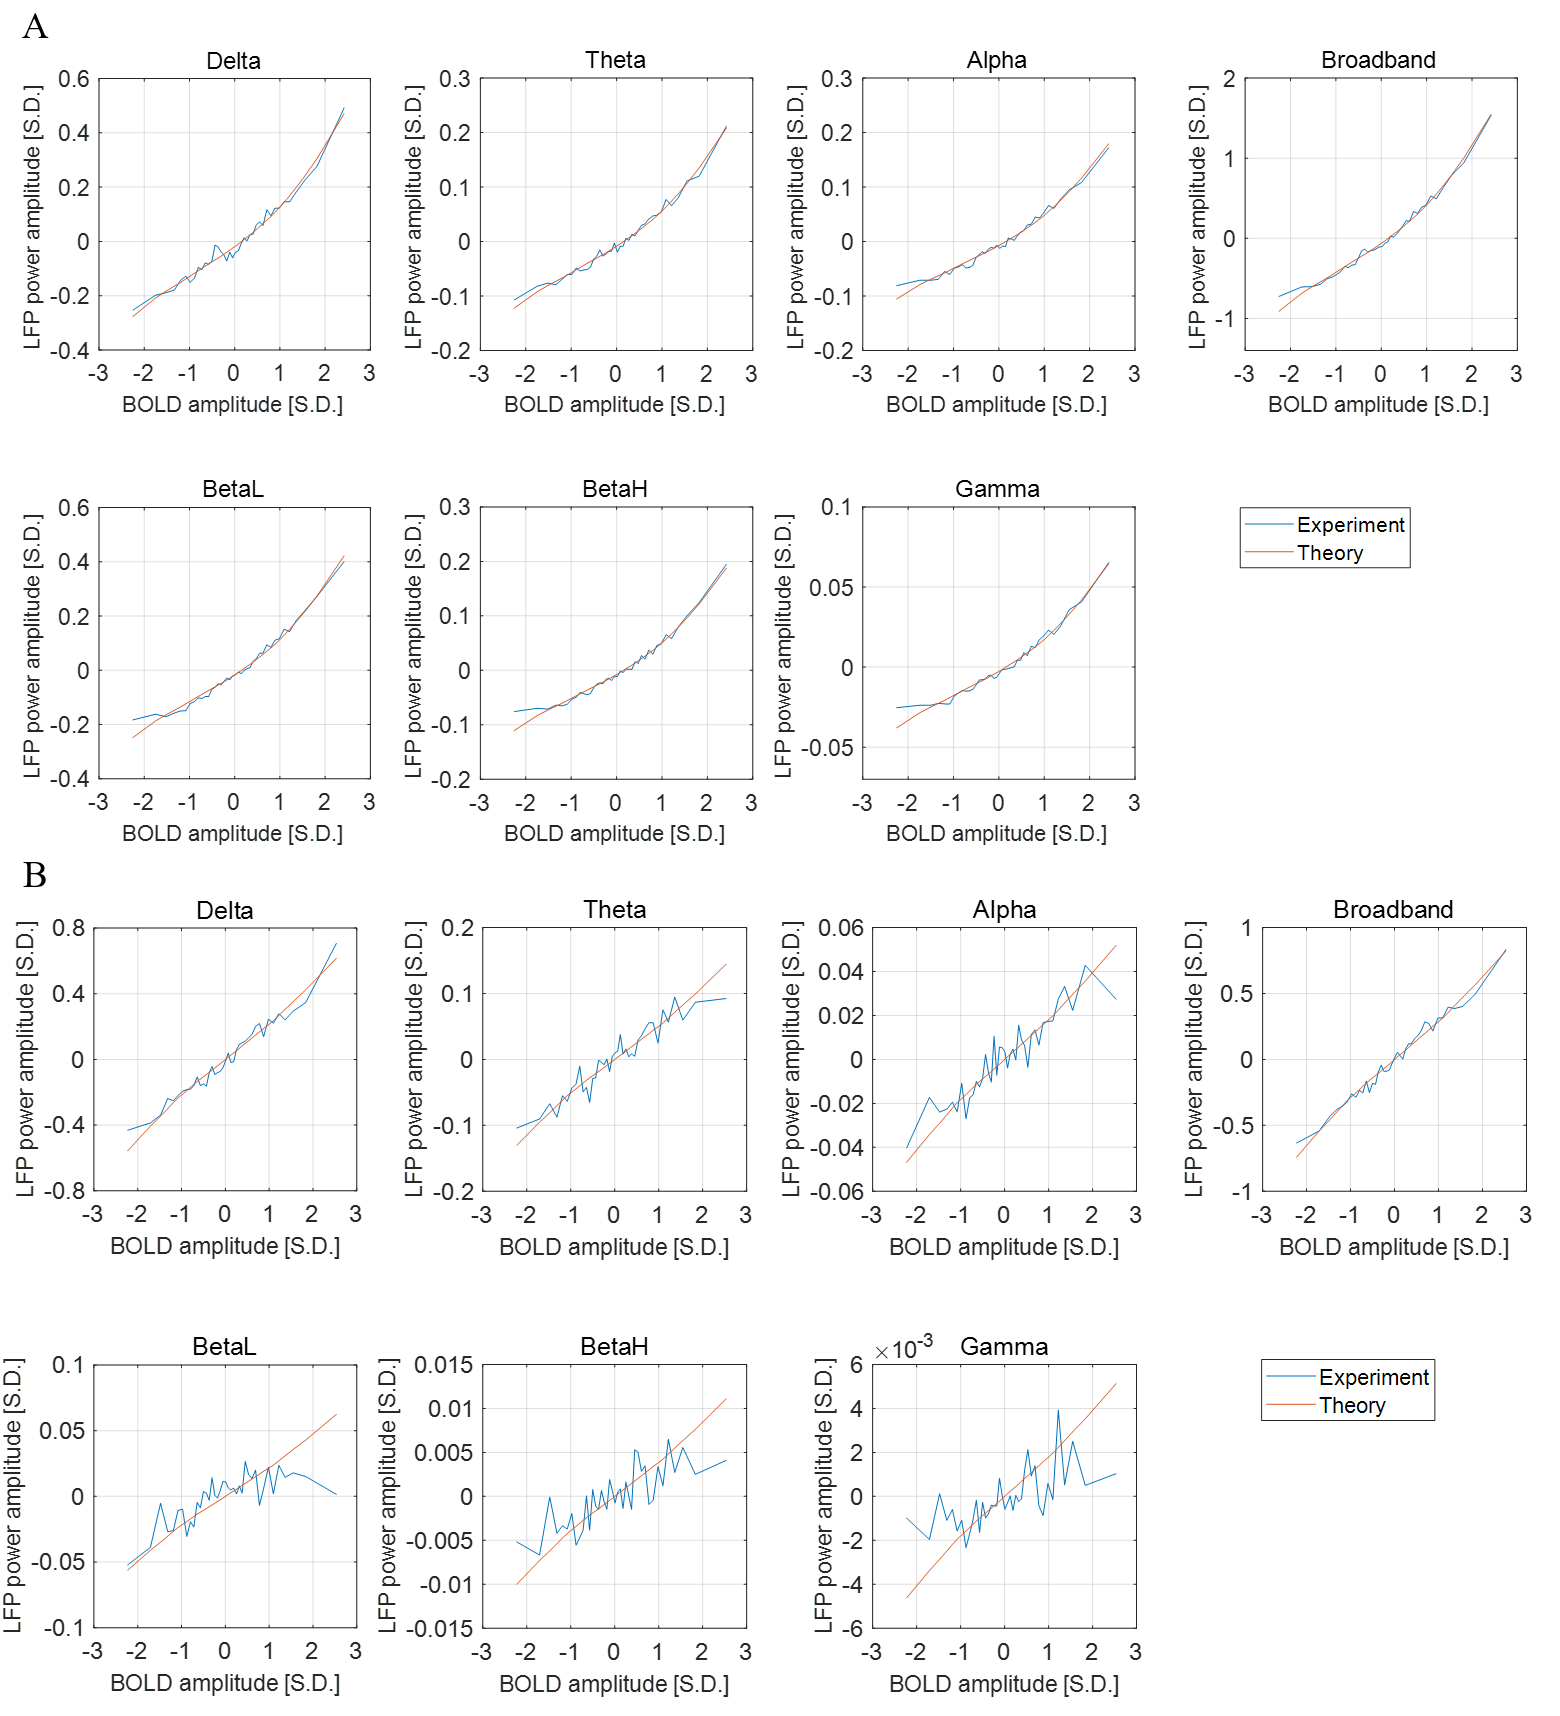
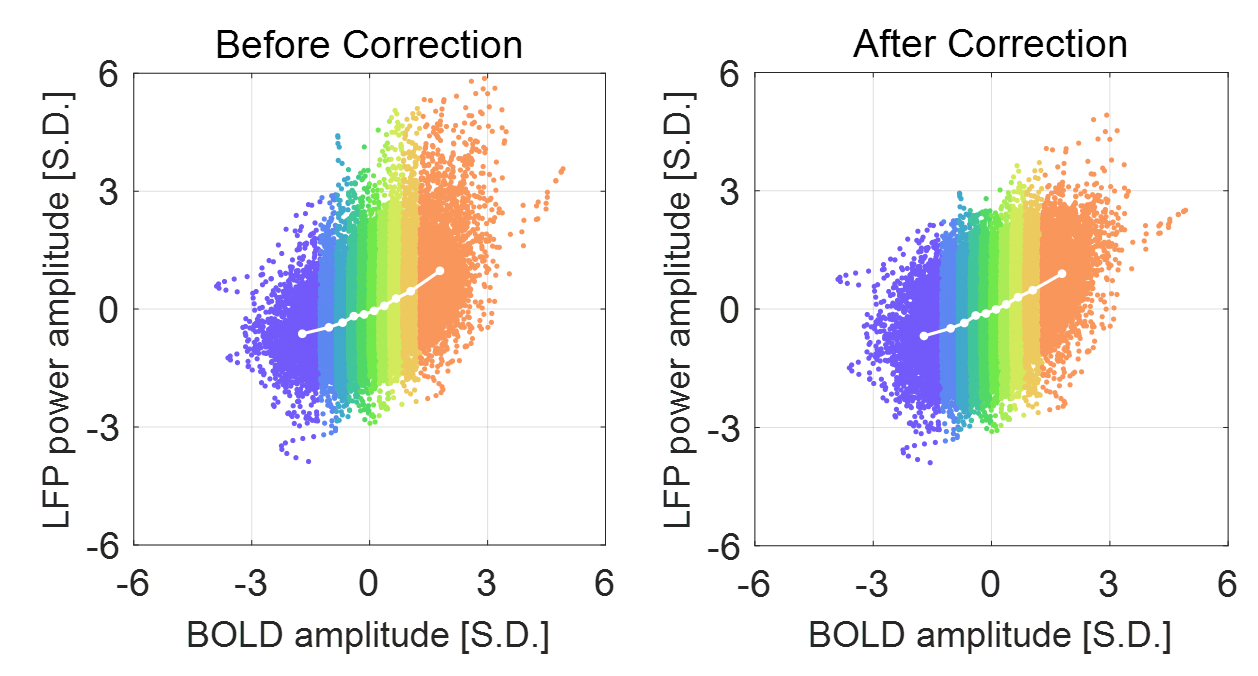
Figure 1 shows the relationship between LFP and BOLD using a scatter plot. It can be seen that the LFP vs BOLD response (line plot) appear nonlinear under ISO and linear under DMED, across almost all LFP frequency bands. This nonlinearity can be modeled rather well by adding a quadratic term (shown in Figure 2), however, the origin of the nonlinearity is not identified, and the quadratic term is difficult to interpret. We noticed that under ISO, the LFP power distribution is positively skewed (right tailed). So we hypothesized that the nonlinearity in the LFP vs BOLD response solely comes from the non-Gaussian distribution of the LFP power under ISO. Following the hypothesis, we evenly divided the LFP broadband power into 10 groups, and within each LFP group, assigned the mean LFP amplitude of each LFP group to the mean BOLD amplitude of its corresponding BOLD group (the process is illustrated in Figure 3). The obtained theoretical LFP vs BOLD response was then validated by fitting with the LFP power in individual frequency bands. It can be seen from Figure 4 that the derived theoretical LFP vs BOLD responses match fairly well with the experimental ones, suggesting the nonlinearity solely comes from the non-Gaussian distribution of LFP power under ISO anesthesia, which might be attributed to the burst firing. Since the Pearson correlation coefficient only reflects linear dependency, considering the nonlinearity present between LFP and BOLD, in the future it is reasonable to use more generalized methods that do not assume linear relationship (e.g. mutual information) when analyzing simultaneous LFP and BOLD measurements, although preliminary analysis shows that correcting the nonlinearity does not influence Pearson correlation coefficient significantly (Figure 5).Conclusion
We examined the simultaneous LFP and BOLD recording data and found that the relationship between LFP and BOLD can be nonlinear, depending on the anesthetic agent used. Under ISO there is clear evidence not only showing the relationship is nonlinear, but also suggesting such nonlinearity solely comes from the non-Gaussian distribution of LFP power. This implies that in the future, more generalized methods that do not assume linear dependency might be preferred to correlation analysis, although in this particular situation under ISO, the nonlinearity has little impact on the Pearson correlation coefficient.Acknowledgements
Funding sources: NIH 1 R01NS078095-01, BRAIN initiative and NSF INSPIRE. The authors would like to thank Chinese Scholarship Council (CSC) for financial support.References
1. Logothetis NK, Pauls J, Augath M, et al. Neurophysiological investigation of the basis of the fMRI signal. Nature. 2001;412(6843):150.
2. Lu H, Zuo Y, Gu H, et al. Synchronized delta oscillations correlate with the resting-state functional MRI signal. Proceedings of the National Academy of Sciences. 2007;104(46):18265-9.
3. Shmuel A, Leopold DA. Neuronal correlates of spontaneous fluctuations in fMRI signals in monkey visual cortex: implications for functional connectivity at rest. Human brain mapping. 2008;(7):751-61.
4. Pan WJ, Thompson G, Magnuson M, et al. Broadband local field potentials correlate with spontaneous fluctuations in functional magnetic resonance imaging signals in the rat somatosensory cortex under isoflurane anesthesia. Brain connectivity. 2011;1(2):119-31.
5. Magri C, Schridde U, Murayama Y, et al. The amplitude and timing of the BOLD signal reflects the relationship between local field potential power at different frequencies. Journal of Neuroscience. 2012;32(4):1395-407.
Figures