3742
On the variability of cardiac pulse artifacts across heartbeats affecting EEG recordings in simultaneous EEG-fMRI: a 7T study1Laboratory for Functional and Metabolic Imaging, École Polytechnique Fédérale de Lausanne, Lausanne, Switzerland, 2Functional Brain Mapping Lab, University of Geneva, Geneva, Switzerland, 3Biomedical Imaging Research Center (CIBM), Lausanne and Geneva, Switzerland, 4Department of Radiology, University of Lausanne, Lausanne, Switzerland, 5Department of Radiology, University of Geneva, Geneva, Switzerland
Synopsis
EEG recordings performed in MRI scanners suffer from complex artifacts caused by heart function, termed pulse artifacts (PAs), which can strongly compromise EEG quality. This study investigated the properties and mechanisms of PA variability across heartbeats, which remains poorly understood. Simultaneous EEG-fMRI was performed at 7T on healthy participants with concurrent breathing and cardiac recordings. PA variability showed an important impact on EEG quality, and was linked not only to changes in head position/orientation across time, but also, and more importantly, to respiration and heart rate. These findings have important consequences for PA correction, highly relevant to most EEG-fMRI applications.
Introduction
Scalp electroencephalography (EEG) and functional magnetic resonance imaging (fMRI) can be combined to image brain function with high spatio-temporal resolution, yet this originates challenging artifacts. A major artifact contribution for EEG arises from cardiac function in B0, creating pulse artifacts (PAs). PA correction is most often performed by average artifact subtraction (AAS),1 assuming a periodic artifact shape that varies slowly throughout the recording, putatively due to drifts in head position/orientation. However, important PA residuals are often found after AAS correction,1,2,3 which appear to be caused by faster variations in the artifact (Fig.1), that are poorly understood. This type of variability may remain a crucial source of residual artifacts in numerous studies. The aim of this work was to investigate, for the first time, the properties and mechanisms of PA variability in EEG-fMRI, and evaluate its impact on PA correction. Based on past insights on the biophysical sources of the PA,4 and cardiorespiratory physiology, we hypothesize that respiration, heart rate, and head motion may be linked to PA variability.Methods
Data acquisition: Simultaneous EEG-fMRI was performed on 12 healthy human participants at 7T, where the PA has a larger signal-to-noise ratio than in more conventional 3T studies. The data were acquired on a Magnetom 7T (Siemens) with an 8-channel RF array (Rapid Biomedical). Whole-brain fMRI was performed using simultaneous multi-slice (SMS) GE-EPI with TRvol=1s, 2.2-mm isotropic resolution, 3×SMS acceleration. 64-channel scalp EEG was recorded using a compact setup5 with two 32-channel amplifiers (Brain Products). One electrode was dedicated to ECG recording. Respiratory traces were acquired concurrently, at 50 Hz, using a respiratory belt (Siemens). Each subject underwent two EEG-fMRI acquisitions: 8-min eyes-open resting-state, and 5-min visual stimulation (10 blocks of 10s-stimulation with 7.5Hz reversing checkerboards, 20s-fixation). For variability assessment, resting-state EEG was also acquired outside the scanner in 4 subjects; an 8-min phantom EEG-fMRI acquisition was also performed.
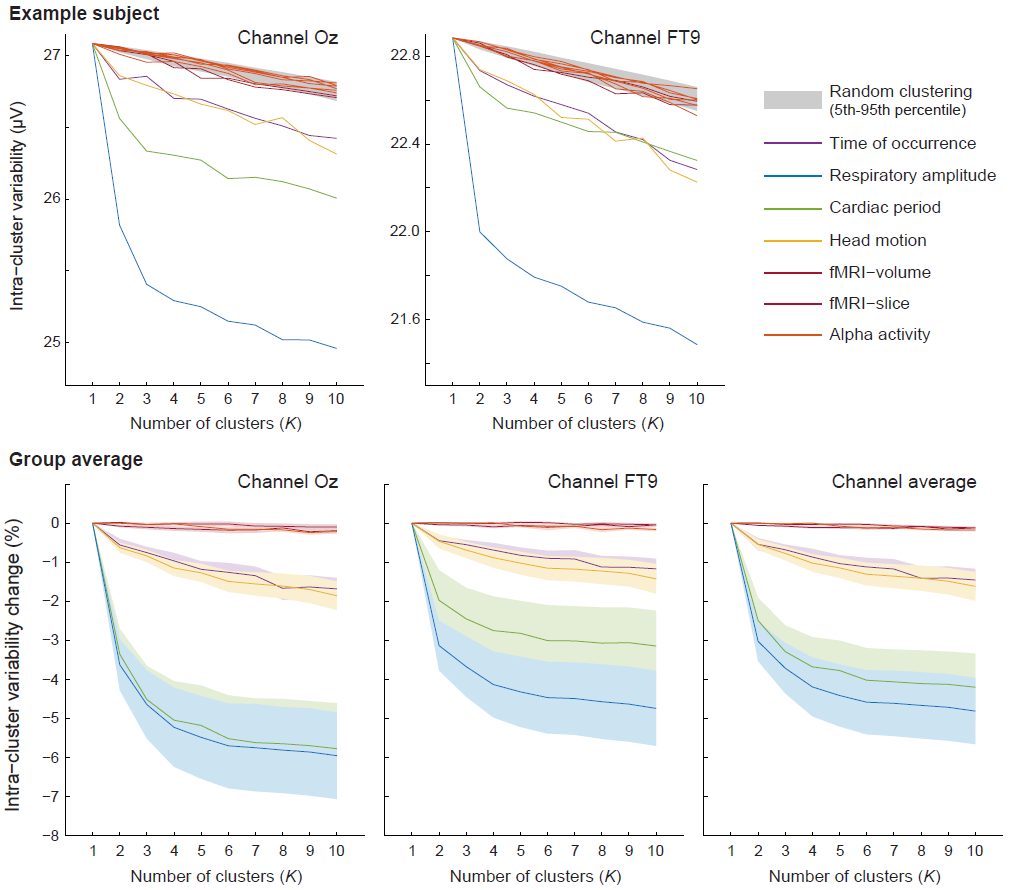
Data analysis: All EEG data were gradient artifact-corrected and bandpass-filtered (0.5–35Hz). All PA epochs were marked, as in previous work.5,6 To investigate mechanisms linked to PA variability, each PA epoch of the resting-state data was attributed a set of variables describing its associated: time of occurrence, respiratory amplitude, cardiac period, head position/orientation (from the fMRI data), and potential confounds (phase of occurrence within the fMRI acquisition, to control for potential contributions from gradient artifact residuals; alpha power and phase, extracted with ICA, to control for ongoing EEG activity). Every variable, plus a random variable, underwent a clustering analysis, described in Fig.2. Subsequently, three PA correction approaches were tested: AAS (with 2–100 epochs for the averaging window size), optimal basis sets (OBS, with 1–50 components), and K-means clustering7 (using 1–50 clusters). Correction performance was assessed on the visual stimulation data, based on the quality of the elicited visual evoked potentials (VEPs).
Results
PA power and inter-epoch variance were estimated for three different groups: in-scanner resting-state data (expected to contain PA contributions, real EEG, EEG-specific artifacts and MR environment-related artifacts), off-scanner data (real EEG and EEG-specific artifacts), and phantom in-scanner data (MR environment-related artifacts). In-scanner resting-state data showed the strongest PA power and variance (Fig.3). Assuming all signal and artifact contributions are uncorrelated, the variations across the 3 groups indicate that PA-specific variability is present (p<0.05), and substantial, on the order of 529 μV2 at 7T – translating to 97 μV2 at 3T. Intra-cluster PA variability generally decreased with K (Fig.4). These decreases were strongest when using respiratory amplitude or cardiac period as clustering variables (4.8±0.8% and 4.2±0.9%, respectively, at K=10), followed by head motion and time of occurrence (1.6±0.4% and 1.5±0.3%). For these four variables, the resulting intra-cluster variability was well below random clustering (p<0.01). In contrast, the confounds showed only marginal, non-significant reductions. For the tested PA correction techniques, the optimal parameters, found by VEP inspection, were 20–36 epochs for AAS, 5–8 principal components for OBS, and 10–17 clusters for K-means, across subjects. These yielded clear VEPs for most subjects, which were generally indiscernible before correction. Overall, considering VEPs and fixation periods, AAS showed the largest residuals, comparable to grand-average (non-adaptive) subtraction (Fig.5), and therefore poorly-effective in capturing PA variability. OBS yielded the cleanest traces, but also appeared to reduce VEPs to a greater extent; K-means showed an intermediate outcome, both in artifact reduction and EEG preservation.
Conclusion
PA variability across heartbeats has an important impact on EEG quality, and it is linked not only to changes in head position/orientation, but also, and more importantly, to respiration and heart rate. These novel insights have important consequences for PA correction, of high relevance to most EEG-fMRI applications.Acknowledgements
This work was supported by Centre d'Imagerie BioMédicale (CIBM) of the UNIL, UNIGE, HUG, CHUV, EPFL and the Leenaards and Jeantet Foundations.References
(1) Allen, P.J., Polizzi, G., Krakow, K., Fish, D.R., Lemieux, L., 1998. Identification of EEG events in the MR scanner: the problem of pulse artifact and a method for its subtraction. Neuroimage 8, 229-239.
(2) Debener, S., Strobel, A., Sorger, B., Peters, J., Kranczioch, C., Engel, A.K., Goebel, R., 2007. Improved quality of auditory event-related potentials recorded simultaneously with 3-T fMRI: removal of the ballistocardiogram artefact. Neuroimage 34, 587-597.
(3) Grouiller, F., Vercueil, L., Krainik, A., Segebarth, C., Kahane, P., David, O., 2007. A comparative study of different artefact removal algorithms for EEG signals acquired during functional MRI. Neuroimage 38, 124-137.
(4) Mullinger, K.J., Havenhand, J., Bowtell, R., 2013. Identifying the sources of the pulse artefact in EEG recordings made inside an MR scanner. Neuroimage 71, 75-83.
(5) Jorge, J., Grouiller, F., Ipek, O., Stoermer, R., Michel, C.M., Figueiredo, P., van der Zwaag, W., Gruetter, R., 2015b. Simultaneous EEG-fMRI at ultra-high field: artifact prevention and safety assessment. Neuroimage 105, 132-144.
(6) Jorge, J., Grouiller, F., Gruetter, R., van der Zwaag, W., Figueiredo, P., 2015a. Towards high-quality simultaneous EEG-fMRI at 7 T: Detection and reduction of EEG artifacts due to head motion. Neuroimage 120, 143-153.
(7) de Munck, J.C., van Houdt, P.J., Goncalves, S.I., van Wegen, E., Ossenblok, P.P., 2013. Novel artefact removal algorithms for co-registered EEG/fMRI based on selective averaging and subtraction. Neuroimage 64, 407-415.
Figures