3741
Correspondence between structure and function in the human brain using data from over 15,000 individuals1Brainnetome Center and National Laboratory of Pattern Recognition, Institute of Automation, Chinese Academy of Sciences, Beijing, China, 2University of Chinese Academy of Sciences, Beijing, China, 3The Mind Research Network, Albuquerque, NM, United States, 4Department of Psychology, Neuroscience Institute, Georgia State University, Atlanta, GA, United States, 5Department of Electrical and Computer Engineering, the University of New Mexico, Albuquerque, NM, United States, 6Department of Psychiatry, Yale University, School of Medicine, New Haven, CT, United States
Synopsis
This study compared the structural-functional correspondence on a large discovery dataset (7104 functional scans, 6005 structural scans) and a replication dataset (9214 subjects). Independent component analysis was applied to identify structural and functional networks. Spatial correlation was then computed using Pearson correlation and mutual information. Results indicated that 1) 24 replicated pairs were identified showing high structural-functional correspondence; 2) the structural-functional correspondence showed the following hierarchy: Basal ganglia > Somatomotor, Visual > DMN, Temporal, Cerebellum > Frontal and Parietal domains; 3) replicated results allowing us to provide evidence of a stable template of structural-functional correspondence for the public to use.
INTRODUCTION
Identifying the relationship between structure and function of large-scale brain systems is an important and challenging question in systems neuroscience. A newly emerged paradigm about structural-functional relationship has suggested that cognition results from the dynamic interactions of distributed brain areas that operate in large-scale networks1. By mapping the structural and functional networks of the human brain, we hope to deepen our understanding of how functional brain activity emerges from anatomical structure.METHODS
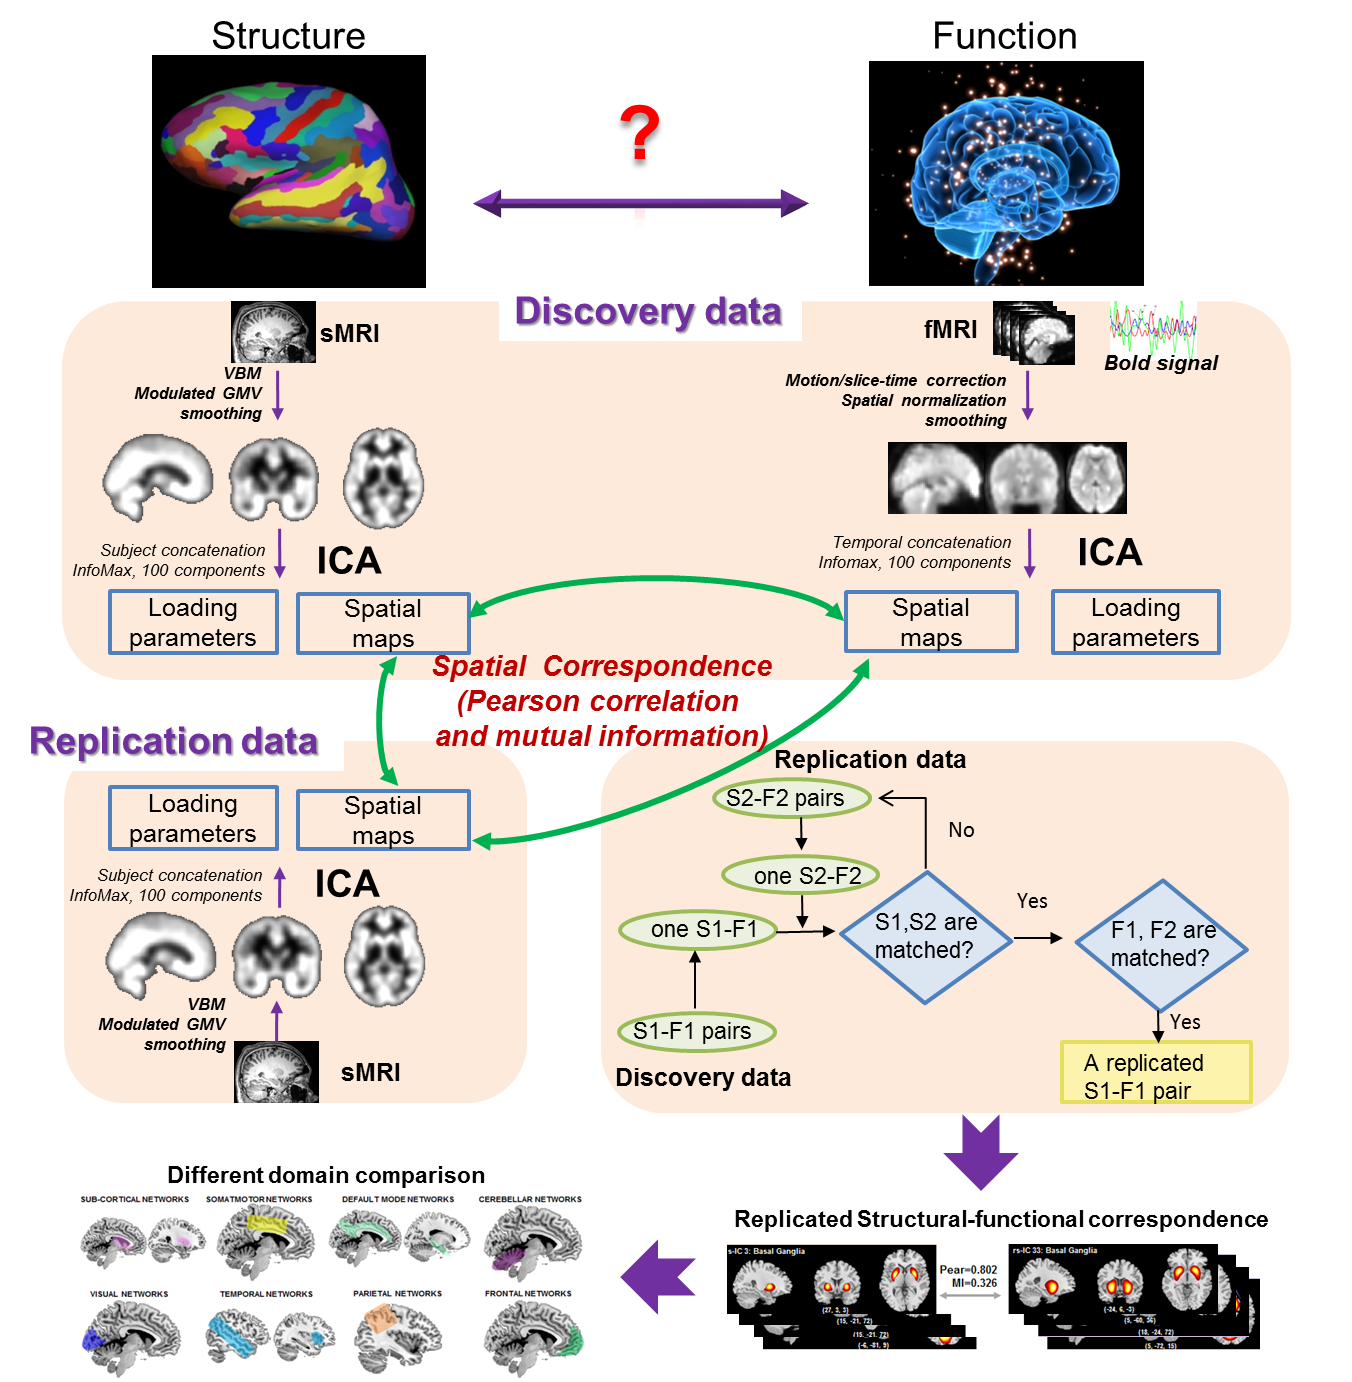
A discovery dataset consisting of 7104 functional scans and 6005 structural scans was collected at the University of New Mexico and the University of Colorado Boulder. Independent component analysis (ICA) was applied to identify functional networks from resting-state fMRI as previous studies2, 3. These networks appear to provide robust measures of the intrinsic functional activity of brain3, 4, which provides a framework for studying the functional architecture of human connectome5. Structural networks of human brain can be measured via ICA decomposition of gray matter (GM) volume6, which provide information about covarying GM changes7. Based on the spatial maps identified from ICA, we further compared the correspondence between structural and functional components using Pearson correlation and mutual information. Finally, a replication dataset from UK biobank, consisting of 9214 subjects, was used to validate the identified structural-functional pairs. We again applied ICA to decompose the structural replication data and measured the spatial correspondence between structural components in the discovery dataset and structural components in the replication dataset. If one matched structural-structural pair presented a high correspondence with the same functional component, then the structural-functional pair in the discovery dataset was regarded as replicated (Fig.1).RESULTS
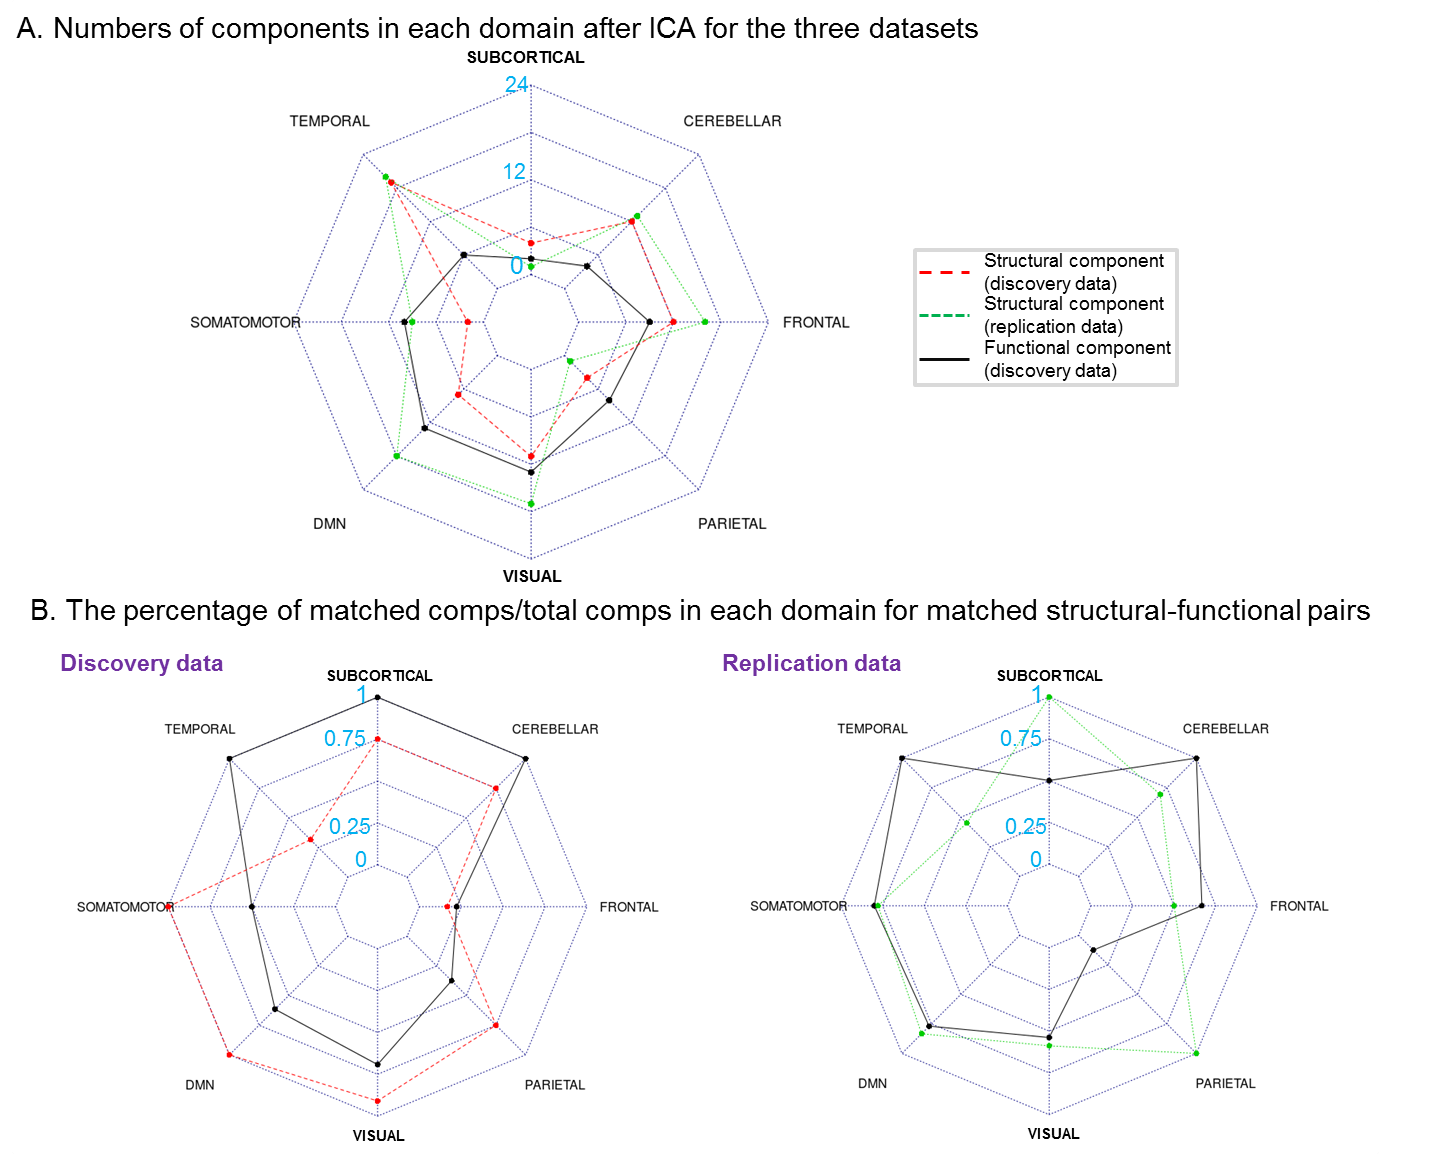
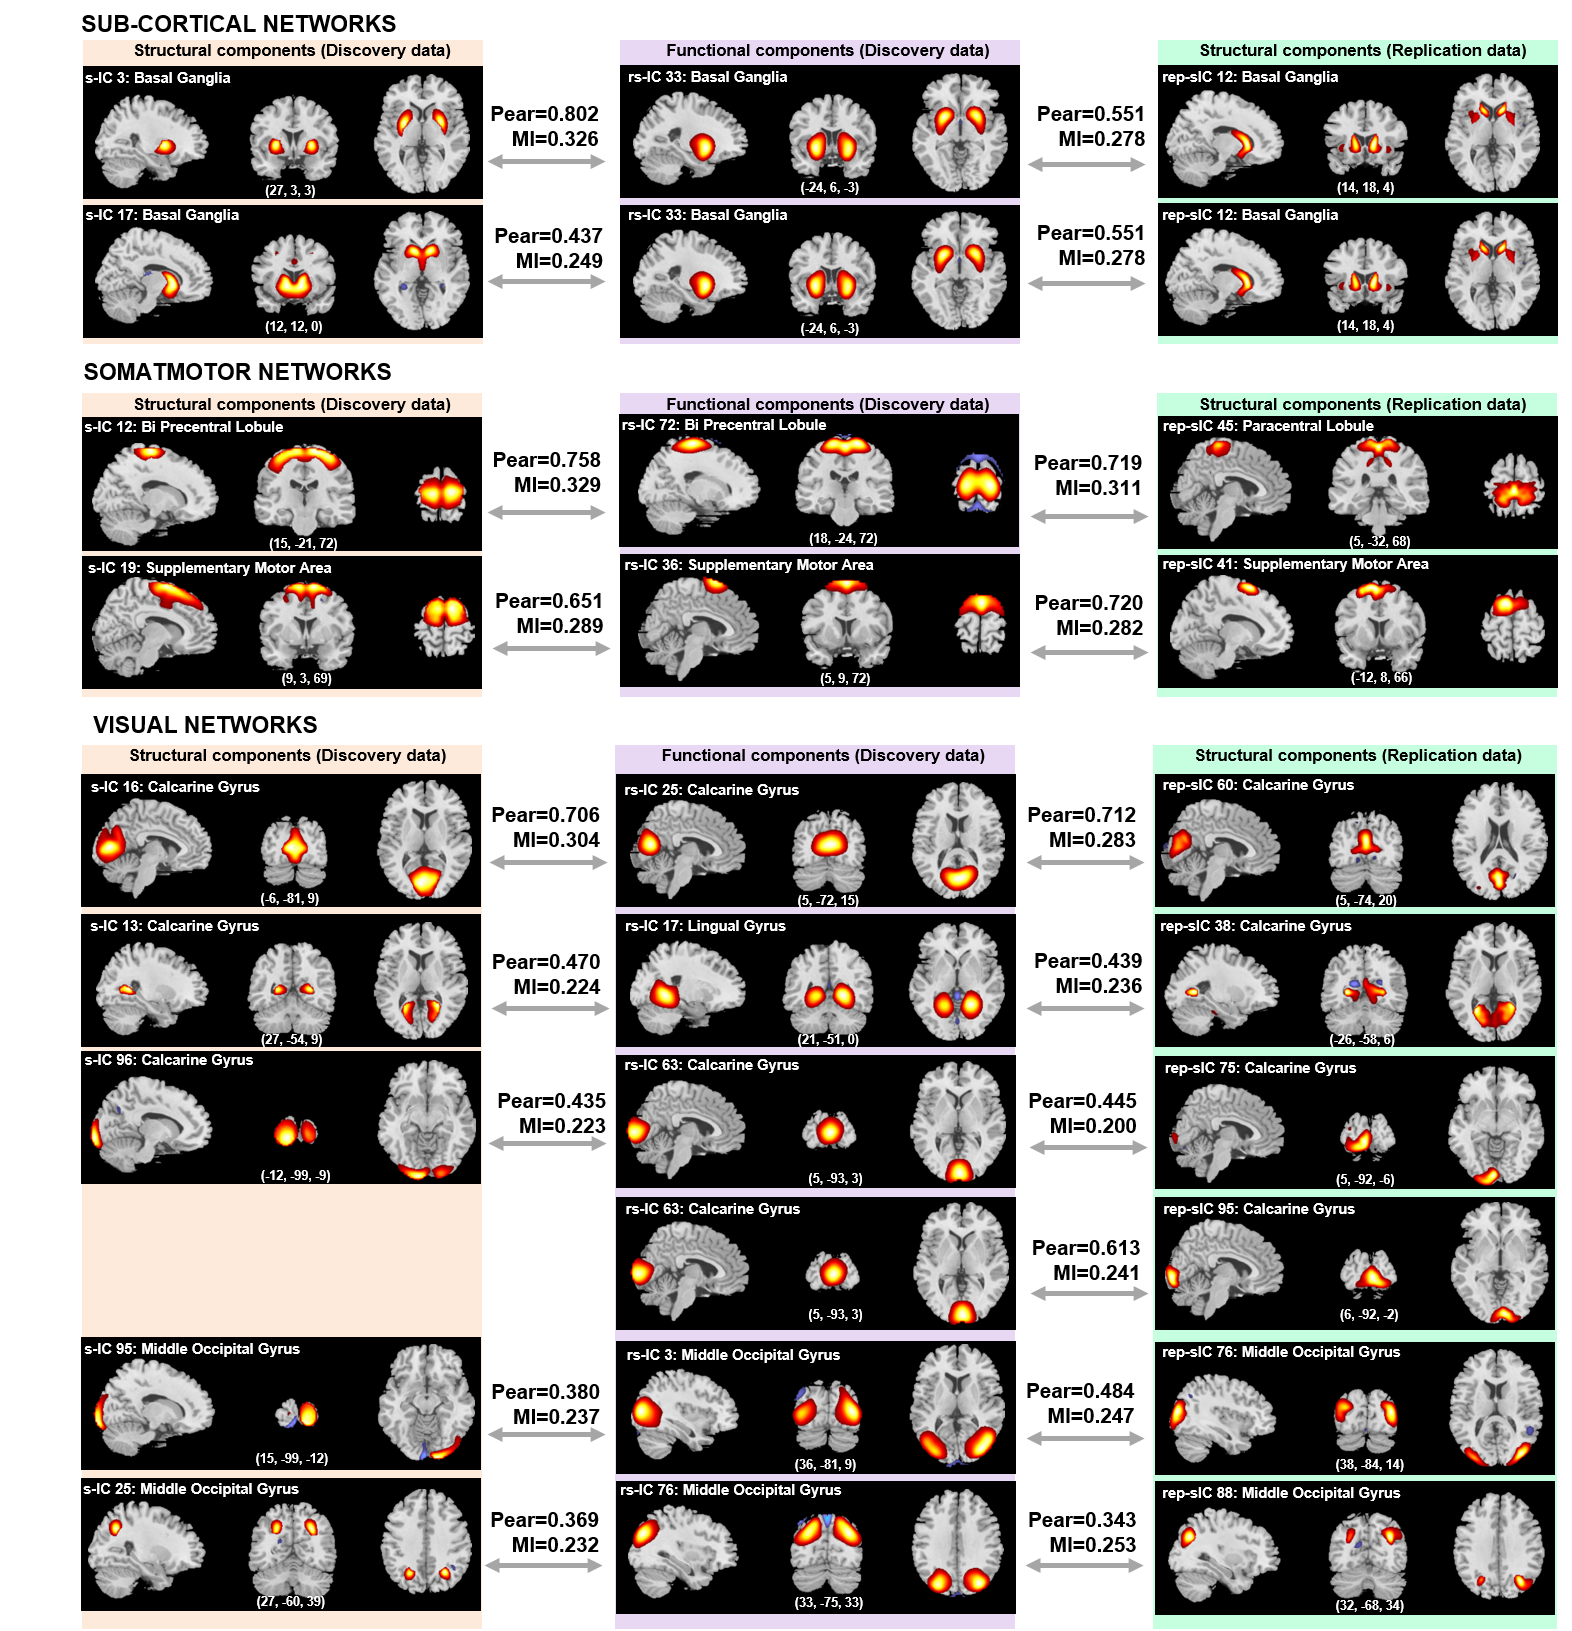
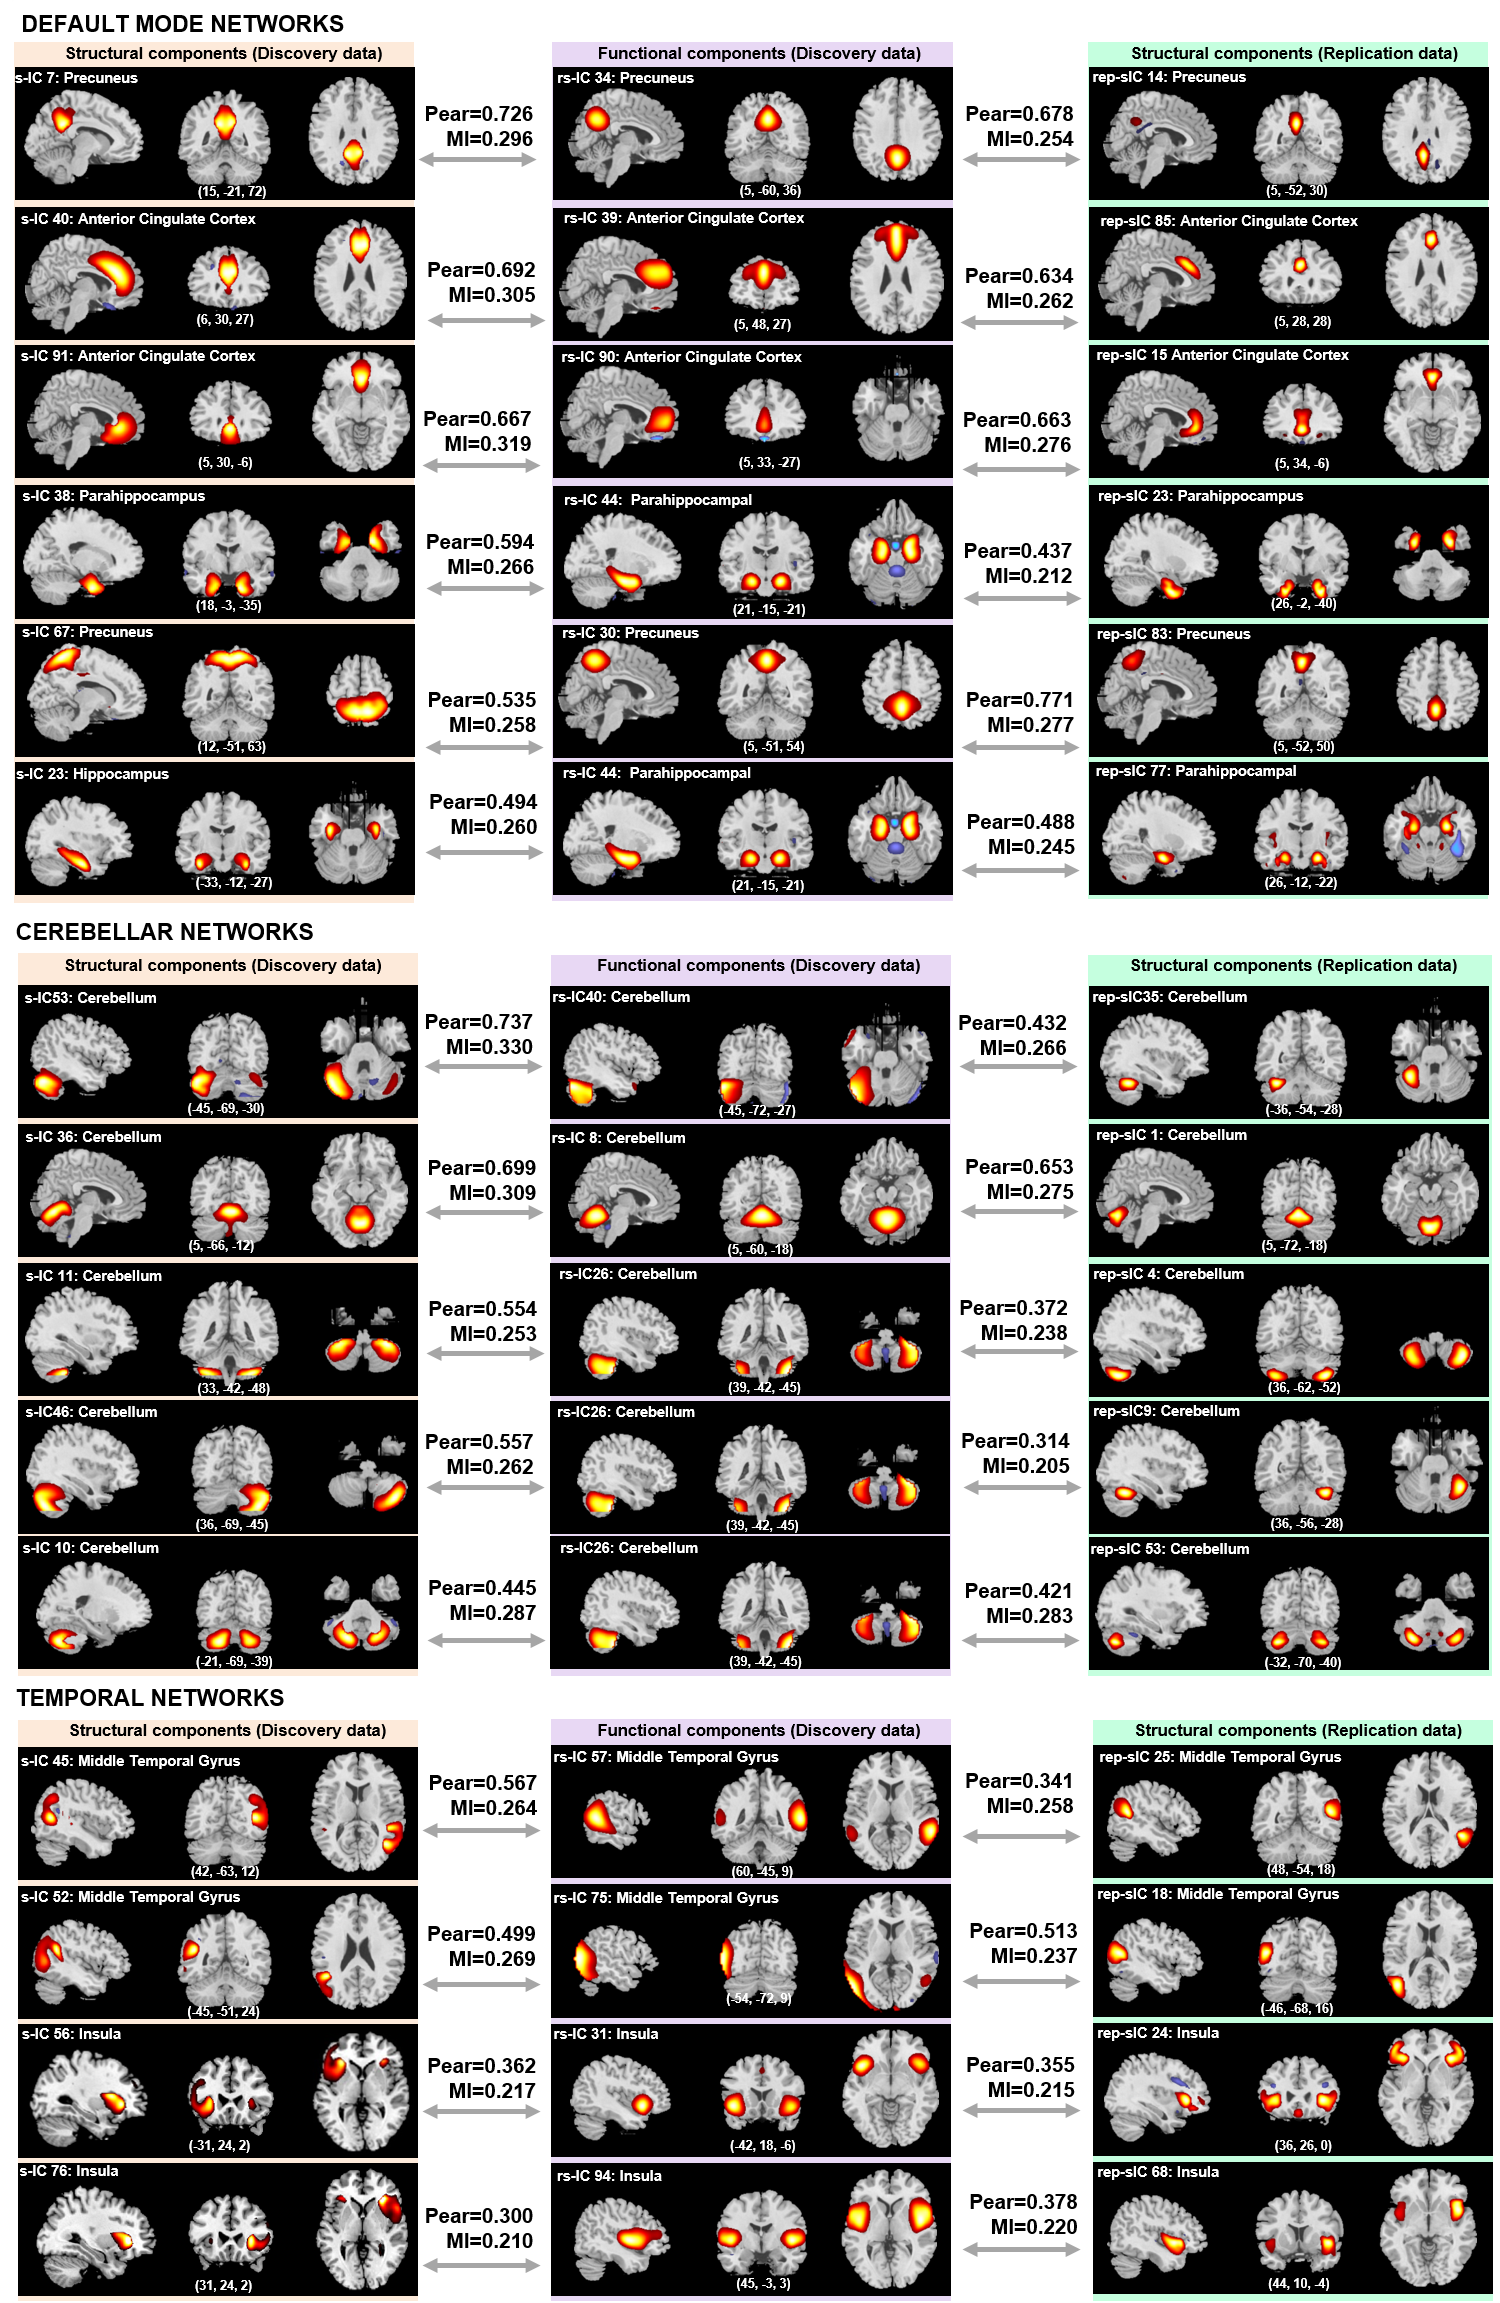
In the discovery dataset, of the 100 structural components, 71 met the inclusion criteria; for functional components, 61 were selected for analysis. In the replication dataset, of the 100 structural components, 95 met the inclusion criteria. After sorting them into eight domains, GM data are more likely to be decomposed into temporal, visual, frontal and cerebellar domains in both discovery and replication data, while fMRI data are more likely to be decomposed into somatomotor, default mode network (DMN) and visual domains (Fig.2A). Out of the 71 by 61 structural and functional component comparisons in the discovery dataset, 42 (59.15%) structural components were matched with 39 (63.93%) functional components passing the predetermined correlation coefficient threshold of > 0.25 and mutual information threshold of MI > 0.2. The DMN, visual and cerebellar domains present a high percentage of matched components/total components in both structural and functional components, as well as discovery data and replication data (Fig.2B). Moreover, 24 (57.14%) of these 42 structural-functional pairs were replicated in the UK biobank dataset. Specifically, component from basal ganglia domain exhibited the greatest correlation between structural and functional components, followed by components from somatomotor domain and visual domain (Fig.3). The DMN, temporal and cerebellum domains demonstrated a moderate level of structural-functional correspondence (Fig.4). While the structural-functional correspondence in brain regions with higher cognitive functions, like parietal and frontal domain, was not well replicated.DISCUSSION
The basal ganglia component s-IC3 comprised of putamen and parts of caudate exhibits the highest correlation between structure and function, which indicates how different the GM is in these areas compared with other regions in the brain. The putamen and caudate nucleus together form the dorsal striatum, which contain the same types of neurons and circuits – many neuroanatomists consider the dorsal striatum to be a single structure. The components from somatomotor and visual domain separately presented the second and third highest structural-functional correspondence, whereas correspondence in frontal and parietal domains are not replicated. Previous studies on individual difference of functional variability have revealed the least variability on the somatomotor and visual regions, but highest variability on frontal and parietal domains across individuals8, 9. Thus regions like somatomotor and visual domains are highly similar across subjects and more likely to show up in a group decomposition. And different cortical surface expansion during human evolution may lead to the different correspondences among brain regions9.CONCLUSION
Overall, by exploring how GM corresponds to function using spatial maps from ICA, we extend previous reports on structural-functional relationship in showing that 1) 24 replicated pairs were identified showing high correspondence between structure and function, residing in subcortical, somatomotor, DMN, visual, cerebellum and temporal networks; 2) correspondence between structure and function of the brain show the following hierarchy: Basal ganglia > Somatomotor, Visual > DMN, Temporal, Cerebellum > Frontal and Parietal domains; 3) replicated results allowing us to provide evidence of a stable template of structural-functional correspondence for the public to use.Acknowledgements
This work was supported by the National Institutes of Health (NIH) via grant numbers 2R01EB005846, P20GM103472, and R01REB020407, the National Science Foundation (NSF) grant 1539067, the Natural Science Foundation of China (No. 81471367, 61773380) and the Strategic Priority Research Program of the Chinese Academy of Sciences (No. XDBS01040100).References
1. Bressler SL, Menon V. Large-scale brain networks in cognition: emerging methods and principles. Trends Cogn Sci Jun 2010;14(6):277-290.
2. Allen EA, Damaraju E, Plis SM, Erhardt EB, Eichele T, Calhoun VD. Tracking whole-brain connectivity dynamics in the resting state. Cereb Cortex Mar 2014;24(3):663-676.
3. Abrol A, Damaraju E, Miller RL, Stephen JM, Claus ED, Mayer AR, Calhoun VD. Replicability of time-varying connectivity patterns in large resting state fMRI samples. Neuroimage Dec 2017;163:160-176.
4. Calhoun VD, Kiehl KA, Pearlson GD. Modulation of temporally coherent brain networks estimated using ICA at rest and during cognitive tasks. Hum Brain Mapp Jul 2008;29(7):828-838.
5. Sporns O, Tononi G, Kotter R. The human connectome: A structural description of the human brain. PLoS computational biology Sep 2005;1(4):e42.
6. Sporns O. The human connectome: a complex network. Annals of the New York Academy of Sciences Apr 2011;1224:109-125.
7. Xu L, Groth KM, Pearlson G, Schretlen DJ, Calhoun VD. Source-Based Morphometry: The Use of Independent Component Analysis to Identify Gray Matter Differences With Application to Schizophrenia. Hum Brain Mapp Mar 2009;30(3):711-724.
8. Mueller S, Wang D, Fox MD, et al. Individual variability in functional connectivity architecture of the human brain. Neuron Feb 6 2013;77(3):586-595.
9. Wang D LH. Functional connectivity architecture of the human brain: not all the same. Neuroscientist 2014;20(5):432-438.
Figures