3740
Detection of oscillatory event-related visual potentials and BOLD signals using interleaved simultaneous multi-slice inverse imaging and electroencephalography1Institute of Biomedical Engineering, National Taiwan University, Taipei, Taiwan, 2Department of medical imaging, Taipei Medical University – Shuang Ho Hospital, New Taipei City, Taiwan, 3Institute of Neuroscience, National Yang-Ming University, Taipei, Taiwan, 4Department of Neuroscience and Biomedical Engineering, Aalto University, Espoo, Finland, 5Department of Medical Biophysics, University of Toronto, Toronto, ON, Canada
Synopsis
We propose to interleave simultaneous multi-slice inverse imaging (SMS-InI) concurrently with EEG. In this way, EEG recorded with gradient-artifact-free intervals (1.9
Introduction
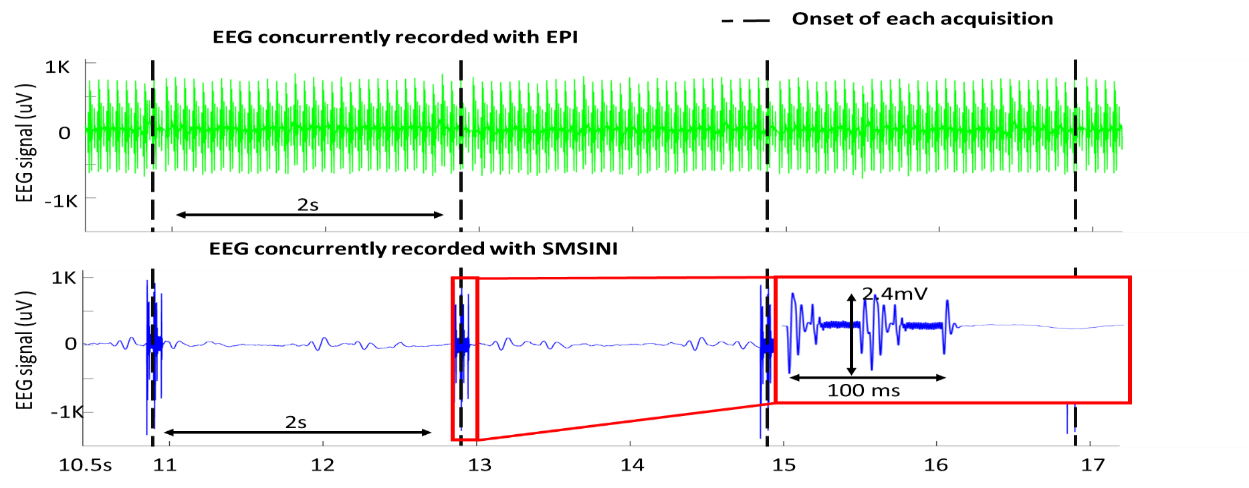
Electroencephalography (EEG) and functional magnetic resonance imaging (fMRI) can be combined to provide millisecond resolution and millimeter resolution of neuronal and hemodynamic activity 1-8. This concurrently recorded EEG-fMRI is preferable to avoid memory or learning biases9. However, when concurrently recorded with fMRI, EEG is distorted by pulse artifacts (PA10-12) and gradient artifacts (GA 10,13,14) caused by heartbeats in a strong magnetic field and repetitive gradient coil switching during MRI acquisition, respectively. Specifically, multi-slice echo-planar imaging (EPI15,16) caused strong GA on EEG at the frequency of EPI slices. While signal processing strategies have providing10,13,14,17,18, GA cannot completely removed17, potentially because motion causes non-repetitive GA patterns. Incompletely removed GA compromises subsequent PA suppression and reduces EEG quality eventually. To address this challenge, we propose to interleave simultaneous multi-slice inverse imaging (SMS-InI19) concurrently with EEG. In this way, EEG recorded during the GA-free interval (1.9 s in 2-s) is expected to have high quality, while SMS-InI provides comparable sensitivity and spatiotemporal resolution like EPI. We used SMS-InI-EEG to measure 15-Hz steady-state visual evoked potentials (SSVEP20-22) and its hemodynamic responses. Results were compared with EPI-EEG measurements.Method
Nine healthy participants were recruited to this study (5 males) with written informed consents approved by the Institutional Review Board in National Taiwan University Hospital. Checker board patterns flashing at 7.5 Hz were shown to participants randomly for 1 s with a minimal inter-stimulus interval of 2 s to elicit 15-Hz SSVEP. We had three EEG-fMRI protocols: EPI-EEG, interleaved SMS-InI -EEG, and EEG recorded in the MR scanner (EEG-only). EEG was measured by an MR-compatible system with a 32-channel EEG cap (BrainAmp MR Plus, Brain Products). Electrodes were placed on scalp following the 10-20 standard. EEG was monopolarly referenced with the electrode FCz and took AFz as ground. The EEG was sampled at 5 kHz and synchronized with the onset of each MR acquisition volume17,23. SMS-InI and EPI both had 3.5-mm isotropic resolution, whole-head coverage, and TR = 2s. SMS-InI-EEG had a 1.9-s interval within 2 s TR for GA-free EEG (Figure 1). Totally 150 trials of visual stimulation were presented to participants in each protocol. GA and PA were suppressed by published methods using artifact template estimation and subtraction13,17. Maps of SSVEP in the brain were estimated by the minimum-norm estimate using realistic head models19. The spatial distribution of BOLD signal in response to visual stimulation was estimated by General Linear Model (GLM24) using EPI and SMS-InI data separately.Results
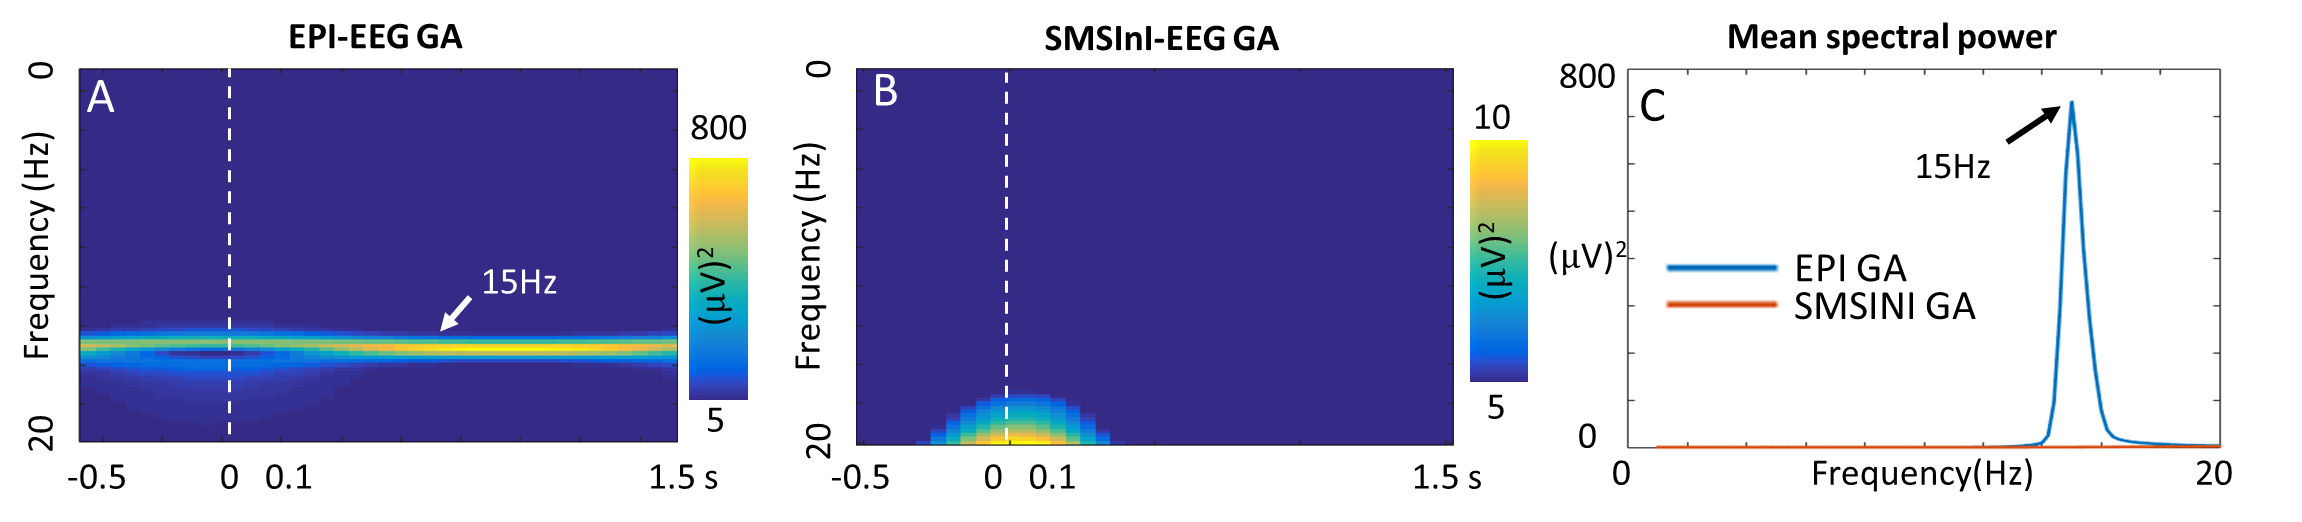
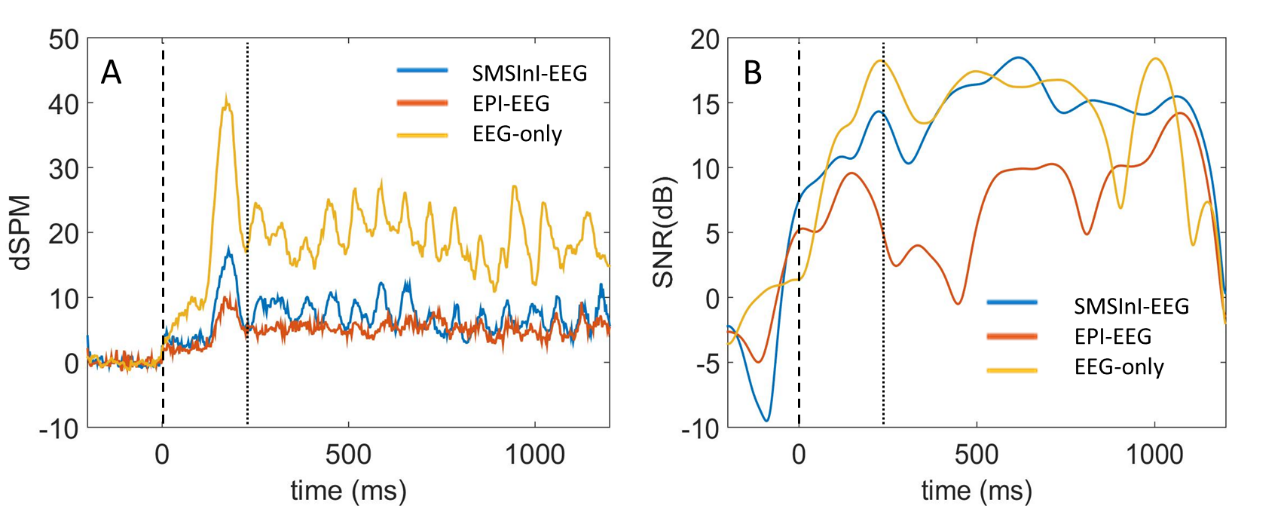
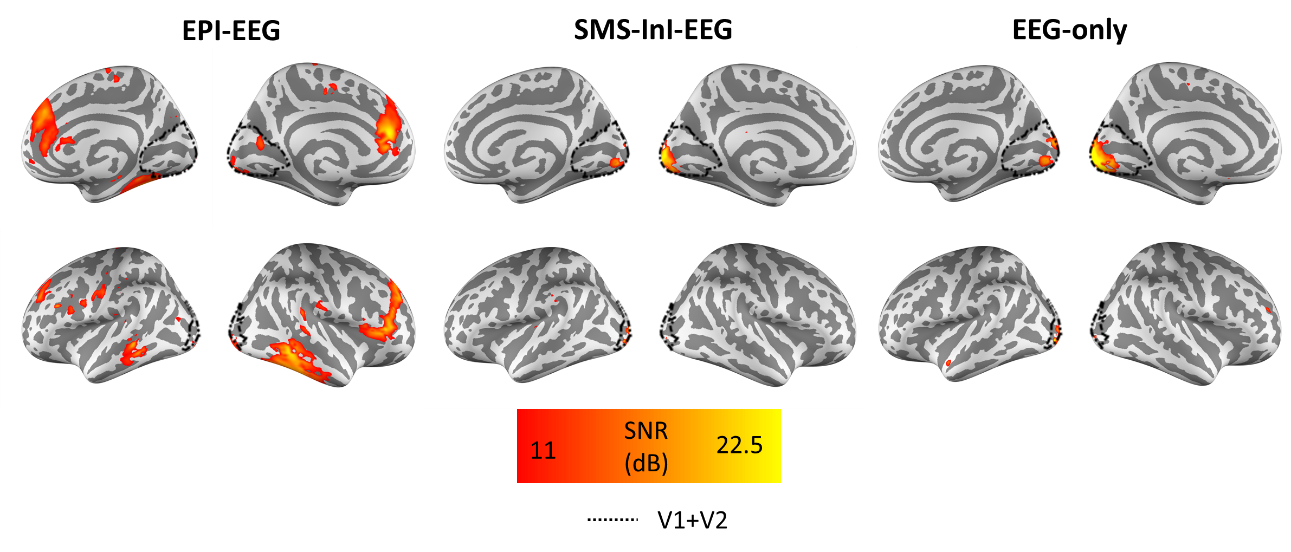
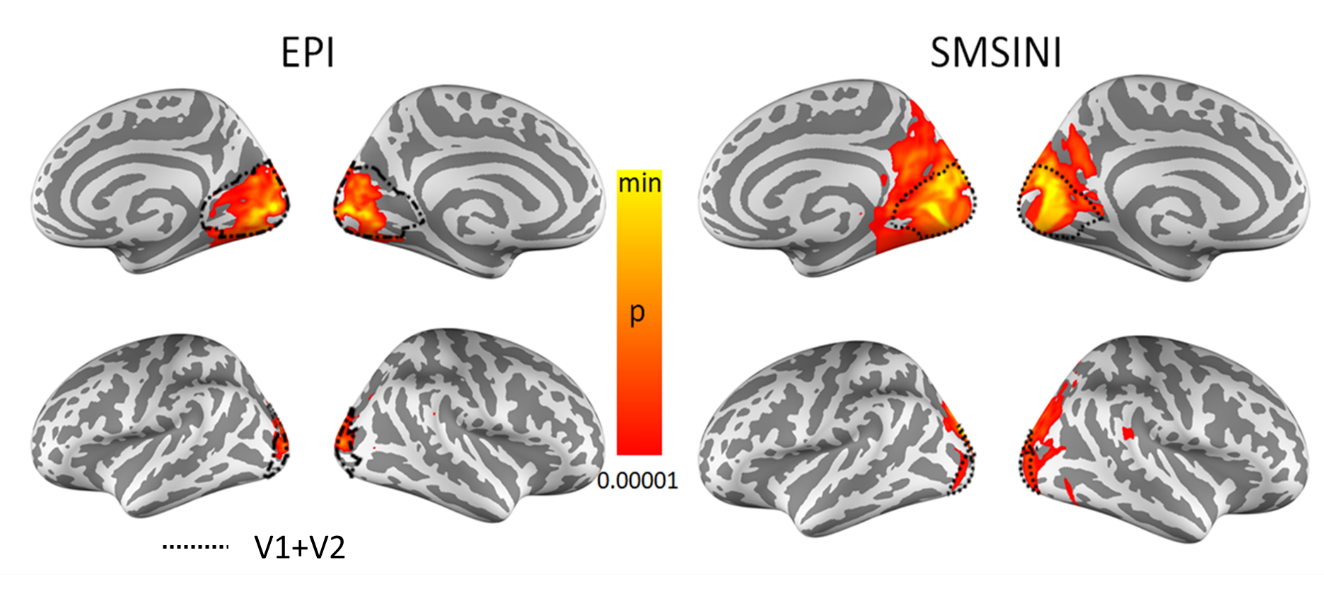
The GA continuously deteriorated EEG at 15 Hz in EPI-EEG over the 2-s interval. On the contrary, strong GA at 15 Hz in the first 200 ms in SMS-InI-EEG. The GA spectra between 200 ms and 1900 ms were significantly smaller in SMS-InI-EEG than in EPI-EEG (Figure 2). At the visual cortex, we observed clear 15-Hz SSVEPs between 250 ms and 1200 ms in EEG-only and SMS-InI-EEG but less clearly in EPI-EEG (Figure 3). The average 15-Hz SNR of SMS-InI-EEG and EPI-EEG was 15.0 dB and 7.7 dB, respectively. In comparison, the 15-Hz SNR of EEG-only was 15.2 dB. The 15-Hz SNR was selectively localized at the visual cortex for both EEG-only and SMS-InI-EEG, but much lower in EPI-EEG (Figure 4). EPI-EEG also had high 15-Hz SNR at the frontal lobe. Both EPI-EEG and SMS-InI-EEG estimated similar visual cortex hemodynamic responses (Figure 5).Discussion
SMS-InI-EEG was demonstrated to improve the EEG SNR at the frequency of strong GA in EPI-EEG (Figures 2-4) while providing similar fMRI to that measured by EPI-EEG (Figure 5). In this study, the frequency of SSVEP was selected to overlap with the frequency of GA in EPI-EEG in order to demonstrate the advantage of SMS-InI-EEG. While adjusting the number of EPI slices and spatiotemporal resolution of EPI can potentially avoid the deterioration of EEG at particular frequencies, interleaving SMS-InI with a long MRI-silent interval is a convenient way to simultaneously acquire higher quality EEG and comparable quality fMRI in comparison to EPI-EEG. Note that both SMS-InI-EEG and EPI-EEG still face serious PA challenges, as demonstrated by the significantly lower SNR in the SSVEP in SMS-InI-EEG and EPI-EEG than in EEG-only measurements (Figure 3). The interleaved SMS-InI-EEG can be applied to measurements sensitive to EEG quality, such as localizing irritative zones of inter-ictal discharges (IID) in epilepsy patients using fMRI based on IID timing.Acknowledgements
This work was partially supported by Ministry of Science and Technology, Taiwan (103-2628-B-002-002-MY3, 105-2221-E-002- 104), the National Health Research Institutes, Taiwan (NHRI-EX107-10727EI), and the Academy of Finland (No. 298131).References
1 Philiastides M. G. & Sajda P. EEG-informed fMRI reveals spatiotemporal characteristics of perceptual decision making. Journal of Neuroscience.2007; 27:13082-13091.
2 Laufs H., Kleinschmidt A., Beyerle A. et al. EEG-correlated fMRI of human alpha activity. Neuroimage.2003; 19:1463-1476.
3 Babiloni F., Carducci F., Del Gratta C. et al. in Engineering in Medicine and Biology Society, 1998. Proceedings of the 20th Annual International Conference of the IEEE. 2135-2138 (IEEE).
4 Babiloni F., Carducci F., Cincotti F. et al. Integration of high resolution EEG and functional magnetic resonance in the study of human movement-related potentials. Methods Archive.2000; 39:179-182.
5 Ou W., Nummenmaa A., Ahveninen J. et al. Multimodal functional imaging using fMRI-informed regional EEG/MEG source estimation. Neuroimage.2010; 52:97-108.
6 Valdes‐Sosa P. A., Sanchez‐Bornot J. M., Sotero R. C. et al. Model driven EEG/fMRI fusion of brain oscillations. Human brain mapping.2009; 30:2701-2721.
7 Rosa M., Daunizeau J. & Friston K. EEG-fMRI integration: a critical review of biophysical modeling and data analysis approaches. Journal of integrative neuroscience.2010; 9:453-476.
8 Riera J. J. & Sumiyoshi A. Brain oscillations: ideal scenery to understand the neurovascular coupling. Current opinion in neurology.2010; 23:374-381.
9 Lantz G., De Peralta R. G., Spinelli L. et al. Epileptic source localization with high density EEG: how many electrodes are needed? Clinical neurophysiology.2003; 114:63-69.
10 Mulert C. & Lemieux L. EEG - fMRI: Physiological Basis, Technique, and Applications. (Springer Berlin Heidelberg, 2009).
11 Huster R. J., Debener S., Eichele T. et al. Methods for simultaneous EEG-fMRI: an introductory review. The Journal of neuroscience.2012; 32:6053-6060.
12 Allen P. J., Polizzi G., Krakow K. et al. Identification of EEG events in the MR scanner: the problem of pulse artifact and a method for its subtraction. Neuroimage.1998; 8:229-239.
13 Allen P. J., Josephs O. & Turner R. A method for removing imaging artifact from continuous EEG recorded during functional MRI. Neuroimage.2000; 12:230-239.
14 Wan X., Iwata K., Riera J. et al. Artifact reduction for simultaneous EEG/fMRI recording: Adaptive FIR reduction of imaging artifacts. Clinical Neurophysiology.2006; 117:681-692.
15 Ordidge R., Mansfield P. & Coupland R. Rapid biomedical imaging by NMR. The British journal of radiology.1981; 54:850-855.
16 Ordidge R., Mansfield P., Doyle M. et al. Real time movie images by NMR. The British journal of radiology.1982; 55:729-733.
17 Niazy R. K., Beckmann C. F., Iannetti G. D. et al. Removal of FMRI environment artifacts from EEG data using optimal basis sets. NeuroImage.2005; 28:720-737.
18 Maziero D., Velasco T. R., Hunt N. et al. Towards motion insensitive EEG-fMRI: Correcting motion-induced voltages and gradient artefact instability in EEG using an fMRI prospective motion correction (PMC) system. NeuroImage.2016; 138:13-27.
19 Lin F. H., Wald L. L., Ahlfors S. P. et al. Dynamic magnetic resonance inverse imaging of human brain function. Magnetic resonance in medicine.2006; 56:787-802.
20 Norcia A. M., Appelbaum L. G., Ales J. M. et al. The steady-state visual evoked potential in vision research: a review. Journal of vision.2015; 15:4-4.
21 Herrmann C. S. Human EEG responses to 1–100 Hz flicker: resonance phenomena in visual cortex and their potential correlation to cognitive phenomena. Experimental brain research.2001; 137:346-353.
22 Bayram A., Bayraktaroglu Z., Karahan E. et al. Simultaneous EEG/fMRI Analysis of the Resonance Phenomena in Steady-State Visual Evoked Responses. Clinical EEG and Neuroscience.2011; 42:98-106.
23 Mullinger K. J., Castellone P. & Bowtell R. Best current practice for obtaining high quality EEG data during simultaneous fMRI. Journal of visualized experiments: JoVE.2013;
24 Beckmann C. F., Jenkinson M. & Smith S. M. General multilevel linear modeling for group analysis in FMRI. Neuroimage.2003; 20:1052-1063.
Figures