3739
Connectivity in the Default Mode Network of Schizophrenic Patients Investigated with Microstates and mGluR5 Receptor Availability Using Simultaneously Recorded Trimodal ([11C]ABP688-PET/MR/EEG) Imaging1Institute of Neuroscience and Medicine 4, INM-4, Forschungszentrum Jülich, Jülich, Germany, 2Department of Psychiatry, Psychotherapy and Psychosomatics, RWTH Aachen University, Aachen, Germany, 3JARA - BRAIN - Translational Medicine, Jülich, Aachen, Germany, 4Department of Electrical and Computer Engineering, McMaster University, Hamilton, ON, Canada, 5Institute of Neuroscience and Medicine 2, INM-2, Forschungszentrum Jülich, Jülich, Germany, 6Institute of Neuroscience and Medicine 5, INM-5, Forschungszentrum Jülich, Jülich, Germany, 7Department of Nuclear Medicine, RWTH Aachen University, Aachen, Germany, 8Institute of Neuroscience and Medicine 11, INM-11, Forschungszentrum Jülich, Jülich, Germany, 9Department of Neurology, RWTH Aachen University, Aachen, Germany
Synopsis
This exploratory study aims at underpinning the relationship between functional connectivity (fMRI), microstates (EEG) and glutamatergic receptor (mGluR5) availability ([11C]ABP688-PET) in healthy controls (HC) and schizophrenic (SZ) patients using simultaneously acquired trimodal (PET/MR/EEG) data. The single modality results show hyperactivity in vDMN regions of SZ patients (fMRI), a significant decrease in volume of distribution (Vt) of SZ patients (non-smoker group), and increased microstate global field power (GFP) in SZ patients. Correlations between Vt and GFP did not reveal any significant results, but the trend suggests a strong influence of smoking status and its association with global reductions in mGluR5 availability.
Introduction
Schizophrenic (SZ) symptoms are mainly due to dysfunctional integration among neural systems1,2. Functional and anatomical3,4, electrophysiological5, and metabolic6,7 alterations are reported in SZ. Studying these processes on simultaneously recorded data may enhance the understanding of the causes of SZ. Given the advantages provided by simultaneous trimodal (PET/MR/EEG) measurements8,9, this exploratory study aims at underpinning the relationship between functional connectivity (fMRI), microstates (EEG) and glutamatergic receptor (mGluR5) availability ([11C]ABP688-PET) in healthy controls (HC) and SZ patients.Methods
Data Acquisition
Resting state (rs) (eyes closed, 6 minutes) fMRI, [11C]ABP688-PET and EEG data were recorded simultaneously from 16 male subjects (nSZ = nHC = 8, ageSZ = 36.5 ± 10.5, ageHC = 37.8 ± 11.2) in a 3T hybrid MR-PET system (Siemens, Germany) equipped with a 64 channel EEG recording system (Brainproducts, Germany). HC and SZ subjects were matched for age, gender, smoking status, education and ethnical background.
fMRI data
rs-fMRI images were acquired using a T2*-weighted EPI sequence (TR = 2.2 s, TE = 30 ms, FoV = 200×200 mm2, matrix size = 64×64, slice thickness = 3 mm, 36 slices, volumes = 160). Degree centrality (DC) was calculated using MATLAB based software packages, SPM12 and DPABI10, following the required pre-processing steps11. DC was computed with the Pearson correlation cut-off of 0.25 (p = 0.001). DC was linearly standardised into Z-values, co-registered to the MNI152 (2×2×2 mm3) standard space and smoothed with a Gaussian kernel size of 3 mm along all directions.
PET data
[11C]ABP688 was injected (521 ± 45 MBq) as bolus + infusion (B/I ratio = 60 minutes) while the subject was lying in the scanner. PET data acquisition (65 minutes) in list mode started simultaneously with the injection of the tracer. Data were iteratively reconstructed into 42 frames (30×10 s and 12×300 s time length), matrix size of 256×256 and 153 slices (voxel size = 1.25×1.25×1.25 mm3). Smoothing (3 mm Gaussian filter) and motion correction were performed. Volume of distribution (Vt) was calculated during the resting state frame (exactly corresponding to rs-fMRI acquisition) using metabolites corrected plasma. The Vt image was co-registered to the MNI152 (2×2×2 mm3) standard space.
EEG data
EEG data were processed using EEGLAB12. EEG data pre-processing included down-sampling (1000 Hz), corrections for gradient13, ballistocardiogram14 and eye movement15 artefacts, and, band-pass filtering (2 - 20 Hz). An independent component analysis based decomposition was performed16 and noisy components were removed17.
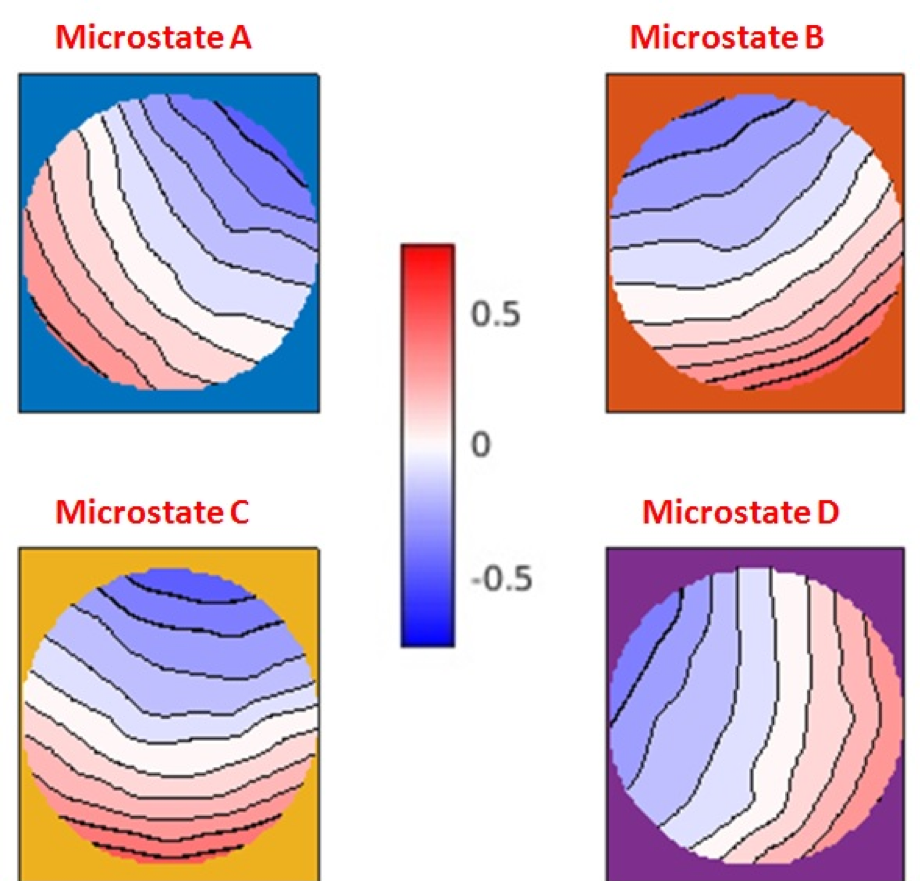
Microstates in the cleaned EEG data were computed using the Microstate plug-in in EEGLAB18. Topographical maps of global field power (GFP) peaks were extracted and spatial clustering was performed using a k-means algorithm. The dominant topographical maps across all subjects (group template) were identified and manually sorted into microstates A, B, C, and D18,19 (Fig. 1). Finally, the topographical maps identified for each subject were sorted into microstates A, B, C and D. The mean GFP for each microstate was calculated for all subjects.
Statistical Analysis
A mask of the ventral-DMN (vDMN) regions was obtained from an atlas20. The DC and Vt of voxels within the vDMN mask were extracted and their means were calculated. The Wilcoxon rank sum test was performed to analyse group differences. Spearman’s rank correlation test was performed between mean values of Vt and mean GFP of the microstates. Since PET studies with [11C]ABP688 are highly sensitive to smoking status21, further comparisons were performed considering the smoking status within HC and the SZ group. The family-wise error rate (FWER), due to multiple comparisons, was controlled via a permutation test22.
Results
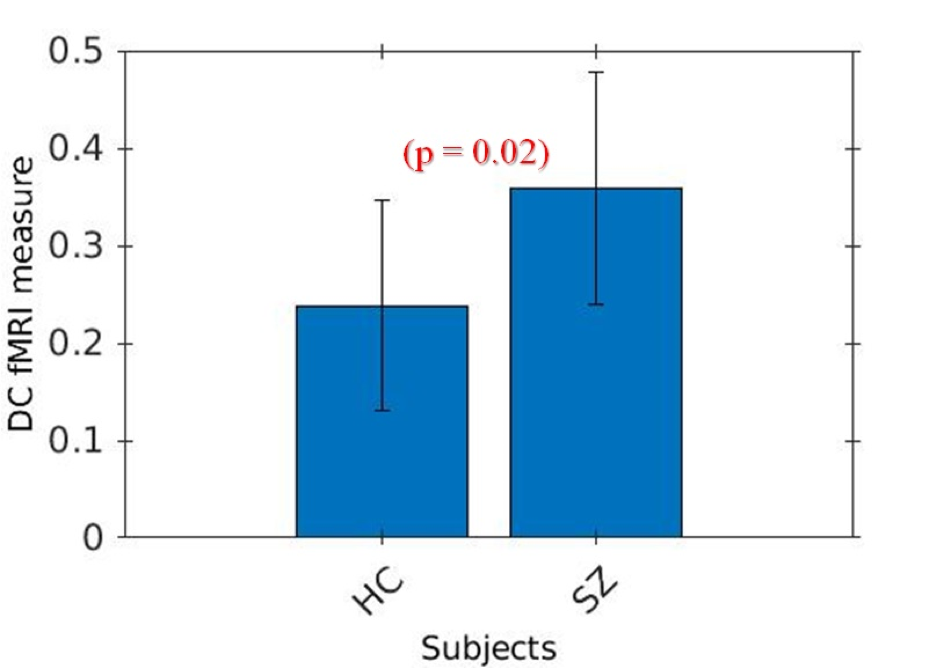
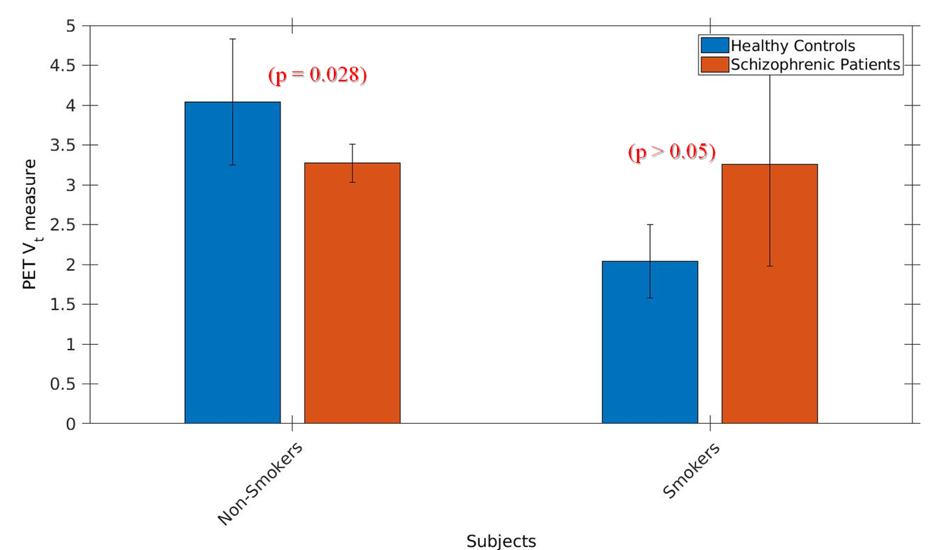
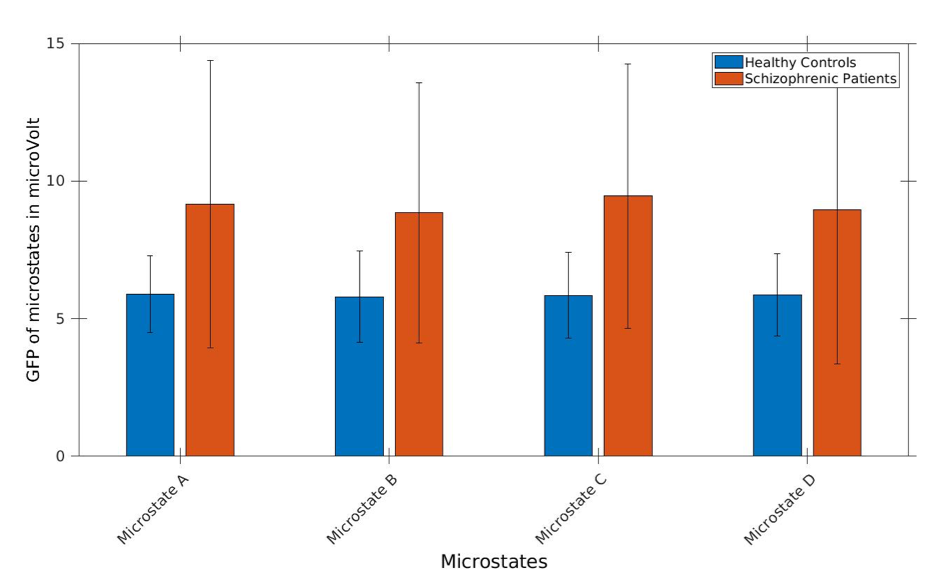
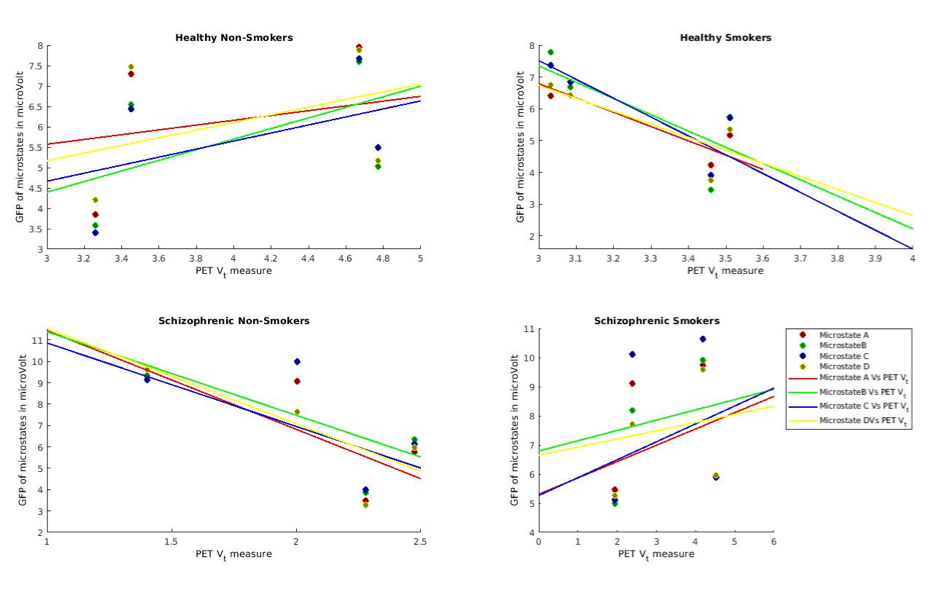
The DC showed a significant difference between HC and SZ group in the vDMN region (p = 0.02) (Fig. 2). Similarly the PET Vt measure shows a significant difference between HC and SZ in non-smokers (p = 0.02) (Fig. 3). The mean GFP of the microstates do not show any significant difference between the HC and SZ group (Fig. 4). Spearman’s rank correlation test between PET Vt and GFP do not show significant correlations (Fig. 5).Discussion and Conclusion
The DC results show hyperactivity in vDMN regions of SZ patients (Fig. 2). Similarly, a significant decrease in the Vt of SZ patients is observed in the non-smoker group (Fig. 3). These results are comparable with previous studies3,6. Correlations between Vt and GFP did not reveal any significant results (Fig. 5), but the trend suggests a strong influence of smoking status and its association with global reductions in mGluR5 availability. This exploratory study must be continued with a larger sample size to verify the mGluR5 availability changes, and to further investigate the relation between PET and EEG.Acknowledgements
We thank Andrea Muren, Magdalene Vögeling, Sylvia Köhler Dibowski, Silke Frensch, Suzanne Schaden and Cornelia Frey for their technical assistance. This study was in part supported by the EU FP7 funded project TRIMAGE (Nr. 602621).References
1. Van Den Heuvel, M. P. & Fornito, A. Brain networks in schizophrenia. Neuropsychology Review (2014). doi:10.1007/s11065-014-9248-7
2. Friston, K. J. K. J. Dysfunctional connectivity in schizophrenia. World Psychiatry (2002). doi:10.1016/j.neulet.2009.05.038
3. Camchong, J., MacDonald, A. W., Bell, C., Mueller, B. A. & Lim, K. O. Altered functional and anatomical connectivity in schizophrenia. Schizophrenia Bulletin (2011). doi:10.1093/schbul/sbp131
4. Whitfield-Gabrieli, S. & Ford, J. M. Default Mode Network Activity and Connectivity in Psychopathology. SSRN (2012). doi:10.1146/annurev-clinpsy-032511-143049
5. Rieger, K., Hernandez, L. D., Baenninger, A. & Koenig, T. 15 years of microstate research in schizophrenia - Where are we? A meta-analysis. Frontiers in Psychiatry (2016). doi:10.3389/fpsyt.2016.00022
6. Marsman, A. et al. Glutamate in schizophrenia: a focused review and meta-analysis of 1H-MRS studies. Schizophrenia bulletin 39, 120–129 (2011).
7. Poels, E. M. P. et al. Glutamatergic abnormalities in schizophrenia: a review of proton MRS findings. Schizophr Res 152, 325–332 (2014).
8. Shah, N. J. et al. Multimodal Fingerprints of Resting State Networks as assessed by Simultaneous Trimodal MR-PET-EEG Imaging. Sci Rep 7, 6452 (2017).
9. TRIMAGE: A dedicated trimodality (PET/MR/EEG) imaging tool for schizophrenia. European Psychiatry (2018). doi:https://doi.org/10.1016/j.eurpsy.2017.11.007
10. Yan, C. G., Wang, X. Di, Zuo, X. N. & Zang, Y. F. DPABI: Data Processing & Analysis for (Resting-State) Brain Imaging. Neuroinformatics 14, 339–351 (2016).
11. Zuo, X. N. et al. Network centrality in the human functional connectome. Cereb. Cortex. 22, 1862–1875 (2012).
12. Delorme, A. & Makeig, S. EEGLAB: An open source toolbox for analysis of single-trial EEG dynamics including independent component analysis. J. Neurosci. Methods 134, 9–21 (2004).
13. Niazy, R. K., Beckmann, C. F., Iannetti, G. D., Brady, J. M. & Smith, S. M. Removal of FMRI environment artifacts from EEG data using optimal basis sets. NeuroImage 28, 720–737 (2005).
14. Kim, K. H., Yoon, H. W. & Park, H. W. Improved ballistocardiac artifact removal from the electroencephalogram recorded in fMRI. J Neurosci Methods 135, 193–203 (2004).
15. Go’mez-Herrerol, G. et al. Automatic Removal of Ocular Artifacts in the EEG without an EOG Reference Channel. in NORSIG 2006, Reykjavik, Iceland 130–133 (2006).
16. Lee, T. W., Girolami, M. & Sejnowski, T. J. Independent component analysis using an extended infomax algorithm for mixed subgaussian and supergaussian sources. Neural computation 11, 417–441 (1999).
17. Pion-Tonachini, L., Makeig, S. & Kreutz-Delgado, K. Crowd labeling latent Dirichlet allocation. Knowledge and Information Systems (2017). doi:10.1007/s10115-017-1053-1
18. Koenig, T. et al. Millisecond by millisecond, year by year: Normative EEG microstates and developmental stages. NeuroImage 16, 41–48 (2002).
19. Khanna, A., Pascual-Leone, A., Michel, C. M. & Farzan, F. Microstates in resting-state EEG: Current status and future directions. Neurosci Biobehav Rev 49, 105–113 (2015).
20. Shirer, W. R., Ryali, S., Rykhlevskaia, E., Menon, V. & Greicius, M. D. Decoding subject-driven cognitive states with whole-brain connectivity patterns. Cereb Cortex 22, 158–165 (2012).
21. Akkus, F. et al. Marked Global Reduction in mGluR5 Binding in Smokers and Ex-smokers Determined by [11C] ABP688 Positron Emission Tomography. Proceedings of the National Academy of Sciences 110, 737–742 (2012).
22. Groppe, D. M., Urbach, T. P. & Kutas, M. Mass univariate analysis of event-related brain potentials/fields I: A critical tutorial review. Psychophysiology 48, 1711–1725 (2011).
Figures