3736
Quantitative functional imaging of visual cortex activity in humans using multi-parametric blood oxygenation level dependent MRI1Neuroradiology, Technische Universität München, Munich, Germany, 2TUM-NIC, Technische Universität München, Munich, Germany, 3Clinic for Neurology, Technische Universität München, Munich, Germany, 4MRRC, Yale University, New Haven, CT, United States
Synopsis
Blood oxygenation level dependent (BOLD) functional magnetic resonance imaging (fMRI) is widely used to assess local neuronal activity. However, the absolute metabolic demand related to BOLD-signal change is still largely unknown. In the current study we investigated the feasibility of multi-parametric quantitative BOLD (mq-BOLD) measurements to detect changes in tissue oxygenation in healthy, cortical gray matter during different states of visual stimulation. Our results show that mq-BOLD measurements are well feasible for standard activation paradigms. However, subject motion and transient states of brain activation might impact on quantitative parameter mapping due to longer acquisition times.
Introduction
BOLD-signal changes in fMRI are relative with respect to an unknown metabolic baseline, and scale non-linearly with energy metabolism.1,2 Thus, absolute metabolic demands, i.e. the cerebral metabolic rate of oxygen (CMRO2), across brain regions or task load are still largely unknown.
Established MRI-methods to assess absolute CMRO2 changes are based on gas-calibration,3,4 but gas-free approaches have gained traction in recent years due to their ease of application.5-9 Gas-free multi-parametric quantitative BOLD (mq-BOLD) imaging measures oxygenation by integrating susceptibility-related transverse relaxation rate R2’ and cerebral blood volume10,11. CMRO2 is obtained when adding cerebral blood flow (CBF).12 This method was successfully applied in patients,12-15 but its reliability to assess metabolic variability across cognitive states in healthy subjects is less clear.
In the current study, we tested the sensitivity of mq-BOLD for task-related
changes in tissue oxygenation in healthy, cortical gray matter during different
states of visual stimulation by performing quantitative multi-echo gradient
echo (multi-GE) and multi-echo spin echo (multi-SE) measurements of intrinsic,
effective and susceptibility-related transverse relaxation rates R2, R2* and
R2’. To assess plausibility of observed quantitative condition-related differences,
changes in effective transverse relaxation rate ΔR2*(BOLD-TC)
were also derived from BOLD-EPI time courses of a functional localizer
experiment (task-fMRI).
Methods:
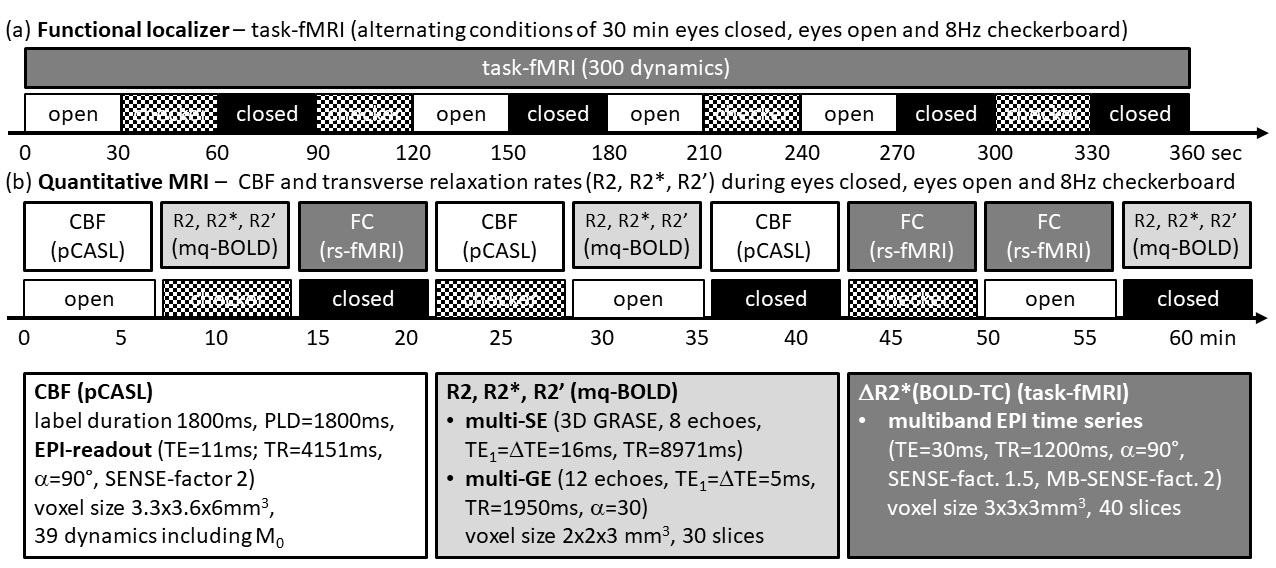
We performed whole-brain functional imaging of twelve healthy subjects (age 30.8±6.8y; five men) during randomized conditions of eyes closed (closed), eyes open (open), and during visual stimulation with flickering (8Hz) checkerboard (checker) using a 3T Elition MR scanner (Philips Healthcare, Best, Netherlands) and a 32-channel head-coil. We acquired T2-weighted multi-spin-echo (multi-SE), T2*-weighted multi-gradient-echo (multi-GE), and pseudo-continuous arterial spin labeling (pCASL) data averaged across prolonged condition blocks (avg.duration: 7min). Additionally, we acquired classical task-fMRI data (30sec block-design) employing T2*-weighted multiband-EPI and structural T1-weighted data (MPRAGE; voxel size 1x1x1mm3) (see Fig.1 for experimental details).
Data analysis used SPM1216 and in-house Matlab17 programs. We applied motion correction and spatial coregistration, omitting spatial normalization and smoothing of task data to reduce voxel blurring. Task-fMRI: We identified voxels with significant BOLD-signal changes from EPI-time series using a general linear model and created individual volumes-of-interest (VOIs) for each condition based on thresholded t-maps (t>10 for checker>open, and open>closed, respectively). To minimize influence of CSF partial volume and susceptibility artifacts, voxels were removed from VOIs using thresholds applied to T2 and R2’ maps (excluding thresholds: T2>100ms, R2’>10sec-1). mq-BOLD: We obtained intrinsic R2 (=1/T2), effective R2* (=1/T2*) and susceptibility related R2’ (=R2*-R2) from multi-SE and multi-GE data by mono-exponential fits11,18 and corrected T2* for macroscopic background gradients19,20 and motion.21,22 ΔR2*(BOLD-TC): We calculated changes in effective R2* (ΔR2*=ΔS/S0/TE) from dynamic EPI-time series signal changes (ΔS=S-S0, baseline S0). CBF maps were calculated from pCASL data following Alsop et.al.23
Results:
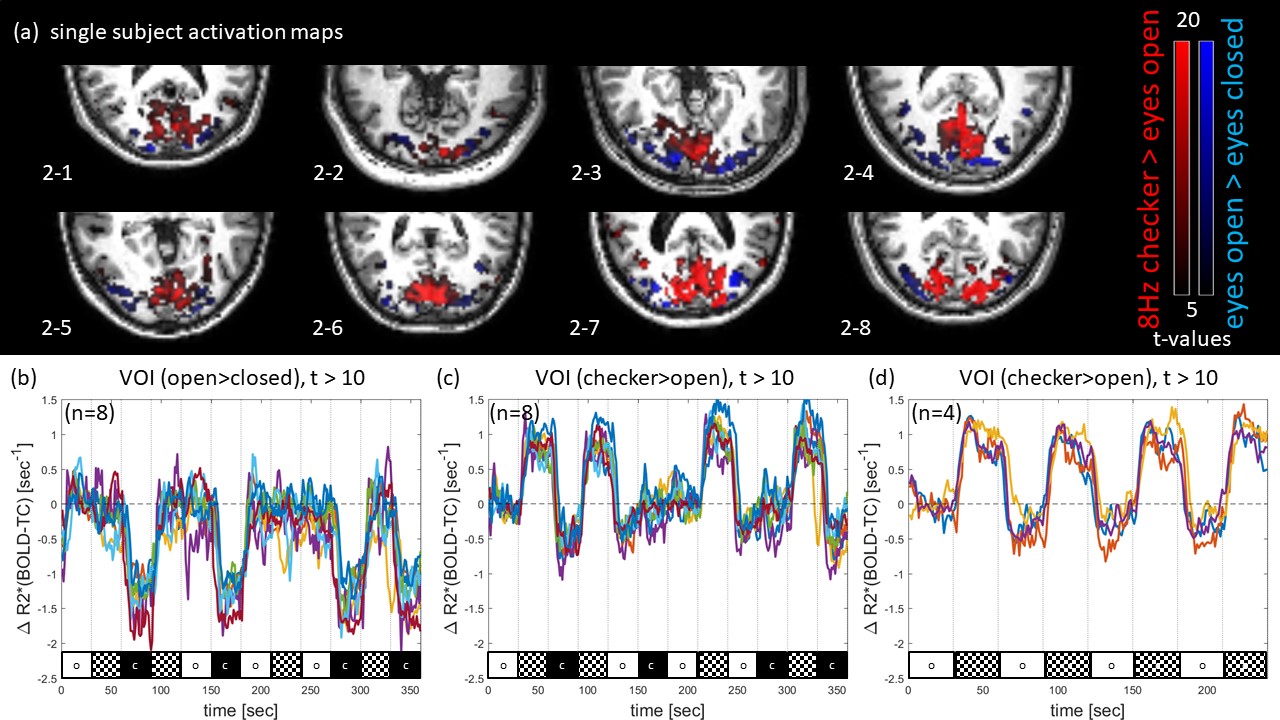
Task-fMRI-based functional localizer experiments yielded robust activation in each individual subject (Fig.2a). Contrasts ‘open>closed’ and ‘checker>open’ identified largely distinct areas of visual cortex, where strong responses in central areas were related to ‘checker>open’, while ‘open>closed’ elicited weaker more lateral activation. VOI-average ΔR2*(BOLD-TC) time courses demonstrate reliable changes across all conditions for each subject (Fig.2b-d).
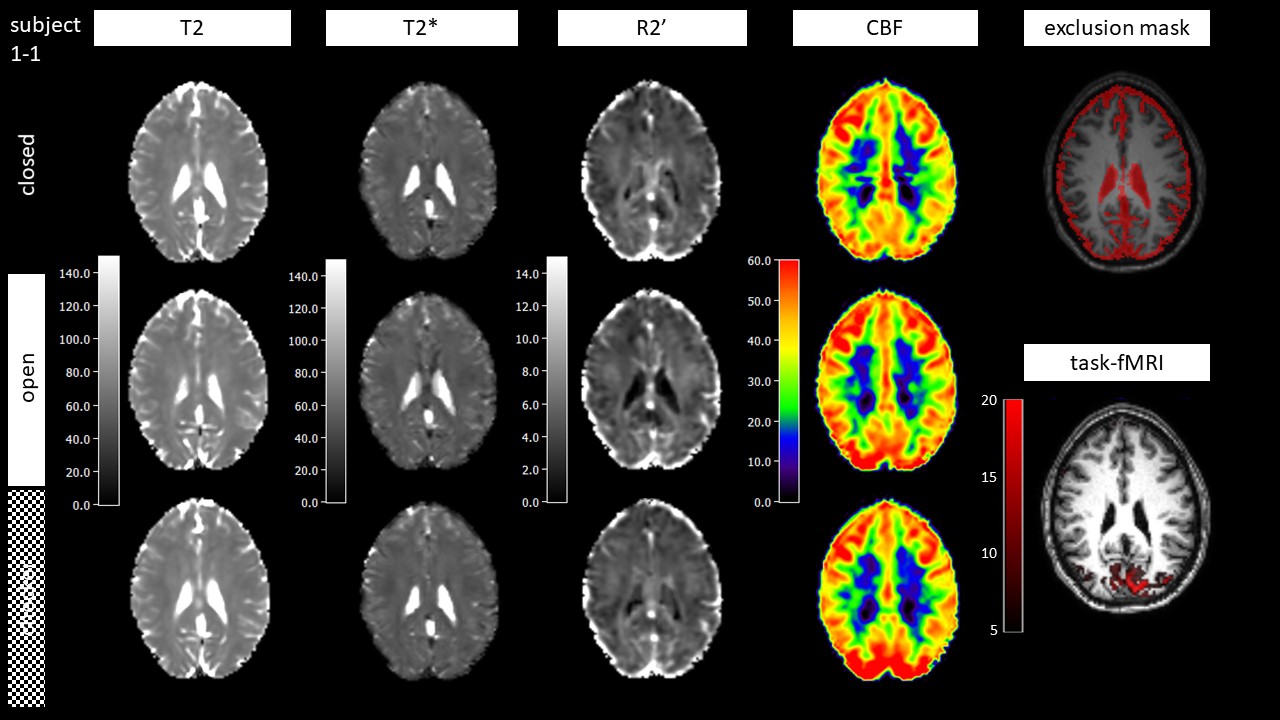
Fig.3 shows an exemplary slice of all imaging modalities with comparable
data quality across conditions. Visual inspection already suggests higher CBF in
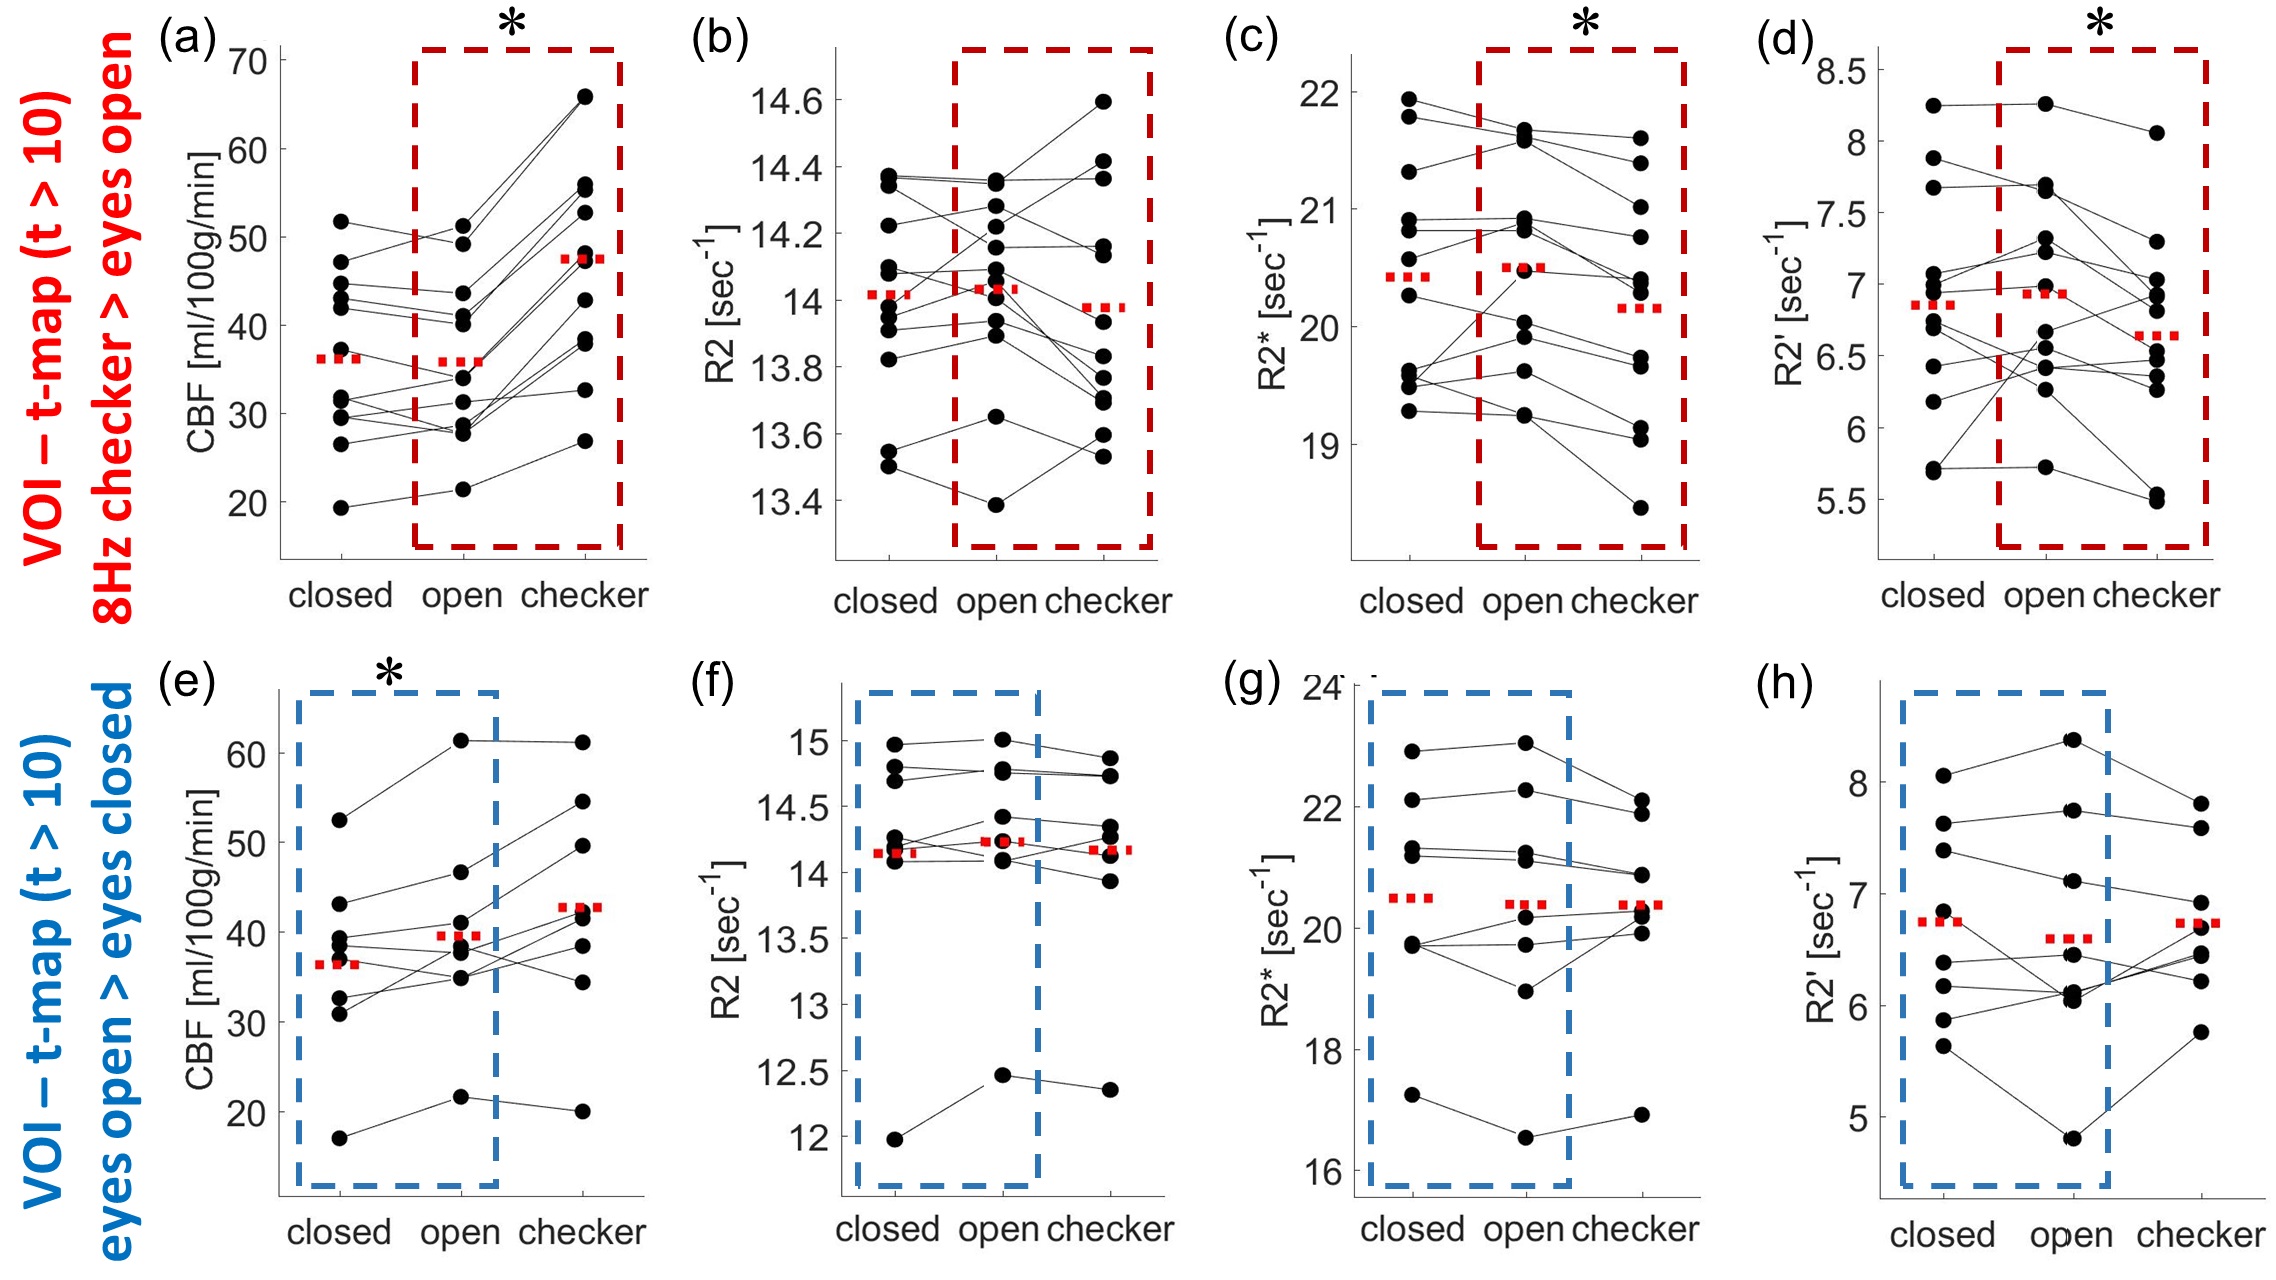
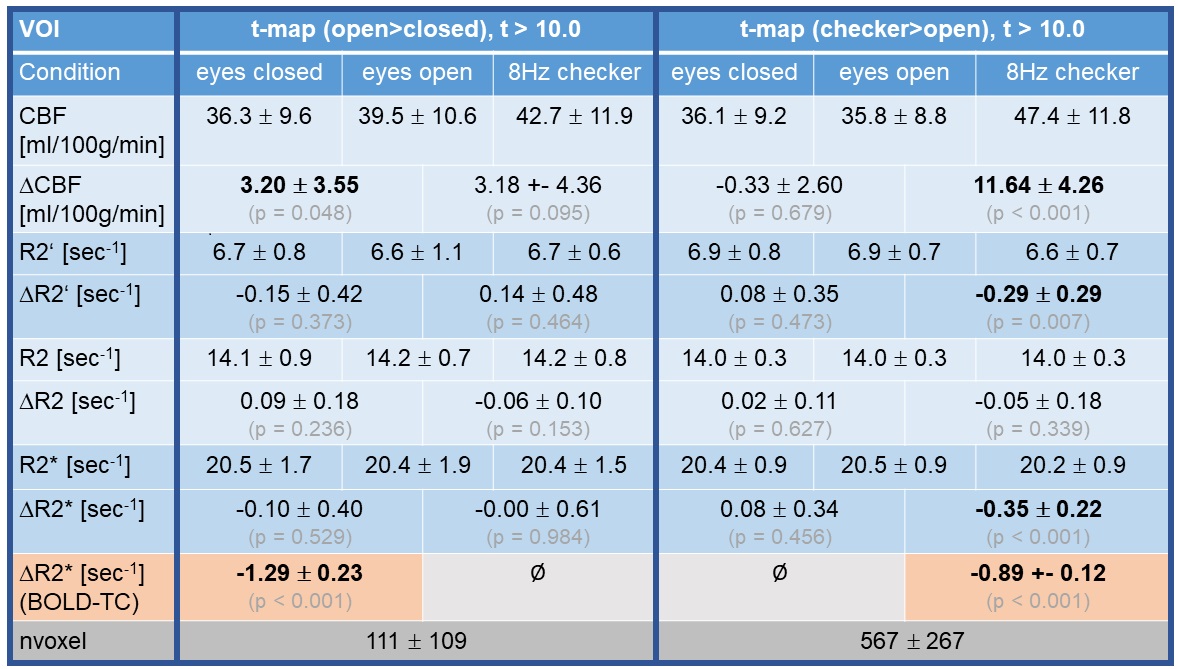
visual cortex for ‘open’ and ‘checker’. VOI analysis of mq-BOLD parameters
(Fig.4, Table1) yielded a significant increase of CBF in both contrasts, though
weaker for ‘open>closed’. We also found significantly decreased R2’ (driven
mainly by decreased R2*) upon checkerboard stimulation, but not for
‘open>closed’. Please note consistent CBF and R2* changes for each
individual (Fig.4a,c) for visual stimulation yet higher variability for
‘open>closed’.
Discussion:
In regions of significant visual cortex activation
(task-fMRI), we found significant differences for CBF, R2’ and R2*
(checker>open) and for CBF (open>closed) (Fig.4, Table1), according with literature.5,24-26 We compared these findings with ΔR2*(BOLD-TC) from the task-fMRI localizer experiments. On the
individual subject level (Fig.4), we found consistent changes for CBF and R2’
(diverging for 0/12 and 3/12) after visual stimulation. The more subtle
condition of ‘open>closed’ did not induce reliable changes of R2’ and R2*,
yet significant changes for CBF and ΔR2*(BOLD-TC) from
EPI-BOLD data. This suggests, that either a) transient activation is only
captured by shorter blocks of task-fMRI, but not during extended blocks
necessary for mq-BOLD, or b) that GE-based T2* measurement are more prone to
motion artefacts, which cannot always sufficiently be corrected.21,22
Conclusion:
Our results demonstrate that mq-BOLD measurements of activation-related changes are well feasible for standard visual stimulation experiments. However, subject motion and transient states of brain activation might impact on image quality due to longer measurement times. These challenges need to be addressed by study design and improved head immobilization.Acknowledgements
We thank Prof. Dr. Ralf Deichmann for providing a matlab program implementing motion correction for T2* maps based on repeated acquisition of the k-space center. This work was funded by the German Research Foundation (DFG, grant PR 1039/6-1).References
- Kwong KK, Belliveau JW, Chesler DA, Goldberg IE, Weisskoff RM, Poncelet BP, et al., Dynamic magnetic resonance imaging of human brain activity during primary sensory stimulation. Proc Natl Acad Sci U S A, 1992. 89(12): p. 5675-9.
- Ogawa S, Tank DW, Menon R, Ellermann JM, Kim SG, Merkle H, et al., Intrinsic signal changes accompanying sensory stimulation: functional brain mapping with magnetic resonance imaging. Proc Natl Acad Sci U S A, 1992. 89(13): p. 5951-5.
- Davis TL, Kwong KK, Weisskoff RM,Rosen BR, Calibrated functional MRI: mapping the dynamics of oxidative metabolism. Proc Natl Acad Sci U S A, 1998. 95(4): p. 1834-9.
- Hoge RD, Atkinson J, Gill B, Crelier GR, Marrett S,Pike GB, Investigation of BOLD signal dependence on cerebral blood flow and oxygen consumption: the deoxyhemoglobin dilution model. Magn Reson Med, 1999. 42(5): p. 849-63.
- Fujita N, Matsumoto K, Tanaka H, Watanabe Y,Murase K, Quantitative study of changes in oxidative metabolism during visual stimulation using absolute relaxation rates. NMR Biomed, 2006. 19(1): p. 60-8.
- Blockley NP, Griffeth VE, Simon AB, Dubowitz DJ,Buxton RB, Calibrating the BOLD response without administering gases: comparison of hypercapnia calibration with calibration using an asymmetric spin echo. Neuroimage, 2015. 104: p. 423-9.
- Blockley NP, Griffeth VE,Buxton RB, A general analysis of calibrated BOLD methodology for measuring CMRO2 responses: comparison of a new approach with existing methods. Neuroimage, 2012. 60(1): p. 279-89.
- Berman AJL, Mazerolle EL, MacDonald ME, Blockley NP, Luh WM,Pike GB, Gas-free calibrated fMRI with a correction for vessel-size sensitivity. Neuroimage, 2018. 169: p. 176-88.
- Kida I, Kennan RP, Rothman DL, Behar KL,Hyder F, High-resolution CMR(O2) mapping in rat cortex: a multiparametric approach to calibration of BOLD image contrast at 7 Tesla. J Cereb Blood Flow Metab, 2000. 20(5): p. 847-60.
- Christen T, Schmiedeskamp H, Straka M, Bammer R,Zaharchuk G, Measuring brain oxygenation in humans using a multiparametric quantitative blood oxygenation level dependent MRI approach. Magn Reson Med, 2012. 68(3): p. 905-11.
- Hirsch NM, Toth V, Forschler A, Kooijman H, Zimmer C,Preibisch C, Technical considerations on the validity of blood oxygenation level-dependent-based MR assessment of vascular deoxygenation. NMR Biomed, 2014. 27(7): p. 853-62.
- Gottler J, Kaczmarz S, Kallmayer M, Wustrow I, Eckstein HH, Zimmer C, et al., Flow-metabolism uncoupling in patients with asymptomatic unilateral carotid artery stenosis assessed by multi-modal magnetic resonance imaging. J Cereb Blood Flow Metab, 2018: p. 271678X18783369.
- Gersing AS, Ankenbrank M, Schwaiger BJ, Toth V, Janssen I, Kooijman H, et al., Mapping of cerebral metabolic rate of oxygen using dynamic susceptibility contrast and blood oxygen level dependent MR imaging in acute ischemic stroke. Neuroradiology, 2015. 57(12): p. 1253-61.
- Toth V, Forschler A, Hirsch NM, den Hollander J, Kooijman H, Gempt J, et al., MR-based hypoxia measures in human glioma. J Neurooncol, 2013. 115(2): p. 197-207.
- Preibisch C, Shi K, Kluge A, Lukas M, Wiestler B, Gottler J, et al., Characterizing hypoxia in human glioma: A simultaneous multimodal MRI and PET study. NMR Biomed, 2017. 30(11).
- Penny WD, Friston KJ, Ashburner JT, Kiebel SJ,Nichols TE, Statistical Parametric Mapping: The Analysis of Functional Brain Images. . 2011: Elsevier Science.
- The MathWorks. Natick M, USA. 2016b.
- Kaczmarz S, Göttler J, Hock A, Karampinos D, Zimmer C, Hyder F, et al., Reducing T2-related bias in mq-BOLD derived maps of Oxygen Extraction Fraction by 3D acquisition. Proc. Intl. Soc. Mag. Reson. Med. , 2018. 26: p. 5023.
- Hirsch NM, Preibisch C, T2* mapping with background gradient correction using different excitation pulse shapes. AJNR Am J Neuroradiol, 2013. 34(6): p. E65-8.
- Preibisch C, Volz S, Anti S,Deichmann R, Exponential excitation pulses for improved water content mapping in the presence of background gradients. Magn Reson Med, 2008. 60(4): p. 908-16.
- Noth U, Volz S, Hattingen E,Deichmann R, An improved method for retrospective motion correction in quantitative T2* mapping. Neuroimage, 2014. 92: p. 106-19.
- Magerkurth J, Volz S, Wagner M, Jurcoane A, Anti S, Seiler A, et al., Quantitative T*2-mapping based on multi-slice multiple gradient echo flash imaging: retrospective correction for subject motion effects. Magn Reson Med, 2011. 66(4): p. 989-97.
- Alsop DC, Detre JA, Golay X, Gunther M, Hendrikse J, Hernandez-Garcia L, et al., Recommended implementation of arterial spin-labeled perfusion MRI for clinical applications: A consensus of the ISMRM perfusion study group and the European consortium for ASL in dementia. Magn Reson Med, 2015. 73(1): p. 102-16.
- Berger MC, Bachert P, Grobner J,Nagel AM, Multi-contrast T2*-relaxometry upon visual stimulation at 3T and 7T. Magn Reson Imaging, 2016. 34(7): p. 864-74.
- Donahue MJ, Hoogduin H, van Zijl PC, Jezzard P, Luijten PR,Hendrikse J, Blood oxygenation level-dependent (BOLD) total and extravascular signal changes and ΔR2* in human visual cortex at 1.5, 3.0 and 7.0 T. NMR Biomed, 2011. 24(1): p. 25-34.
- Schwarzbauer C, Heinke W, Investigating the dependence of BOLD contrast on oxidative metabolism. Magn Reson Med, 1999. 41(3): p. 537-43.
Figures