3734
IVIM-based cerebral perfusion (in ml/100g/min) values at rest, hypercapnia and ischemia in an MCA occlusion model1Department of Radiology, University of Chicago, Chicago, IL, United States, 2Bioengineering and Biomedical Engineering, Northwestern, Chicago, IL, United States
Synopsis
This is a preliminary study of intravoxel incoherent motion (IVIM) in a two day study of normocapnia, hypercapnia, and post middle cerebral artery occlusion. It was established that IVIM perfusion values are linearly correlated to the reference perfusion values under a variety of physiologic states meaning IVIM perfusion values can be easily quantified. Once scaled, the IVIM CBF of white matter and grey matter normocapnia and post-occlusion cortex on both hemispheres were strongly correlated to the reference standard.
Target Audience
Researchers and clinicians interested in noninvasive perfusion imaging via MRI.Introduction
Perfusion imaging is important in diagnosis, treatment, and prognosis of neurological diseases. Intravoxel incoherent motion (IVIM) perfusion imaging is a well-established technique for extracting perfusion-weighed contrast from diffusion-weighted images1. We have developed a scan protocol and image post processing algorithm that can quantify cerebral perfusion (i.e. Cerebral Blood Flow in ml/100g/min) using IVIM images. We compare our results to reference standard, quantitative DSC CBF values that have been independently compared to H2[O15] PET studies in our experiments (CBFMRI=0.75*CBFPET+0.89, r=0.81).2,3 If it can be established that IVIM perfusion values are linearly correlated with true perfusion then IVIM perfusion values can be easily quantified, thereby allowing longitudinal and cross-sectional comparison in patient populations.
The goal of this work is to test the hypothesis that IVIM perfusion values are correlated with true perfusion and to determine the sensitivity to IVIM over a range of physiologic states. We hypothesize that quantitative IVIM perfusion values correlate with reference standard “truth” values.
Methods
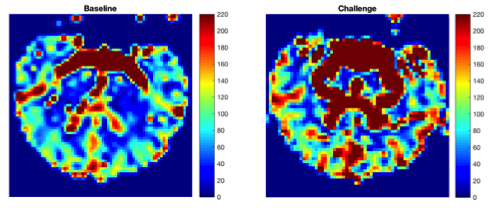
All MRI scans were performed on a 3T MRI scanner (Achieva, Philips) using a 15 channel receive only coil. A series of n=8 experiments (mean age 5.6y, 5 female, 3 male) were normocapnic and anesthesia was achieved by isoflurane (1% end-tidal, 0.75 MAC), continuous propofol infusion (100-200 µg/kg/min), and intravenous rocuronium (0.4-0.6 mg/kg) to maintain normal cerebral perfusion. Ten b-values (0,111, 222, 333, 444, 556, 667, 778, 889, 1000), and 3 directions of DWI images were acquired to cover the whole head (slices/thickness= 2mm, FOV = 14764mm, total scan time =332s ). In a series of two-day experiments, subjects were scanned at normocapnia (ETCO2 ~ 30 mmHg), hypercapnia (7% carbogen respiration, ETCO2 ~ 60 mmHg) and on day two, at normocapnia after middle cerebral artery occlusion. In all cases IVIM and DSC perfusion images where acquired within 5 minutes. Normocapnia and hypercapnia IVIM perfusion images are shown in Figure.1.
IVIM data with 10 b-values from 0 to 1000 were fit to a bi-exponential function to retrieve cerebral blood volume $$$(f)$$$ and pseudo-diffusion coefficient $$$(Dstar)$$$ for perfusion values; $$$S(t)=fe^{-Dstar b}+(1-f)e^{-Db}$$$ with IVIM CBF $$$=f*Dstar$$$. IVIM CBF values of normal appearing white matter (NAWM) were calibrated to perfusion of 23 ml/100g/min and shown to have a linear relation to DSC qCBF in regions of interest (ROIs). Correlation between DSC qCBF and scaled IVIM CBF were compared using standard scatterplots based on vascular territory regions of interest (ROIs). Cerebrovascular Reactivity (CVR) was calculated from $$$CVR = \frac{CBF_C - CBF_B}{CBF_B}\times \frac{100}{\Delta CO_2}$$$ with $$$CBF_B$$$ as the cerebral blood flow of the cortex at baseline normocapnia, and $$$CBF_C$$$ as cerebral blood flow of the cortex post $$$CO_2$$$ challenge at hypercapnia. The resulting quantitative IVIM images were compared, voxel-by-voxel, to reference standard values as pseudo-probability density functions using Kolmogorov-Smirnov test to minimize the bias introduced by ROI drawing.
Discussion
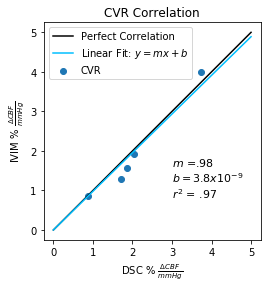
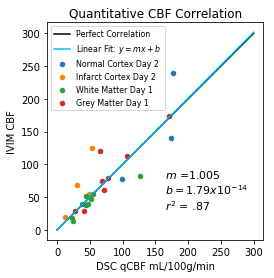
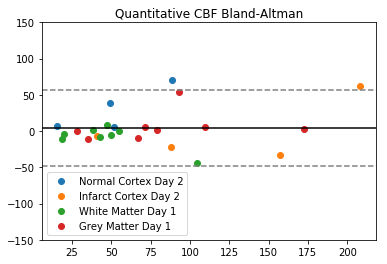
Correlation of CVR was found with a correlation coefficient of $$$m = .98, b = 3.8 \times 10^{-9}$$$ and an $$$r^{2}=.97$$$, seen in Figure 2, showing the linear relation between IVIM CBF and $$$DSC_{qCBF}$$$. After showing linear relation to the reference standard, IVIM CBF was scaled with a factor $$$C = \frac{CBF_{DSC}}{CBF_{IVIM}}$$$ with $$$CBF_{DSC}$$$ as average DSC qCBF of the whole brain, and $$$CBF_{IVIM}$$$ the average IVIM CBF of the whole brain. Once scaled, correlation of ROIs was found with a correlation coefficient of $$$m = 1.005, b = 1.79 \times 10^{-14}$$$ and an $$$r^{2}=.87$$$, shown in Figure 3. The perfusion from IVIM and DSC of baseline white matter, baseline grey matter, and post occlusion cortex on both hemispheres were statistically compared with a Bland-Altman plot, shown in Figure 4.Conclusion
If properly calibrated, quantitative IVIM perfusion values correlate strongly with reference values over a range of values and physiologic conditions, such as occlusion and hypercapnia. Cerebrovascular reserve measured with IVIM perfusion values are in strong agreement with reference values. These results support the further development of IVIM measured perfusion for clinical use.Acknowledgements
Research reported in this publication was supported by the National Institute of Neurological Disorders and Stroke of the National Institutes of Health under award number R01NS093901-01A1.
References
[1] D. Le Bihan, E. Breton, D. Lallemand, M.L. Aubin, J. Vignaud, and M. Laval-Jeantet. Separation of diffusion and perfusion in intravoxel incoherent motion mr imaging. Radiology, 168, 1988.
[2] W. Shin, S. Horowitz, A. Ragin, Y.Chen, M.Walker, and T.J. Carroll. Quantitative cerebral perfusion using dynamic susceptibility contrast mri: Evaluation of reproducibility and age-and genderdependence
[3] P. Vakil, J. J. Lee , J. Mouannes-Srour, C.P. Derdeyn, T. J. Carroll. Cerebrovascular Occlusive Disease: Quantitative Cerebral Blood Flow Using Dynamic Susceptibility Contrast MR Imaging Correlates with Quantitative H2[15O] PET. Radiology, 266, 2013
Figures