3727
Title: A Closer Look at the Vascular Component of Hemodynamic Response Function and Its Variations by Aging1Medical Biophysics, University of Toronto, Toronto, ON, Canada, 2Rotman Research Institute, Baycrest Centre, Toronto, ON, Canada
Synopsis
It has been shown that the brain vasculature changes with aging. The unhealthy brain vasculature is associated with risks of a lot of conditions such as stroke and ischemic attacks. Moreover, some studies have confirmed the causality of the impaired vasculature and the diseases of aging such as Alzheimer’s disease. Herein, we study the effect of aging on the vascular component of the hemodynamic response function. The results demonstrated narrower and more positively skewed distributions of peak spectral power in older controls which indicate degradation in some regions of the brains of the older adults.
Introduction
The prevalence of both neurodegeneration and vascular diseases rise with age 1. Vascular disease not only coexists with the neurodegenerative process, but has also been shown to contribute to it 2, and, as recently suggested, may even initiate it 3. Previously, Golestani et al. 4, showed that cerebrovascular reactivity (CVR), a critical measure of vascular health, could be mapped quantitatively, using resting state functional MRI 4. Considering, carbondioxide (CO2) as a vascular agent, They quantified CVR, by looking at the response of the BOLD signal to the fluctuations of the end tidal partial pressure of CO2 (PETCO2), which is a surrogate for vascular CO2. Using a similar methodology, instead of CVR, we study the hemodynamic response function of the brain to the purely vascular agent PETCO2 (HRFPETCO2) and its variations with aging. The resting state BOLD signal here is modelled in terms of its three physiological components: fluctuations in end-tidal partial pressure of CO2 (PETCO2), respiratory volume variability (RVT), and heart rate variability (CRV), each convolved by its hemodynamic response function (HRF) in order to demonstrate its contribution to the output BOLD signal.
Methods
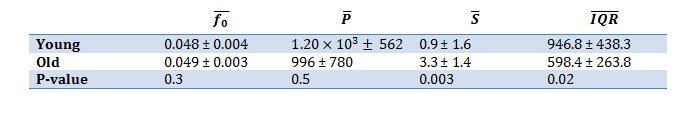
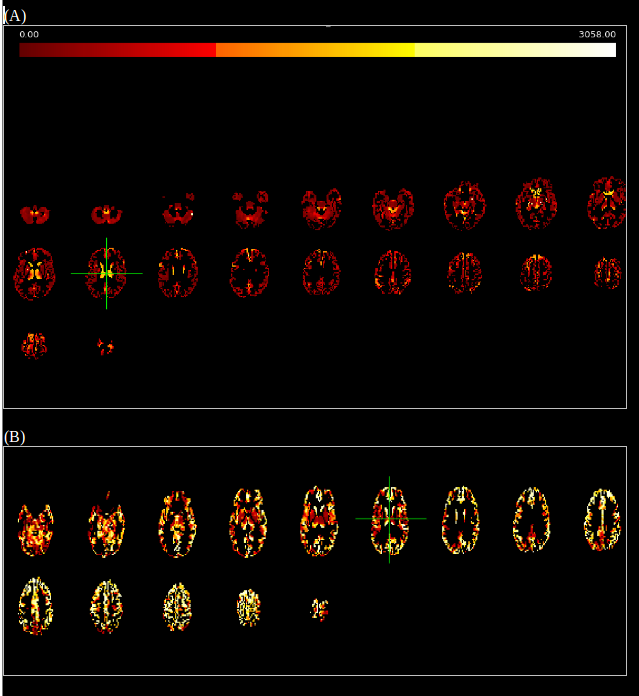
15 young (8M/7F, mean age = 26.7±4.3 years) and 13 old (5M/7F, mean age = 74.1±6.5) healthy controls were scanned using a Siemens TIM Trio 3T system, using simultaneous-multislice EPI sequence (TR/TE=380/30, multi-slice factor = 3). Subjects were at rest with eyes closed, with their heart rate, respiratory volume and PETCO2 recorded. Preprocessing steps included motion correction, slice timing correction, motion censoring, spatial smoothing, band- pass filtering and RETROICOR. As for our analysis, first We orthogonalized CRV and RVT traces against the PETCO2 time course; and then down-sampled all three waveforms to match fMRI sampling rate. Voxel-wise HRF of CRV and RVT signals were estimated based on a multi-variate deconvolution model 5. In this model, as brought in equation (1), the resting-state BOLD signal is estimated to be the summation of its physiological components convolved by the corresponding HRFs (the responses that the components induce in the brain), and an error factor (e). Next steps include calculating the HRF of each signal using maximum a-posteriori likelihood (MAPL)6, convolving the orthogonalized CRV and RVT with their respective response functions of the brain at each voxel, and regressing the result from the preprocessed fMRI data. The remaining part of the BOLD signal is approximated to be the PETCO2 convolved by its HRFPETCO2. We then use deconvolution, to look at the response of the brain to spontaneous PETCO2 fluctuations (HRFPETCO2). In order to obtain a better understanding about the nature of our HRFPETCO2, we looked at the power spectral density (PSD) of the HRFPETCO2 at each voxel throughout the gray matter using Fourier transform of the voxel-wise HRFPETCO2. PSDs were normalized to have unit power (i.e., unit area under). Bandwidths of the PSDs were measured using the -3dB cut-off frequency. We moreover quantified the peak of the power spectra following normalization, and looked at the distribution of this value over the gray matter for each subject. To characterise these distributions, we measured the skewness and the interquartile distance. For comparison purposes, we took the average value of each variable over the gray matter for each subject and we performed student t-test distribution between cohorts.
BOLD= CRV*HRFCRV+RVT*HRFRVT+PETCO2*HRFPETCO2+e (1)
Results
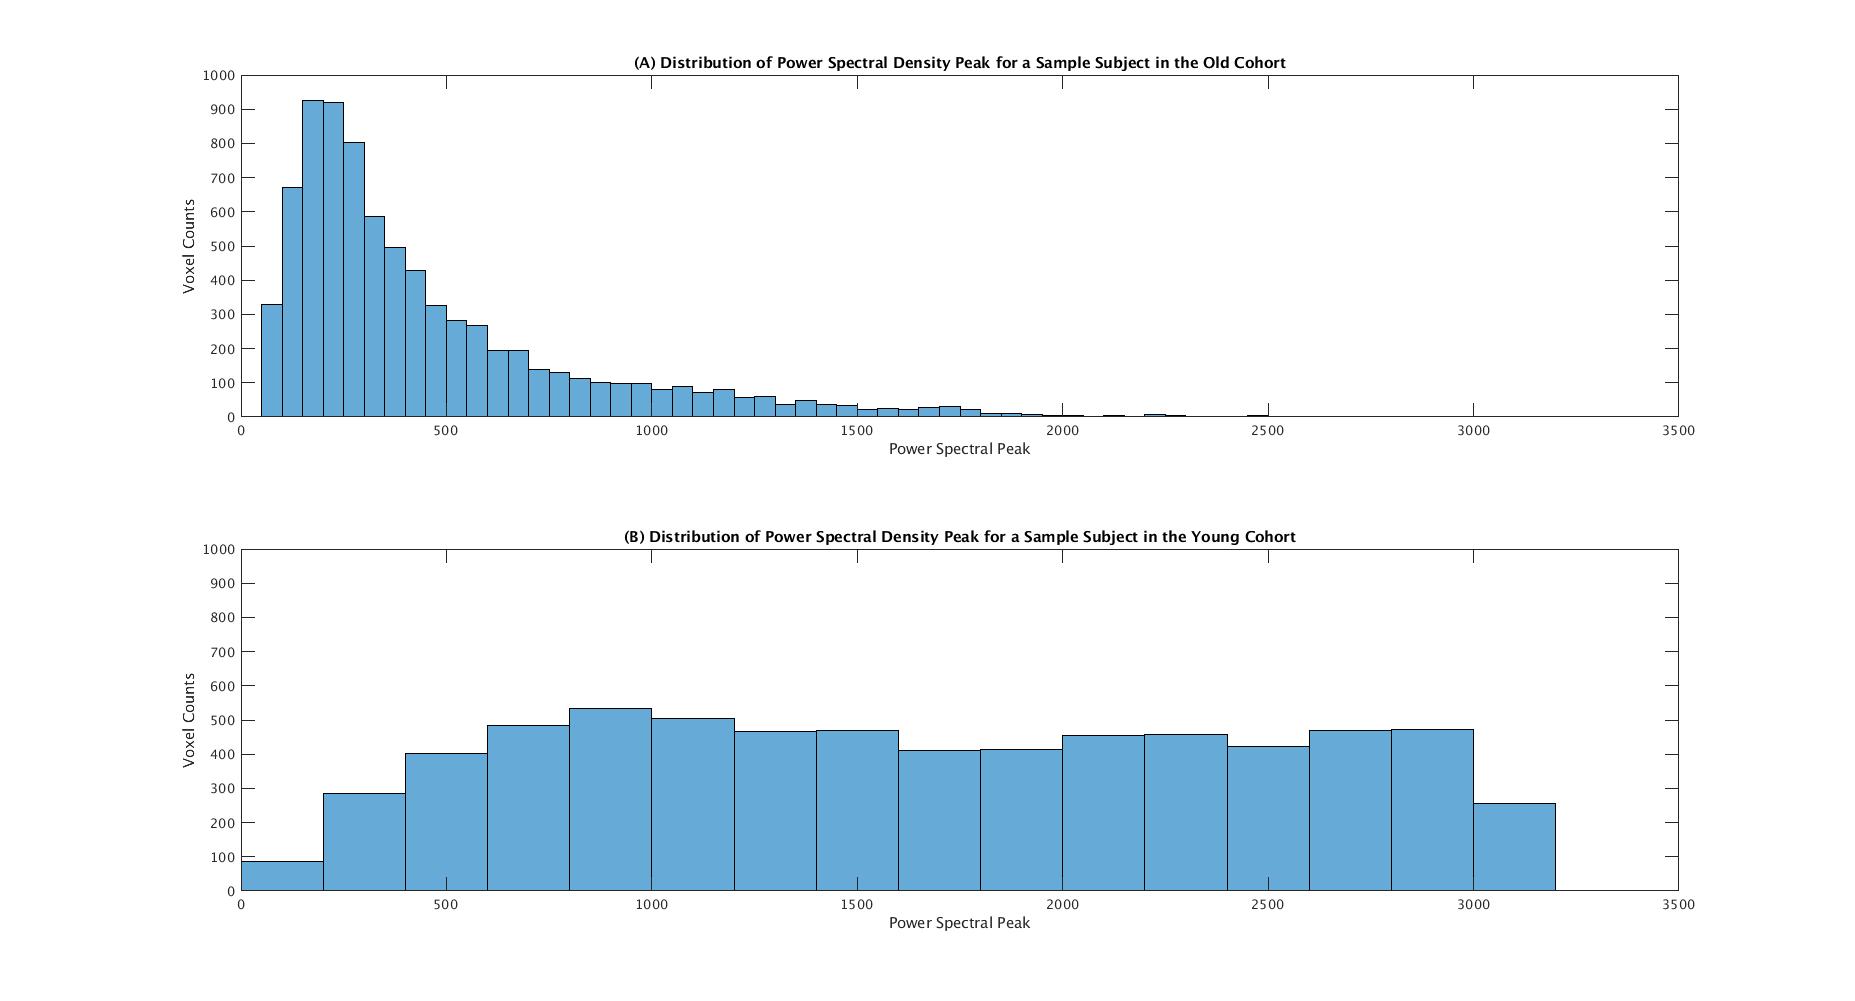
Our results show that the old cohort showed a narrower and more positively skewed voxel-wise power distributions. Since the distribution in younger adults extend well to higher values (Fig.2. and Fig.3.) there are more voxels with stronger peaks in the brains of the young cohort. In contrast, the distribution of the peak power, is more concentrated in the lower values for the older cohort, so that it seems there are regions in the brain whose peak values shifted towards the lower values by aging.Discussion
Our current results show that the distributions of peak power over the brains of older controls were significantly narrower and more skewed. This change in distribution demonstrates that some regions of the brains of the older adults deviate considerably from the ones in the younger cohort. It also shows that there are more voxels with lower hemodynamic response function peak power in the older cohort. This confirms our expectation that there are some regions of the gray matter in which the vascular reactivity and functionality degrade with aging.Conclusion
The changes of HRFPETCO2 during aging was investigated. The older controls showed a more skewed and narrower peak power distributions which could be an indicator of the degradation of vascular reactivity in particular regions of the brain.Acknowledgements
No acknowledgement found.References
1. Mariani, E., Polidori, M. C., Cherubini, A. & Mecocci, P. Oxidative stress in brain aging, neurodegenerative and vascular diseases: an overview. J. Chromatogr. B Analyt. Technol. Biomed. Life. Sci.827, 65–75 (2005).
2. Murray, A. D. et al. Brain white matter hyperintensities: relative importance of vascular risk factors in nondemented elderly people. Radiology237, 251–257 (2005).
3. Zlokovic, B. V. Neurovascular pathways to neurodegeneration in Alzheimer’s disease and other disorders. Nat. Rev. Neurosci.12, 723–738 (2011).
4. Golestani, A. M., Wei, L. L. & Chen, J. J. Quantitative mapping of cerebrovascular reactivity using resting-state BOLD fMRI: Validation in healthy adults. NeuroImage138, 147–163 (2016).
5. Golestani, A., Chang, C., B. Kwinta, J., B. Khatamian, Y. & Chen, J. J. Mapping the end-tidal CO2 response function in the resting-state BOLD fMRI signal: Spatial specificity, test–retest reliability and effect of fMRI sampling rate. NeuroImage104, (2015).
6. Marrelec, G., Benali, H., Ciuciu, P., Pélégrini‐Issac, M. & Poline, J.-B. Robust Bayesian estimation of the hemodynamic response function in event-related BOLD fMRI using basic physiological information. Hum. Brain Mapp.19, 1–17 (2003).
Figures