3725
VASO signal decreases associated with BOLD increases: a possible role of CSF volume redistribution1School of Physics & Astronomy, Cardiff University, Cardiff, United Kingdom, 2NIMH, Bethesda, MD, United States
Synopsis
Using manipulations of the arterial tension of carbon dioxide, we demonstrate that the paradoxical decrease in CBV associated with BOLD increases is restricted to voxels with large proportions of CSF. Excluding those voxels , we show that visual responses during hypercapnia have no change in amplitude in VASO and BOLD contrasts, but the time-to-peak of BOLD responses lengthens and CBV peak times, being longer at baseline, remain the same.
INTRODUCTION
Increasing CBF with hypercapnia to model disease states, we have previously shown that the BOLD and CBV coupling is altered with baseline state in a dose dependent fashion [1]. However, VASO contrast is highly sensitive to inflow effects which may be more prevalent when blood flow is increased with hypercapnia. Many voxels show a paradoxical decrease in CBV when an increase would be expected based on the simultaneously acquired positive BOLD response. The purpose of this study is to determine the source of this paradoxical decrease, be it inflow caused by CO2 related CBF increases or other sources, and whether such voxels have had a detrimental influence on previous results.METHODS:
Data were acquired with the 3D EPI SS-SI-VASO sequence [2] in 5 healthy subjects on a Siemens 7T scanner equipped with a 32 channel NOVA head-coil. Sequence parameters: TI=650ms, 22 slices, FOV=130mm, 1.0mm isotropic voxels, pair-TR=4.4s, PF=6/8 with POCS #8, FLASH-GRAPPA=3, phase skip=30. A grayscale radial checkerboard flickering at 8Hz (100% contrast) was presented to subjects in 8 blocks lasting 20s in 4 scan runs (each 500s). The first run was used as a visual localiser.
In 3 runs (randomised order), end-tidal CO2 levels were manipulated by manually adjusting inspired CO2 concentrations above baseline: 0 mmHg (no CO2 delivery), +4 and +8 mmHg. A CO2 localiser run (no visual stimuli), with two 2 mins blocks of +4 or +8 mmHg CO2 (randomized order, duration 600 s) was acquired. Before each run 3 volumes where acquired with a reverse phase encode direction to perform distortion correction. At the end of each run, a further 3 volumes where acquired with identical parameters except pair-TR=9.6s, 56 slices to aid registration. Finally, two structural scans were acquired: an MP2RAGE with FatNavs[3] (0.6 mm isotropic) and a 3D GE SWI sequence with voxel size=0.5×0.5×1 mm, TR=23ms, TE=14ms, FA=8, PF=6/8, GRAPPA=2.
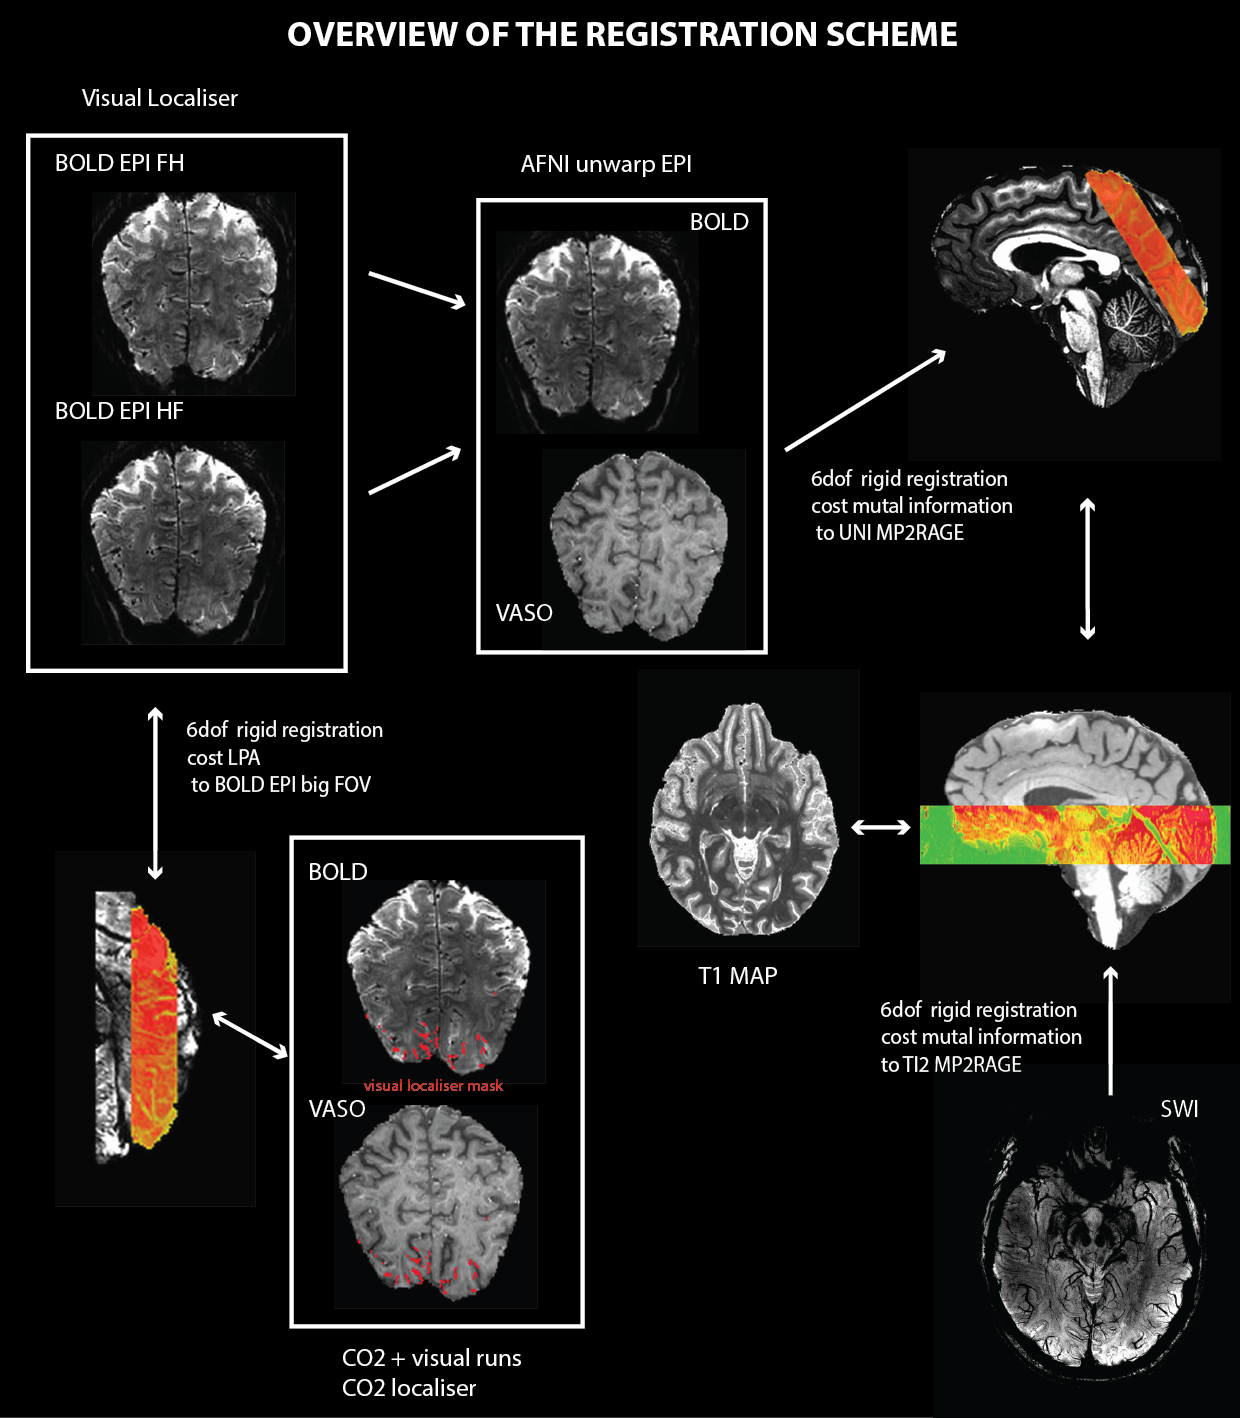
Scans with more than 30% of volumes motion censored (0.5mm Euclidian norm) were excluded. Fits for visual responses for each condition were obtained with boxcar models and end-tidal CO2 traces. A VASO visual localizer mask (threshold p<0.05, cluster-size=10) was used to obtain average time series. Comparison between VASO and BOLD responses was through the shared mask of VASO and BOLD active voxels, each thresholded independently. EPI images were unwarped and registered to the T1 MP2RAGE map and SWI scan as shown in Fig.1. Statistical differences were analyzed with paired t-tests.
RESULTS:
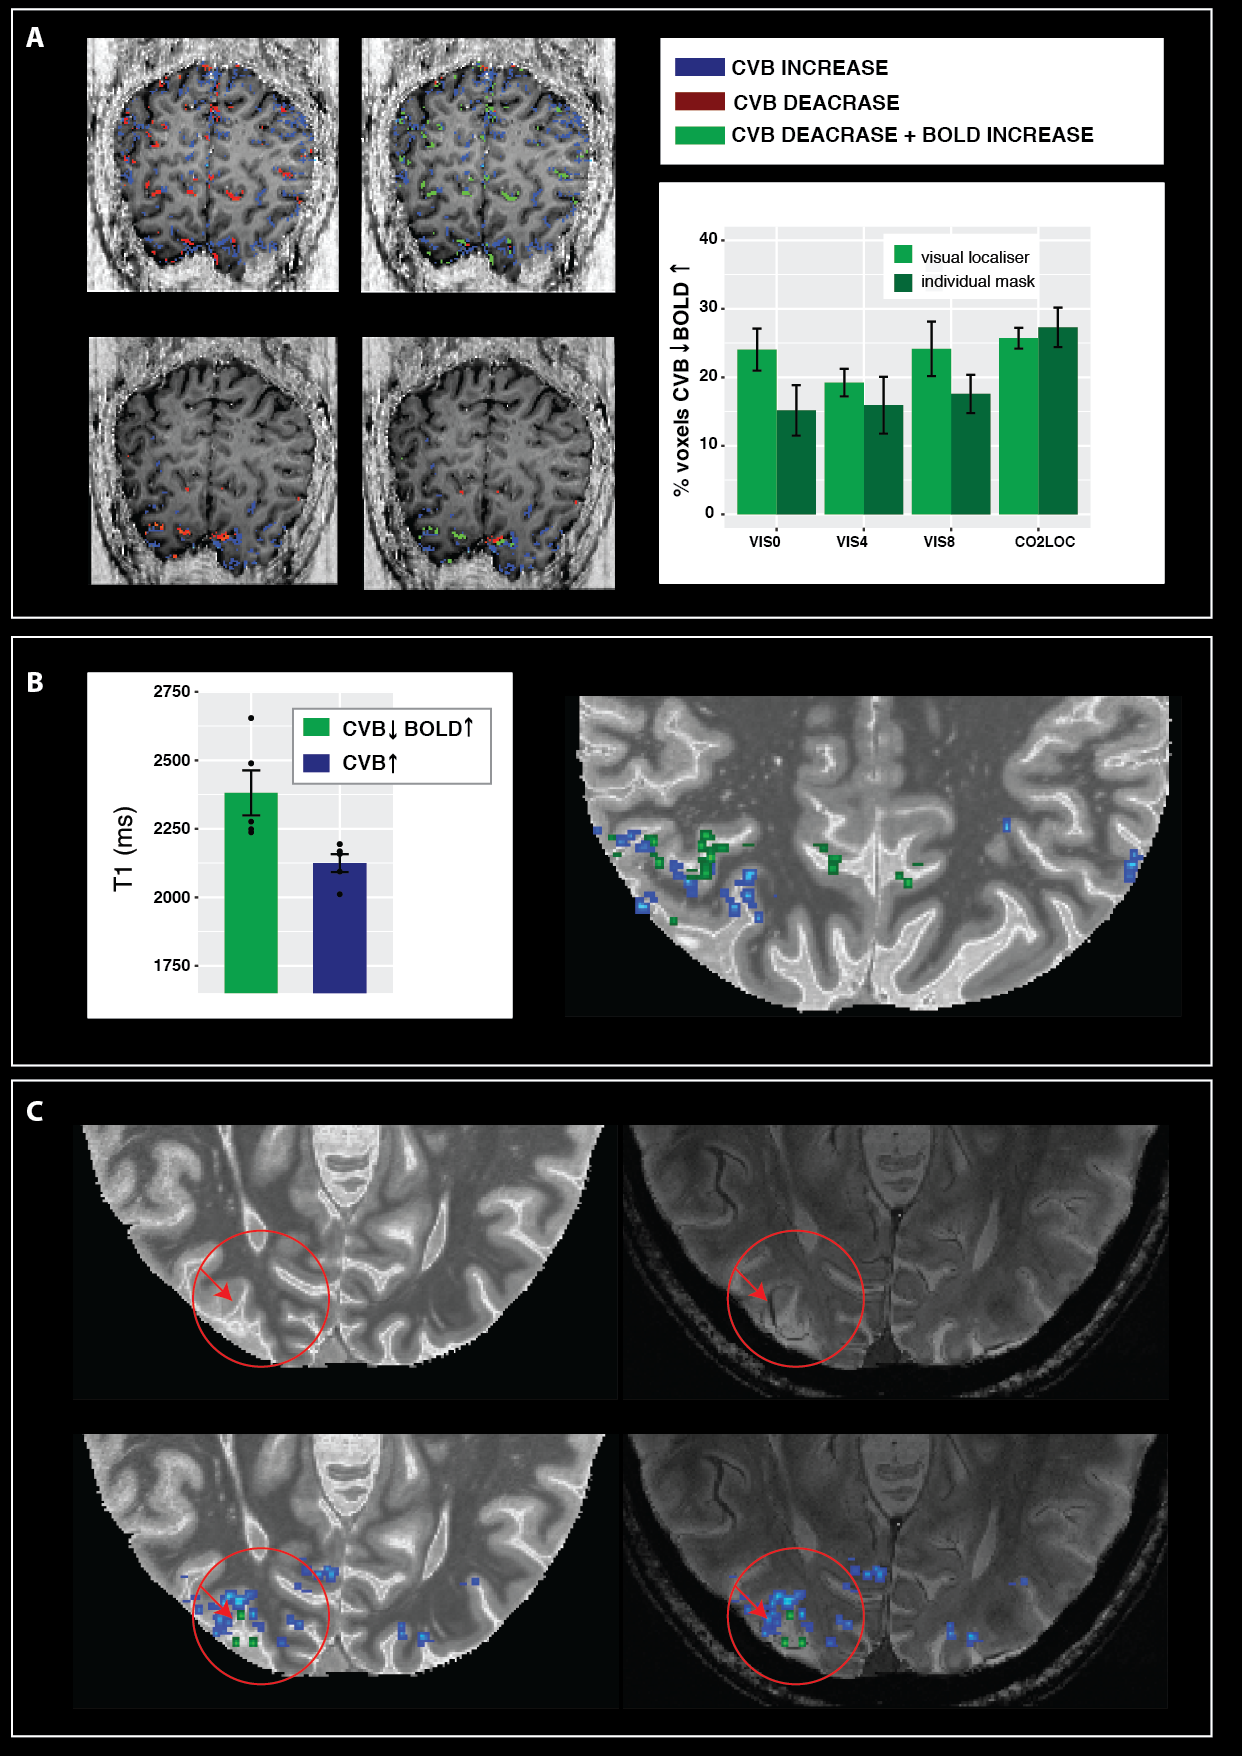
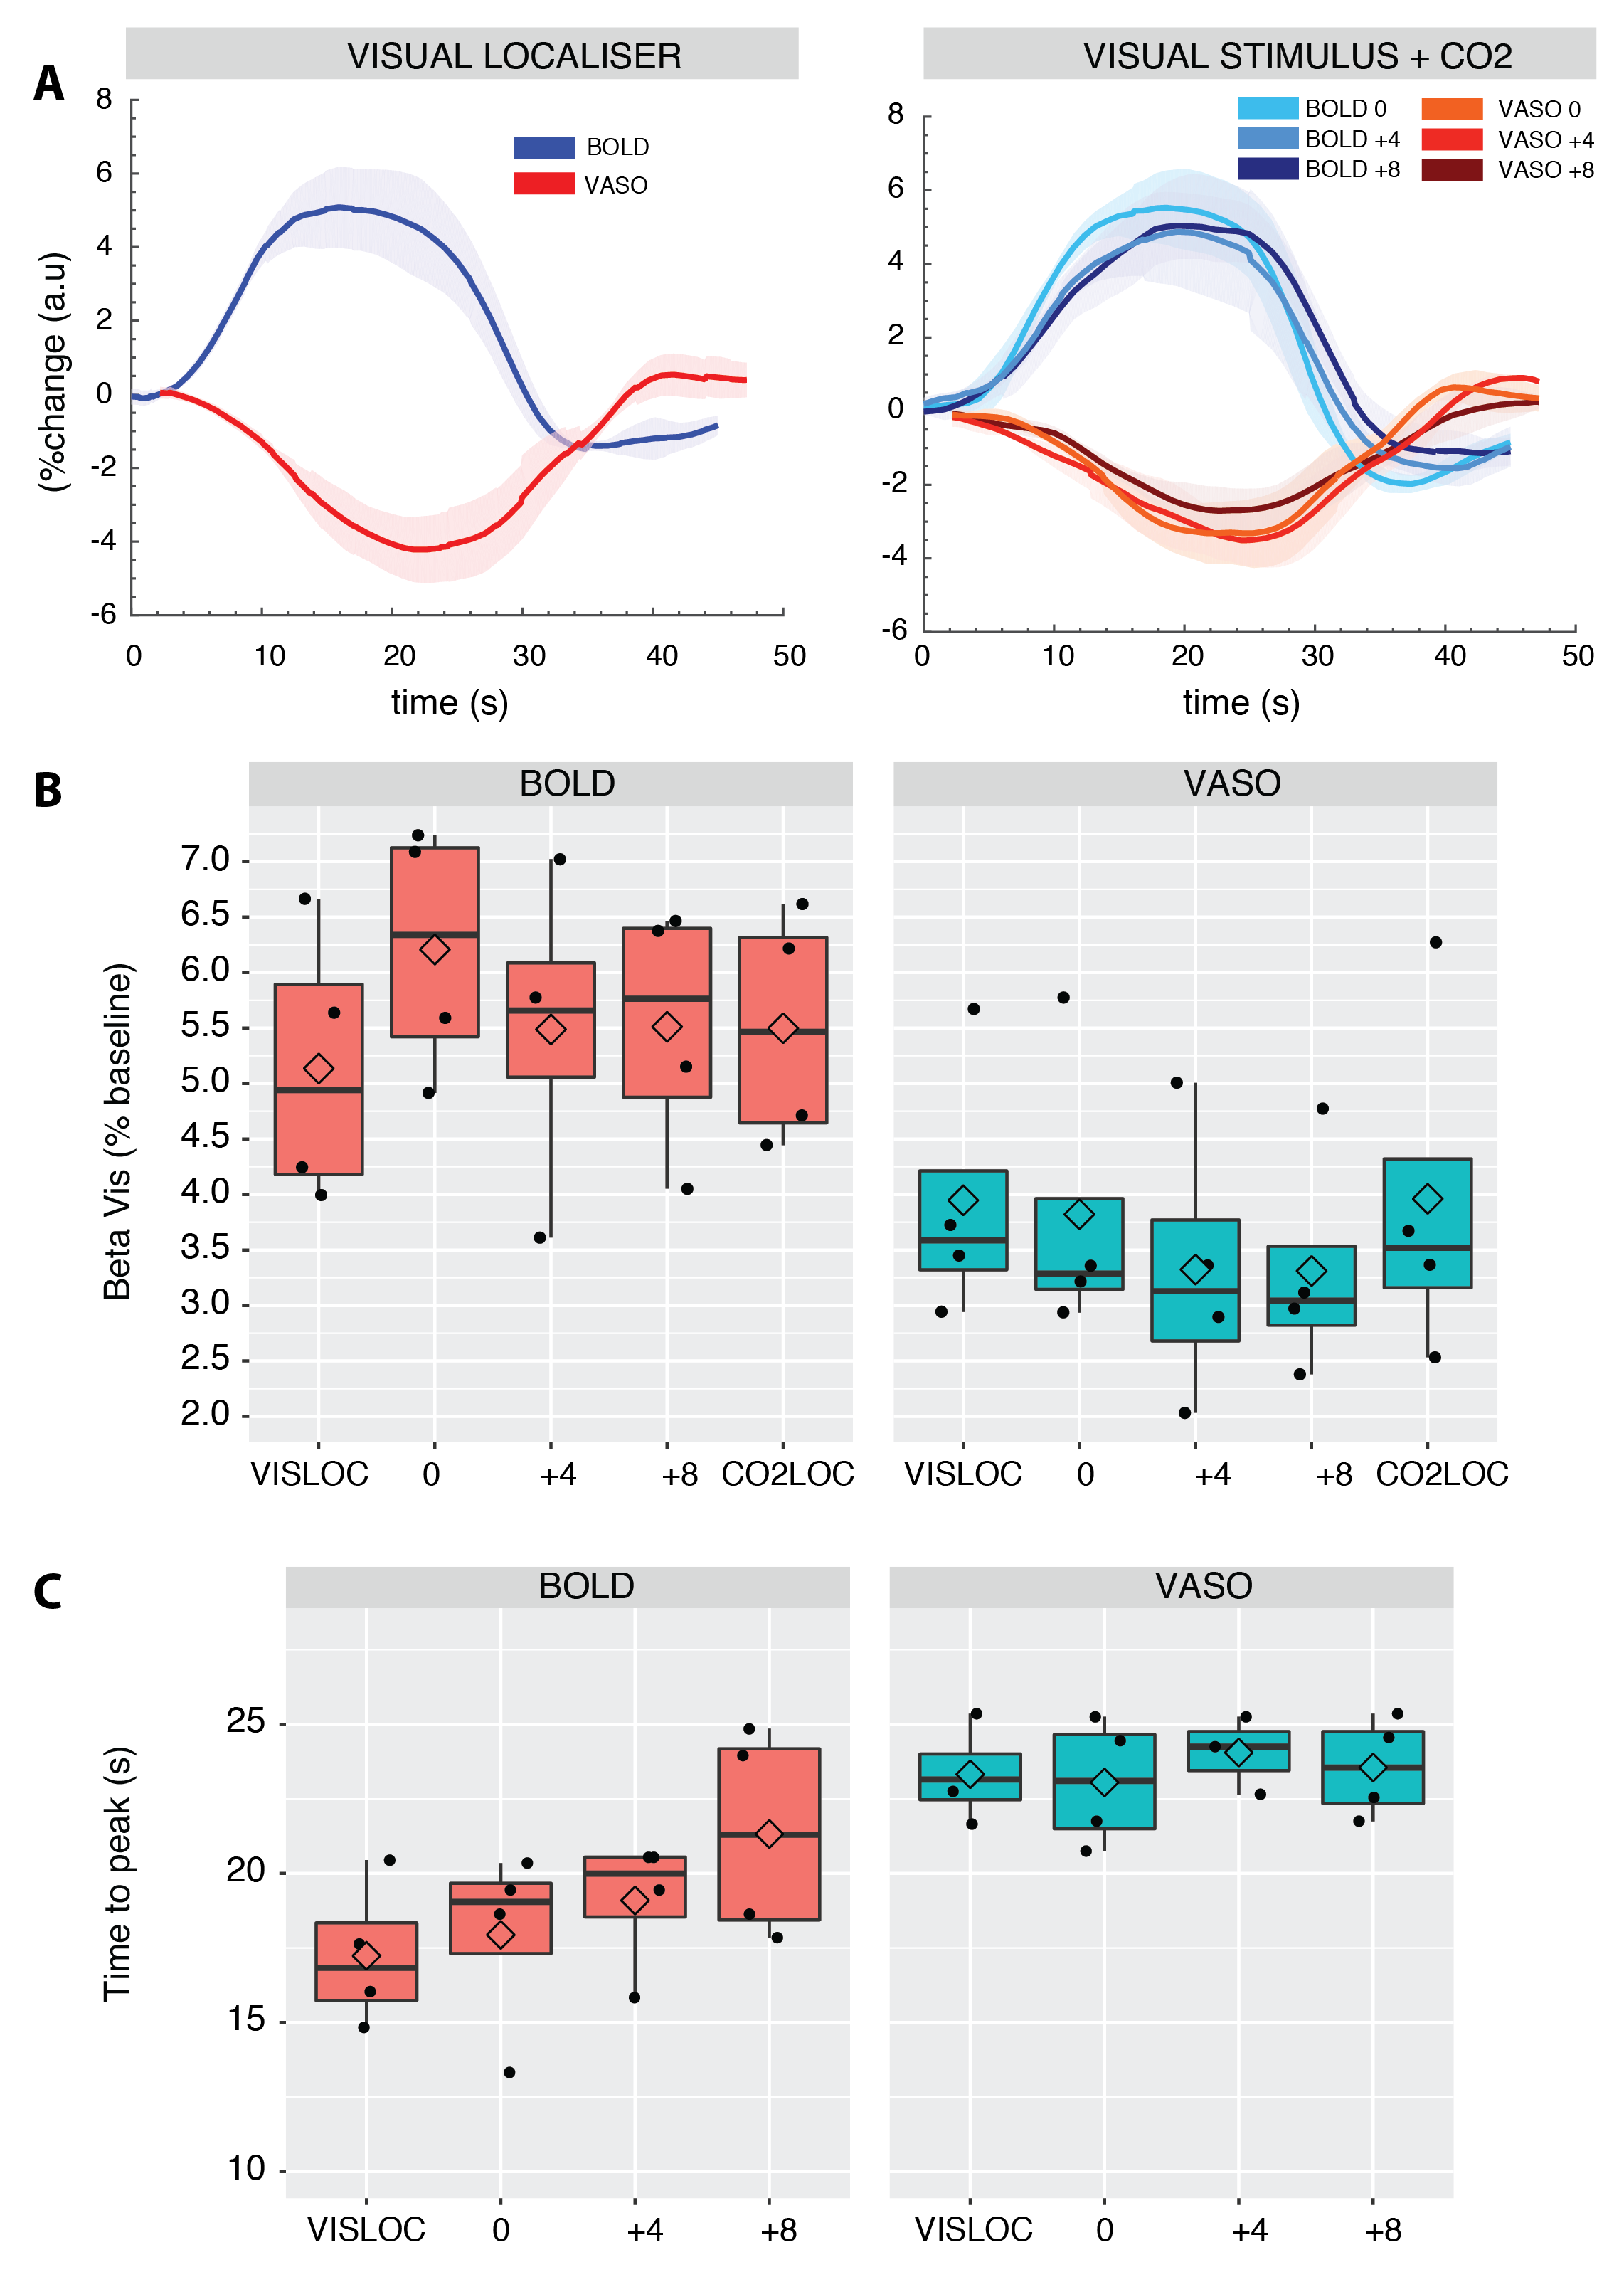
An average of 20.8% of voxels [range 15.1 – 27.3 %] exhibit a paradoxical decrease (PD) in CBV with concomitant increase in BOLD across all runs(Fig.2A). This result was confirmed using both the visual localizer mask and independent clustering of active voxels in each run, ruling out mask selection bias. PD voxels predominantly localized, or had a partial volume with, CSF (Fig.2B) and quantitatively had a longer T1 (PD vs normal: mean difference 256 ms, p=0.019). By qualitatively comparing to the SWI image, we observe that PD voxels do not localize more often to pial veins than positive CBV voxels. Given that PD have predominantly high partial volumes of CSF we excluded them from subsequent analyses. The CO2 localizer stimulation increased BOLD (5.5%, p<0.01) and CBV (3.96 %, p<0.01) signals when averaged over the VASO visual mask (Fig.3B). The amplitude of both BOLD and VASO visual responses were not significantly modulated by CO2. (Fig 3A-B). However, across CO2 levels, time-to-peak (TTP) for BOLD visual responses was shorter than for CBV-weighted responses (BOLD=18.9s, VASO=23.5s, p<0.001) (Fig.3C).DISCUSSION:
Since we are simulating disease states by increasing CBF using hypercapnic manipulation, we expected to be prone to inflow effects even after adjusting adiabatic inversion pulse efficiency [4]. However this is not the case: independent of CO2 level, the percentage of PD voxels remained constant. We therefore conclude PD voxels are not modulated by CO2-related CBF increases. An alternative proposed explanation is venous constriction [5]. After carefully optimized registration, we see no evidence of localization of PD voxels to pial veins. The PD voxels localize to CSF, yielding higher T1 measurements, suggesting that these voxels show a paradoxical increased VASO signal due to CSF redistribution, as predicted by theoretical work [6]. This could provide an opportunity to examine movement of CSF in the brain, however, for our purposes it suggests we can safely disregard these voxels. Once PD voxels were excluded from the analysis, similar results were observed to the previous report [1]: although we saw no evidence of modulation of the amplitude of BOLD/VASO visual responses with CO2, BOLD visual responses were shorter than CBV-weighted responses.Acknowledgements
Funded by support from the Wellcome Trust [WT200804].References
[1] Venzi M, Joseph W, Steventon J, Laurentius H, Harald M, Murphy K (2018) Hypercapnic manipulation of baseline blood volume alters coupling between BOLD and CBV visual responses. ISMRM, Paris, France.
[2] Huber, Ivanov D, Handwerker DA, Marrett S, Guidi M, Uludağ K, Bandettini PA, Poser BA (2016) Techniques for blood volume fMRI with VASO: From low-resolution mapping towards sub-millimeter layer-dependent applications. Neuroimage.
[3] Federau C, Gallichan D (2016) Motion-correction enabled ultra-high resolution in-vivo 7T-MRI of the brain. PLoS One.
[4] Huber L, Ivanov D, Krieger SN, Streicher MN, Mildner T, Poser BA, Möller HE, Turner R (2014) Slab-selective, BOLD-corrected VASO at 7 tesla provides measures of cerebral blood volume reactivity with high signal-to-noise ratio. Magn. Reson. Med. 72, 137–148.
[5] Blockley NP, Driver ID, Fisher JA, Francis ST, Gowland PA (2012) Measuring venous blood volume changes during activation using hyperoxia. Neuroimage 59, 3266–3274.
[6] Donahue MJ, Lu H, Jones CK, Edden RAE, Pekar JJ, Van Zijl PCM (2006) Theoretical and experimental investigation of the VASO contrast mechanism. Magn. Reson. Med. 56, 1261–1273.
Figures