3724
Cerebral blood flow affected by the order of functional tasks1Peking-Tsinghua Center for Life Sciences, Academy for Advanced Interdisciplinary Studies, Peking University, Beijing, China, 2Center for MRI Research, Peking University, Beijing, China
Synopsis
This study investigates the order effect of functional task-induced CBF responses. ASL sequence was implemented to quantify CBF responses to the same task but in paradigms of different task orders in both the motor and visual cortices. Results of the study show an order effect in which that the greater the work load of the prior task, the greater influence it can exert on the CBF response of the posterior task. This study emphasizes the importance of the randomized task design and gives insight on underlying task-induced CBF response mechanisms.
Introduction
Arterial spin labeling (ASL) provides noninvasive and direct measurements of cerebral blood flow, is less contaminated by baseline drifting and has high repeatability. This study uses ASL to investigate that, in the subsequent functional task of a block design, how the cerebral blood flow (CBF) response of the task is affected by its prior task. The results of this study help understand the importance of randomized task design and underlying task-induced CBF response mechanisms.Method
22 healthy subjects (11 females, 20-28 years old) participated in the study. All subjects were right-handed and had normal or corrected-to-normal visions.
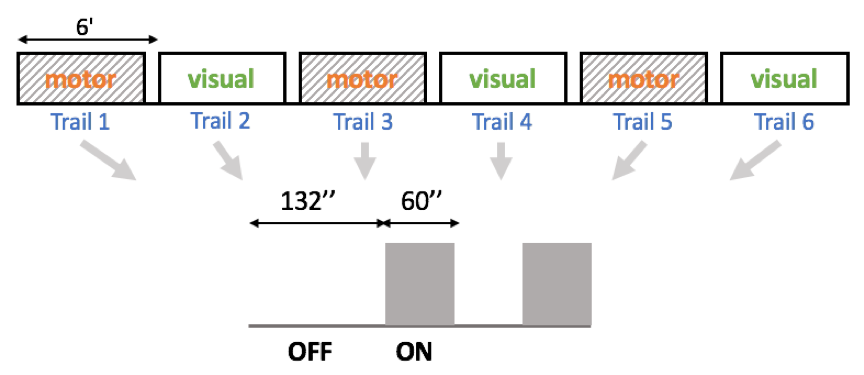
All participants underwent six task runs (illustrated by Fig. 1), each was consisted of a 132-s rest period, followed by three 60-s task-rest-task periods. Subjects performed the unilateral finger-to-thumb opposition task with their right hands during the first, third and fifth runs, and received visual stimulations during the second, fourth and sixth runs.
For a finger opposition run, the “first-task” period (from 132 to 192 second) was 0.75, 1.5 or 3 Hz—one for each run, and the “second-task” period (from 252 to 312 second) was always 1.5 Hz. In another word, subjects completed one run of 0.75-1.5 Hz, one run of 1.5-1.5 Hz, and another run of 3-1.5 Hz. Auditory instructions and metronome cues were delivered via MRI-compatible headphones.
For a visual stimulation run, similar set-up applies. Subjects completed one run of 2-4 Hz, one run of 4-4 Hz, and another run of 8-4 Hz. Subjects were presented with a white crosshair located at the center of a black background during rest periods and a flickering black-white radial checkerboard pattern during task periods.
Subjects were instructed to keep their eyes closed during all finger opposition runs and open during all visual stimulation runs.
MRI data were collected on a 3.0 T MRI system (Magnetom Prisma, Siemens, Germany), equipped with a 64-channel head coil. ASL images were collected with a PICORE(1) Q2T(2) pulsed ASL sequence. The acquisition parameters were: TR/TE=2000/12ms, TI1/TI2=700/1400ms, number of slices=10, slice thickness/interslice gap=6/1.2mm, matrix=64x64, FOV=220x220mm2, FA=90o. In addition, anatomical images with isotropic 1mm resolution were acquired using a T1-weighted MPRAGE sequence (TR/TE=2530/2.98ms).
MRI data were processed using the ASL toolbox(3) based on SPM 12 in MATLAB (MathWorks, USA). Each ASL run generated 157 volumes. The first volume was M0, and the remaining 156 volumes were 78 pairs of label-control ASL images. The first 3 label-control pairs were discarded. The rest 75 pairs were realigned for motion correction, co-registered to the corresponding anatomical images, and spatially smoothed using a Gaussian kernel with full-width-half-maximum (FWHM) of 6 mm. Subsequently, surround subtraction of the control and label images(4) was carried out to generate the perfusion-weighted images, which, combined with M0, gave the absolute CBF measurement at each voxel according to the equation described in (5). A general linear model was used to identify functionally activated voxels, where p < 0.001 was considered statistically significant. Region of interest was defined as the voxels which were commonly activated for all of the finger opposition runs (or visual stimulation runs). Task-induced CBF responses were estimated.
Results
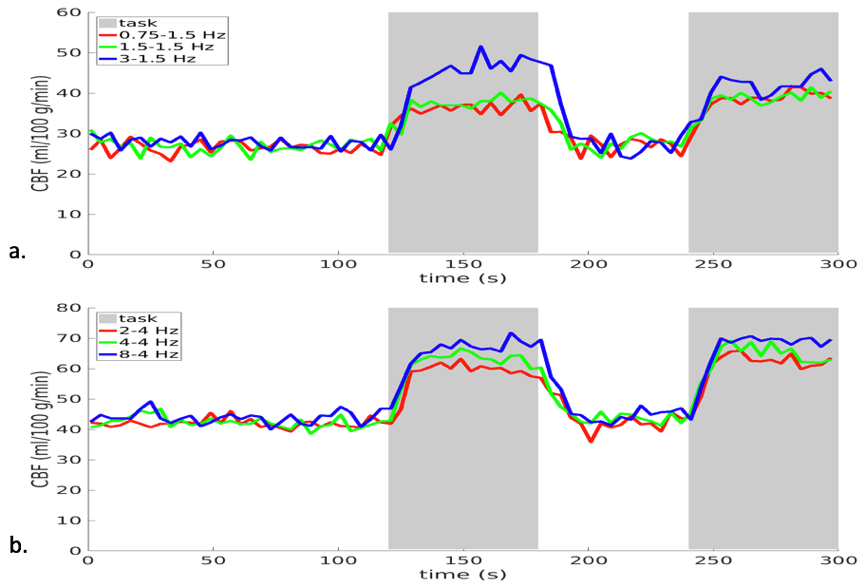
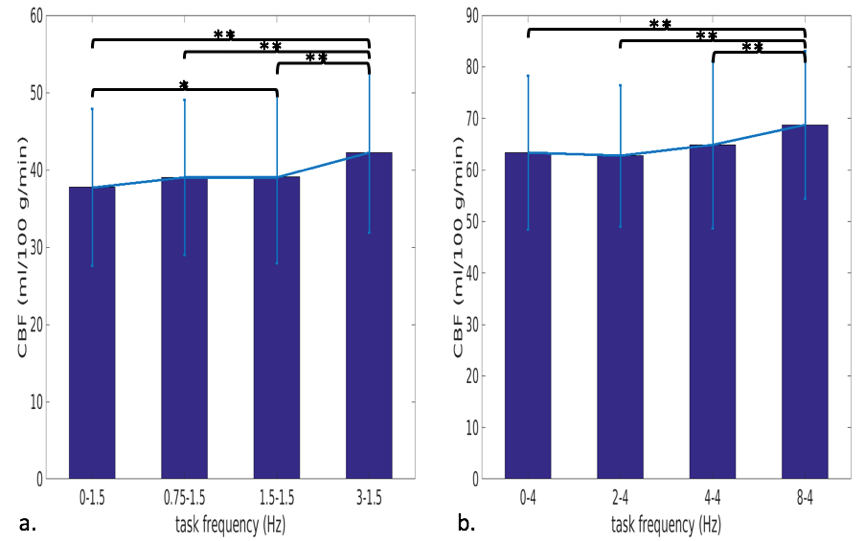
Average time courses of the finger opposition runs (Fig. 2a) and the visual stimulation runs (Fig. 2b) are displayed. During the “first-task” period, CBF increases with stimulus frequencies as expected. During the “second-task” period, however, the CBF response of the 3-1.5 Hz run is greater than that of the 1.5-1.5 Hz run, which is further greater than the 0.75-1.5 Hz run, despite the fact that they are all induced by finger opposition at 1.5 Hz. Figure 3a compares the CBF responses induced by finger opposition at 1.5 Hz at four different conditions (0-1.5, 0.75-1.5, 1.5-1.5 and 3-1.5 Hz). Significant differences were found between the 3-1.5 Hz run and all other runs, and between the 1.5-15 Hz run and the 0-1.5 Hz run. Similar patterns are seen in the visual stimulation runs (Fig 2b and 3b).Discussion and conclusions
Our results show that task-induced CBF responses have order effects in both motor and visual cortices. The greater the work load of the prior task, the greater influence it can exert on the posterior task. Resting of one minute between task blocks, although longer than a canonical hemodynamic response function (HRF, 32-s), seems not long enough if one hopes to avoid the contamination of this order effect. Balance of the order effect by a randomized task design should help the interpretation of experiment results.Acknowledgements
No acknowledgement found.References
1. Wong EC, Buxton RB, Frank LR. Implementation of Quantitative Perfusion Imaging Techniques for Functional Brain Mapping using Pulsed Arterial Spin Labeling. NMR in Biomedicine [Internet] 1997;10:237–249.
2. Luh WM, Wong EC, Bandettini PA, Hyde JS. QUIPSS II with thin-slice TI1 periodic saturation: A method for improving accuracy of quantitative perfusion imaging using pulsed arterial spin labeling. Magn Reson Med 1999;41:1246–1254.
3. Wang Z, Aguirre GK, Rao H, Wang J, Fernandez-Seara MA, Childress AR, Detre JA. Empirical optimization of ASL data analysis using an ASL data processing toolbox: ASLtbx. Magn Reson Imaging 2008;26:261–269.
4. Liu TT, Wong EC. A signal processing model for arterial spin labeling functional MRI. NeuroImage 2005;24:207–215.
5. Alsop DC, Detre JA, Golay X, et al. Recommended implementation of arterial spin-labeled perfusion MRI for clinical applications: A consensus of the ISMRM perfusion study group and the European consortium for ASL in dementia. 2014;73:102–116.
Figures