3723
Voxel-wise analysis of functional MRI activation in regions of provoked impaired cerebrovascular reactivity: a translational model1University Hospital Zurich, Zurich, Switzerland, 2University of Toronto, Toronto, ON, Canada
Synopsis
A voxel-wise investigation of the relationship between the cerebrovascular reactivity (BOLD-CVR) alteration and the task-evoked Blood-oxygenation-level dependent functional MRI (BOLD-fMRI) challenges the commonly accepted linear and global correction method used. Our controlled CVR modulation in healthy subjects is a good investigation translational model for patients affected with glioblastomas or stroke.
INTRODUCTION
Task-evoked Blood-oxygenation-level dependent functional MRI (BOLD-fMRI) signal activation is widely used to interrogate eloquence of brain areas. However, data interpretation can be improved, especially in regions with absent BOLD-fMRI signal activation. Absent BOLD-fMRI signal activation may actually represent false-negative activation due to a) increased temporal noise or b) impaired cerebrovascular reactivity (BOLD-CVR) of the vascular bed. Point b is of crucial importance in patients with glioblastoma or stroke, which have impaired CVR.1,2 Further investigation is needed for a correct clinical readout of the functional MRI data. Nevertheless, the relationship between impaired BOLD-CVR and BOLD-fMRI signal activation may be better studied in healthy subjects where neurovascular coupling is known to be intact. Therefore, we artificially decreased the CVR in a controlled way in a healthy population to investigate on a voxel-wise basis the relationship between abnormal CVR and BOLD signals, challenging commonly used linear models.3METHODS
Using a model-based prospective end-tidal carbon dioxide (CO2) targeting algorithm, we performed two controlled BOLD-CVR studies on 17 healthy subjects: 1: at the subjects’ individual resting end-tidal CO2 baseline. 2: Around +6.0 mmHg CO2 above the subjects’ individual resting baseline. Two BOLD-fMRI finger-tapping experiments were performed at similar normo- and hypercapnic levels. MRI data were obtained on a 3 Tesla MRI with a 32-channel head coil.
Acquisition parameters used for both BOLD-CVR and task-evoked BOLD-fMRI consisted of axial two-dimensional single-shot EPI GE sequence voxel size 3×3×3 mm3, acquisition matrix 64x64x35, GRAPPA factor 2, repetition time (TR)/ echo time (TE) 2000/30 ms, flip angle 85°, bandwidth 2368 Hz/Px, Field of View 192x192 mm2. For every subject, we obtained 200 volumes during the CVR study and 135 volumes during the fMRI task-evoked study. An optimized4 three-dimensional (3D) T1-weighted Magnetization Prepared Rapid Acquisition Gradient Echo (MPRAGE) volume was also acquired with the same orientation as the fMRI scans for overlay purposes: voxel size0.8×0.8×1.0 mm3 with a field of view 230x230x176 mm3 and scan matrix of 288x288x176, TR/TE/TI 2200/5/900 ms, flip angle 8°.
CVR was determined using an iterative temporal decomposition algorithm considering the transient phases of the vascular response.5
Relative BOLD fMRI signal activation and t-values were calculated for BOLD-CVR and BOLD-fMRI data. For each component of the cerebral motor-network (precentral gyrus, postcentral gyrus, supplementary motor area, cerebellum und fronto-operculum), the correlation between BOLD-CVR and BOLD-fMRI signal changes and their respective t-values was investigated.
Finally, a voxel-wise quantitative analysis of the impact of BOLD-CVR on BOLD-fMRI was performed.
RESULTS
For the motor-network, the linear correlation coefficient between BOLD-CVR and BOLD-fMRI t-values were significant (p<0.01) and in the range 0.33-0.55, similar to the correlations between the CVR and fMRI ∆%signal (p<0.05; range 0.34-0.60). Nevertheless, the linear relationship between CVR and fMRI is challenged by our voxel-wise analysis of ∆%signal and t-value change between normo- and hypercapnia. Indeed, our voxel-wise analysis shows that the linear relationship holds only for the voxel with a supra maximal task activation where the vascularization limits the BOLD signal. For the other voxels, the task-evoked fMRI signal is independent of the CVR, therefore a voxel-wise – as opposed to a global or even ROI-wise – correction/calibration of the BOLD signal is necessary to remove the confound of inhomogeneous CVR over the brain.DISCUSSION & CONCLUSION
Our main finding is that BOLD fMRI signal activation maps are markedly dampened only in voxels that present an impaired BOLD-CVR. Further, we highlight the importance of a complementary BOLD-CVR assessment in addition to a task-evoked BOLD fMRI to identify brain areas at risk for false-negative BOLD-fMRI signal activation and, eventually, to correct for the vascular filter overlaid on the neuronal activation of interest.Acknowledgements
We would like to express our special gratitude to Dr James Duffin, professor emeritus of the University of Toronto, for his help on and critical review of this manuscript.References
1. J Fierstra, C van Niftrik, M Piccirelli, et
al. Diffuse gliomas
exhibit whole brain impaired cerebrovascular reactivity. Magnetic resonance
imaging 2018; 45, 78-83.
2. M Sebök, CHB van Niftrik, M
Piccirelli, et al. BOLD cerebrovascular reactivity as a novel marker for
crossed cerebellar diaschisis. Neurology 2018; 91 (14), e1328-e1337.
3. CHB van Niftrik, M Piccirelli, et
al. Impact of baseline CO2 on Blood-Oxygenation-Level-Dependent MRI
measurements of cerebrovascular reactivity and task-evoked signal activation. Magnetic
resonance imaging 2018; 49, 123-130.
4. N Aldusary, L Michels, M Piccirelli,
et al. Lateral geniculate nucleus volumetry at 3T and 7T: Four different
optimized magnetic-resonance-imaging sequences evaluated against a 7T reference
acquisition. NeuroImage 2018
5. CHB van Niftrik, M Piccirelli, et
al. Iterative analysis of cerebrovascular reactivity dynamic response by
temporal decomposition. Brain and behavior 2017; 7 (9), e00705
Figures
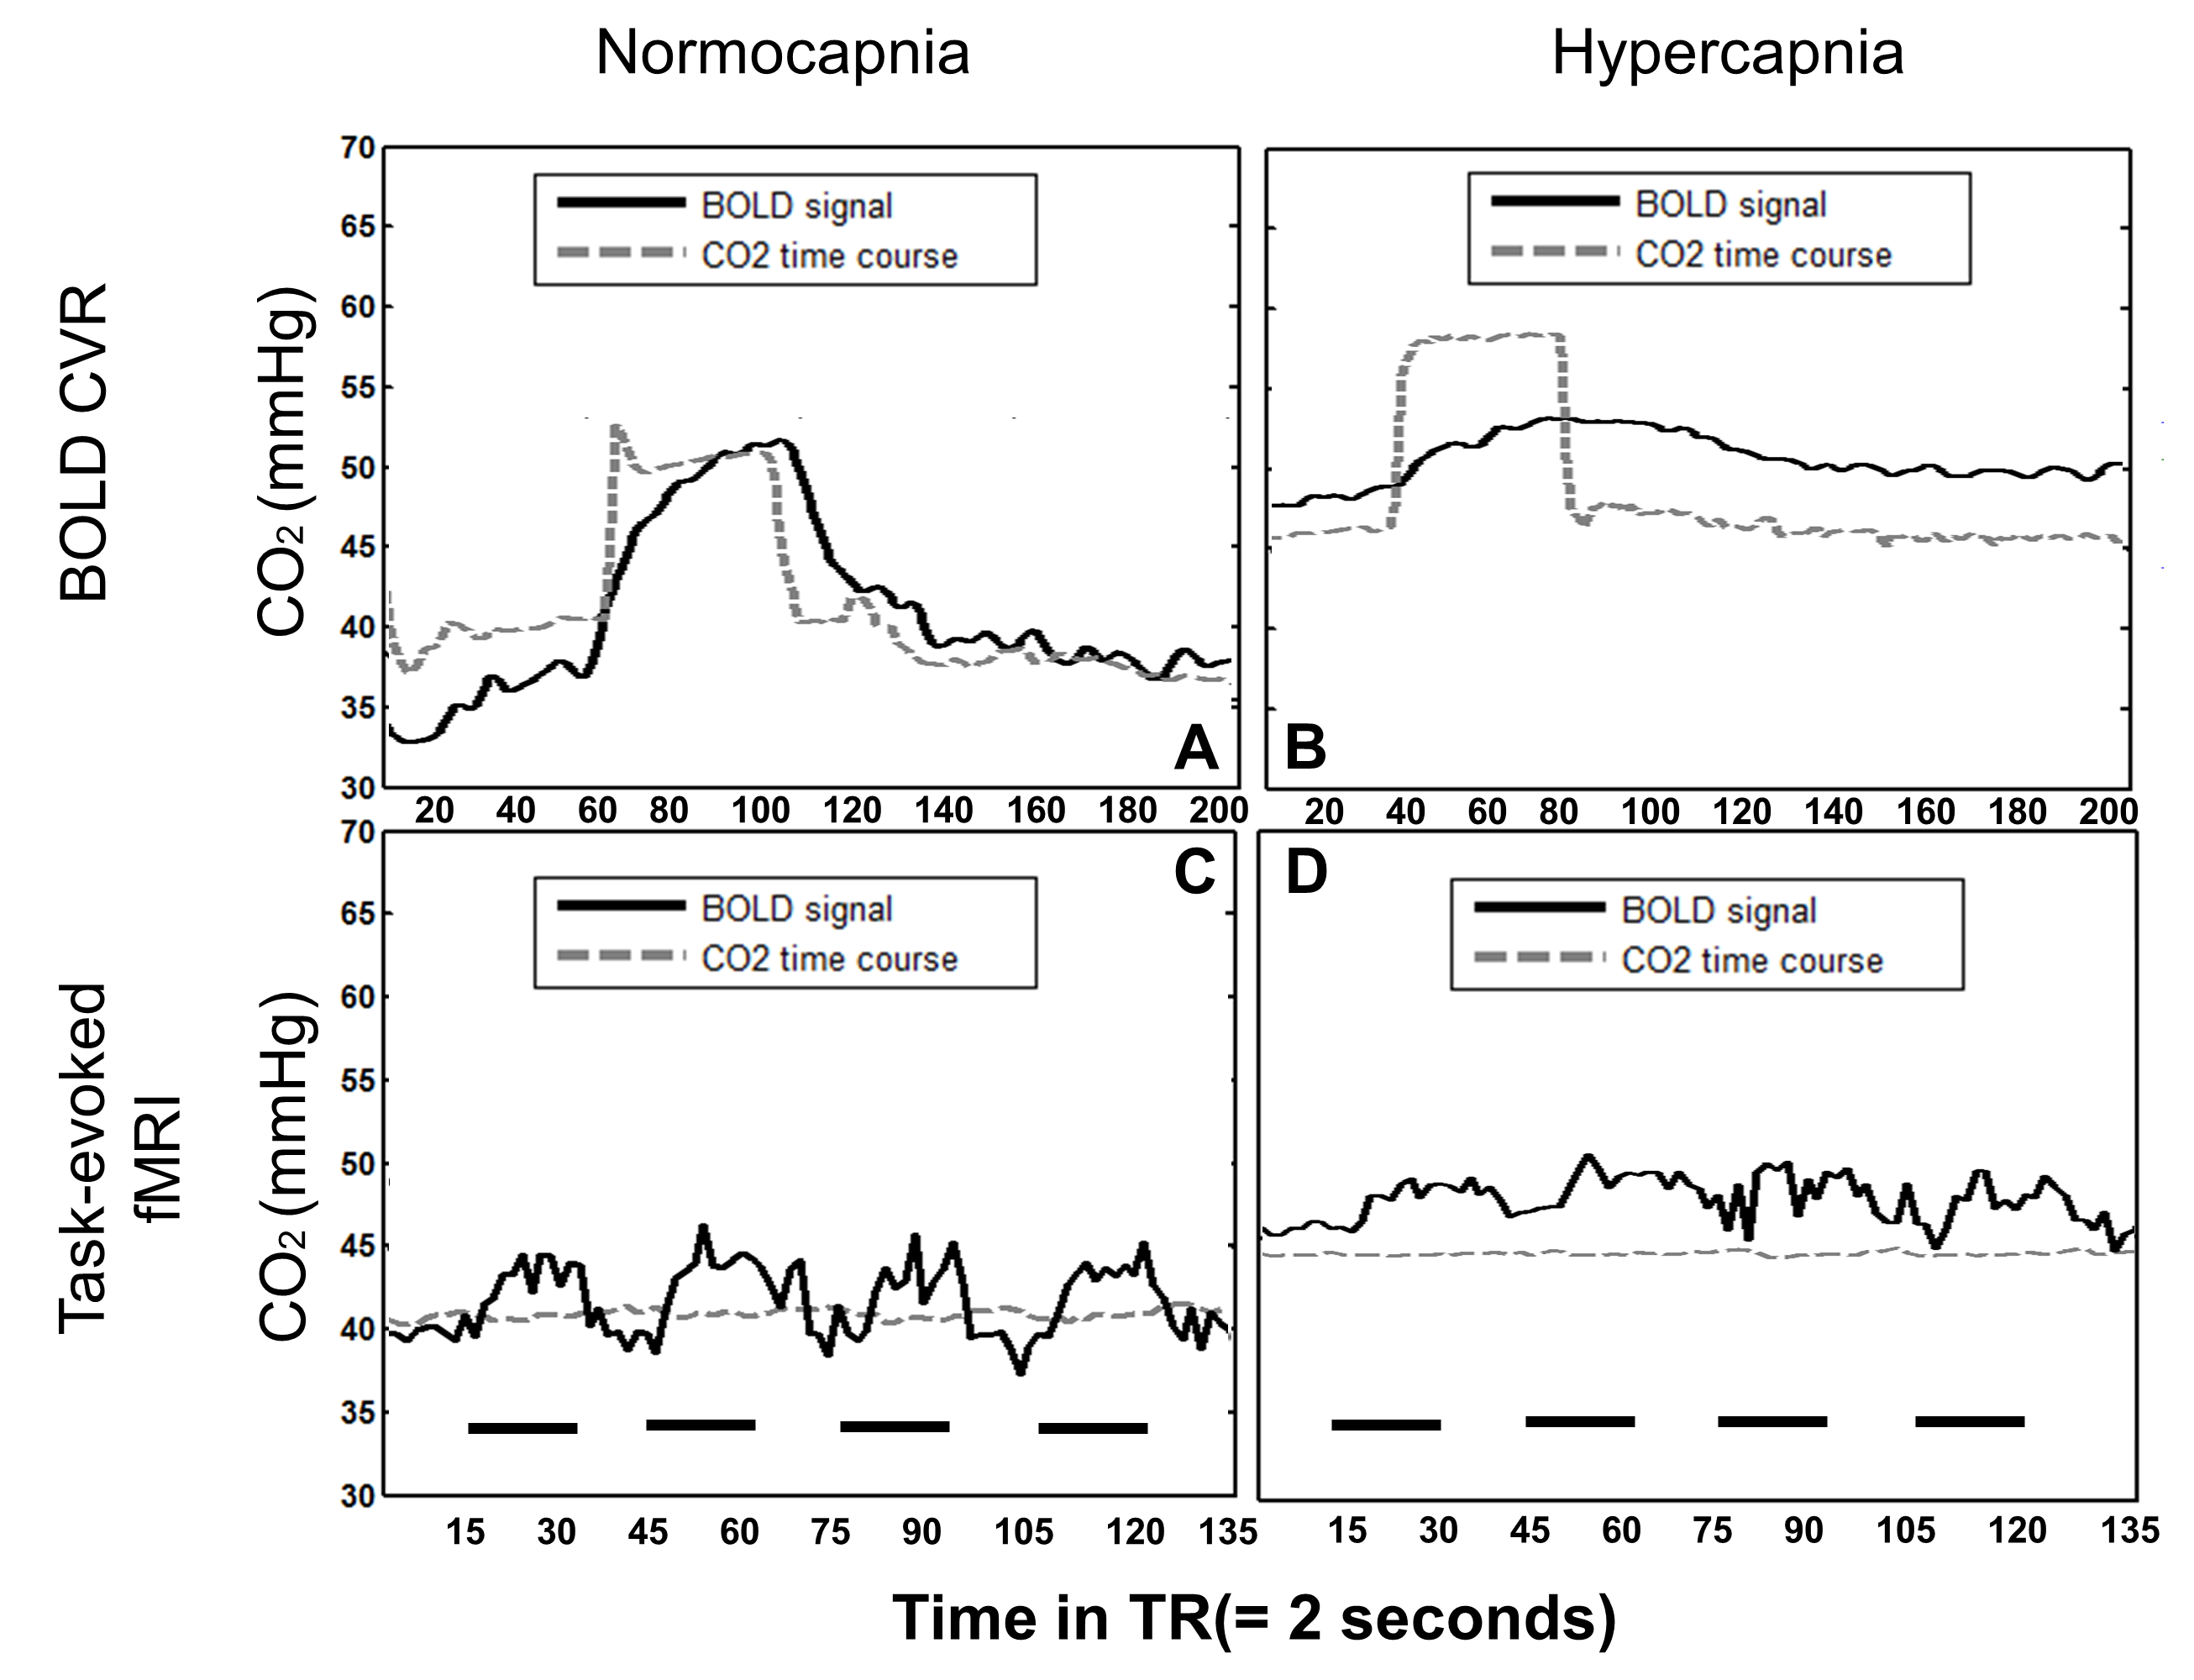
Figure 1: Combined BOLD-CVR and task-evoked BOLD-fMRI study protocol in one subject. Figures1A/B show the CO2 (grey dotted line) and mean BOLD signal time course (black line) during a BOLD-CVR study at CO2 baseline (A) versus hypercapnia (B), respectively. Note that the BOLD signal follows the CO2 increase from normocapnia and quickly returns to baseline levels. However, during hypercapnia, the mean BOLD signal increase due to CO2 rise is less than in normocapnia.
Bottom: Figures1-C/D show the CO2 time course during a task-evoked BOLD-fMRI block protocol. The black short lines represent the task phase of the protocol. The controlled CO2 method produced constant CO2 levels.
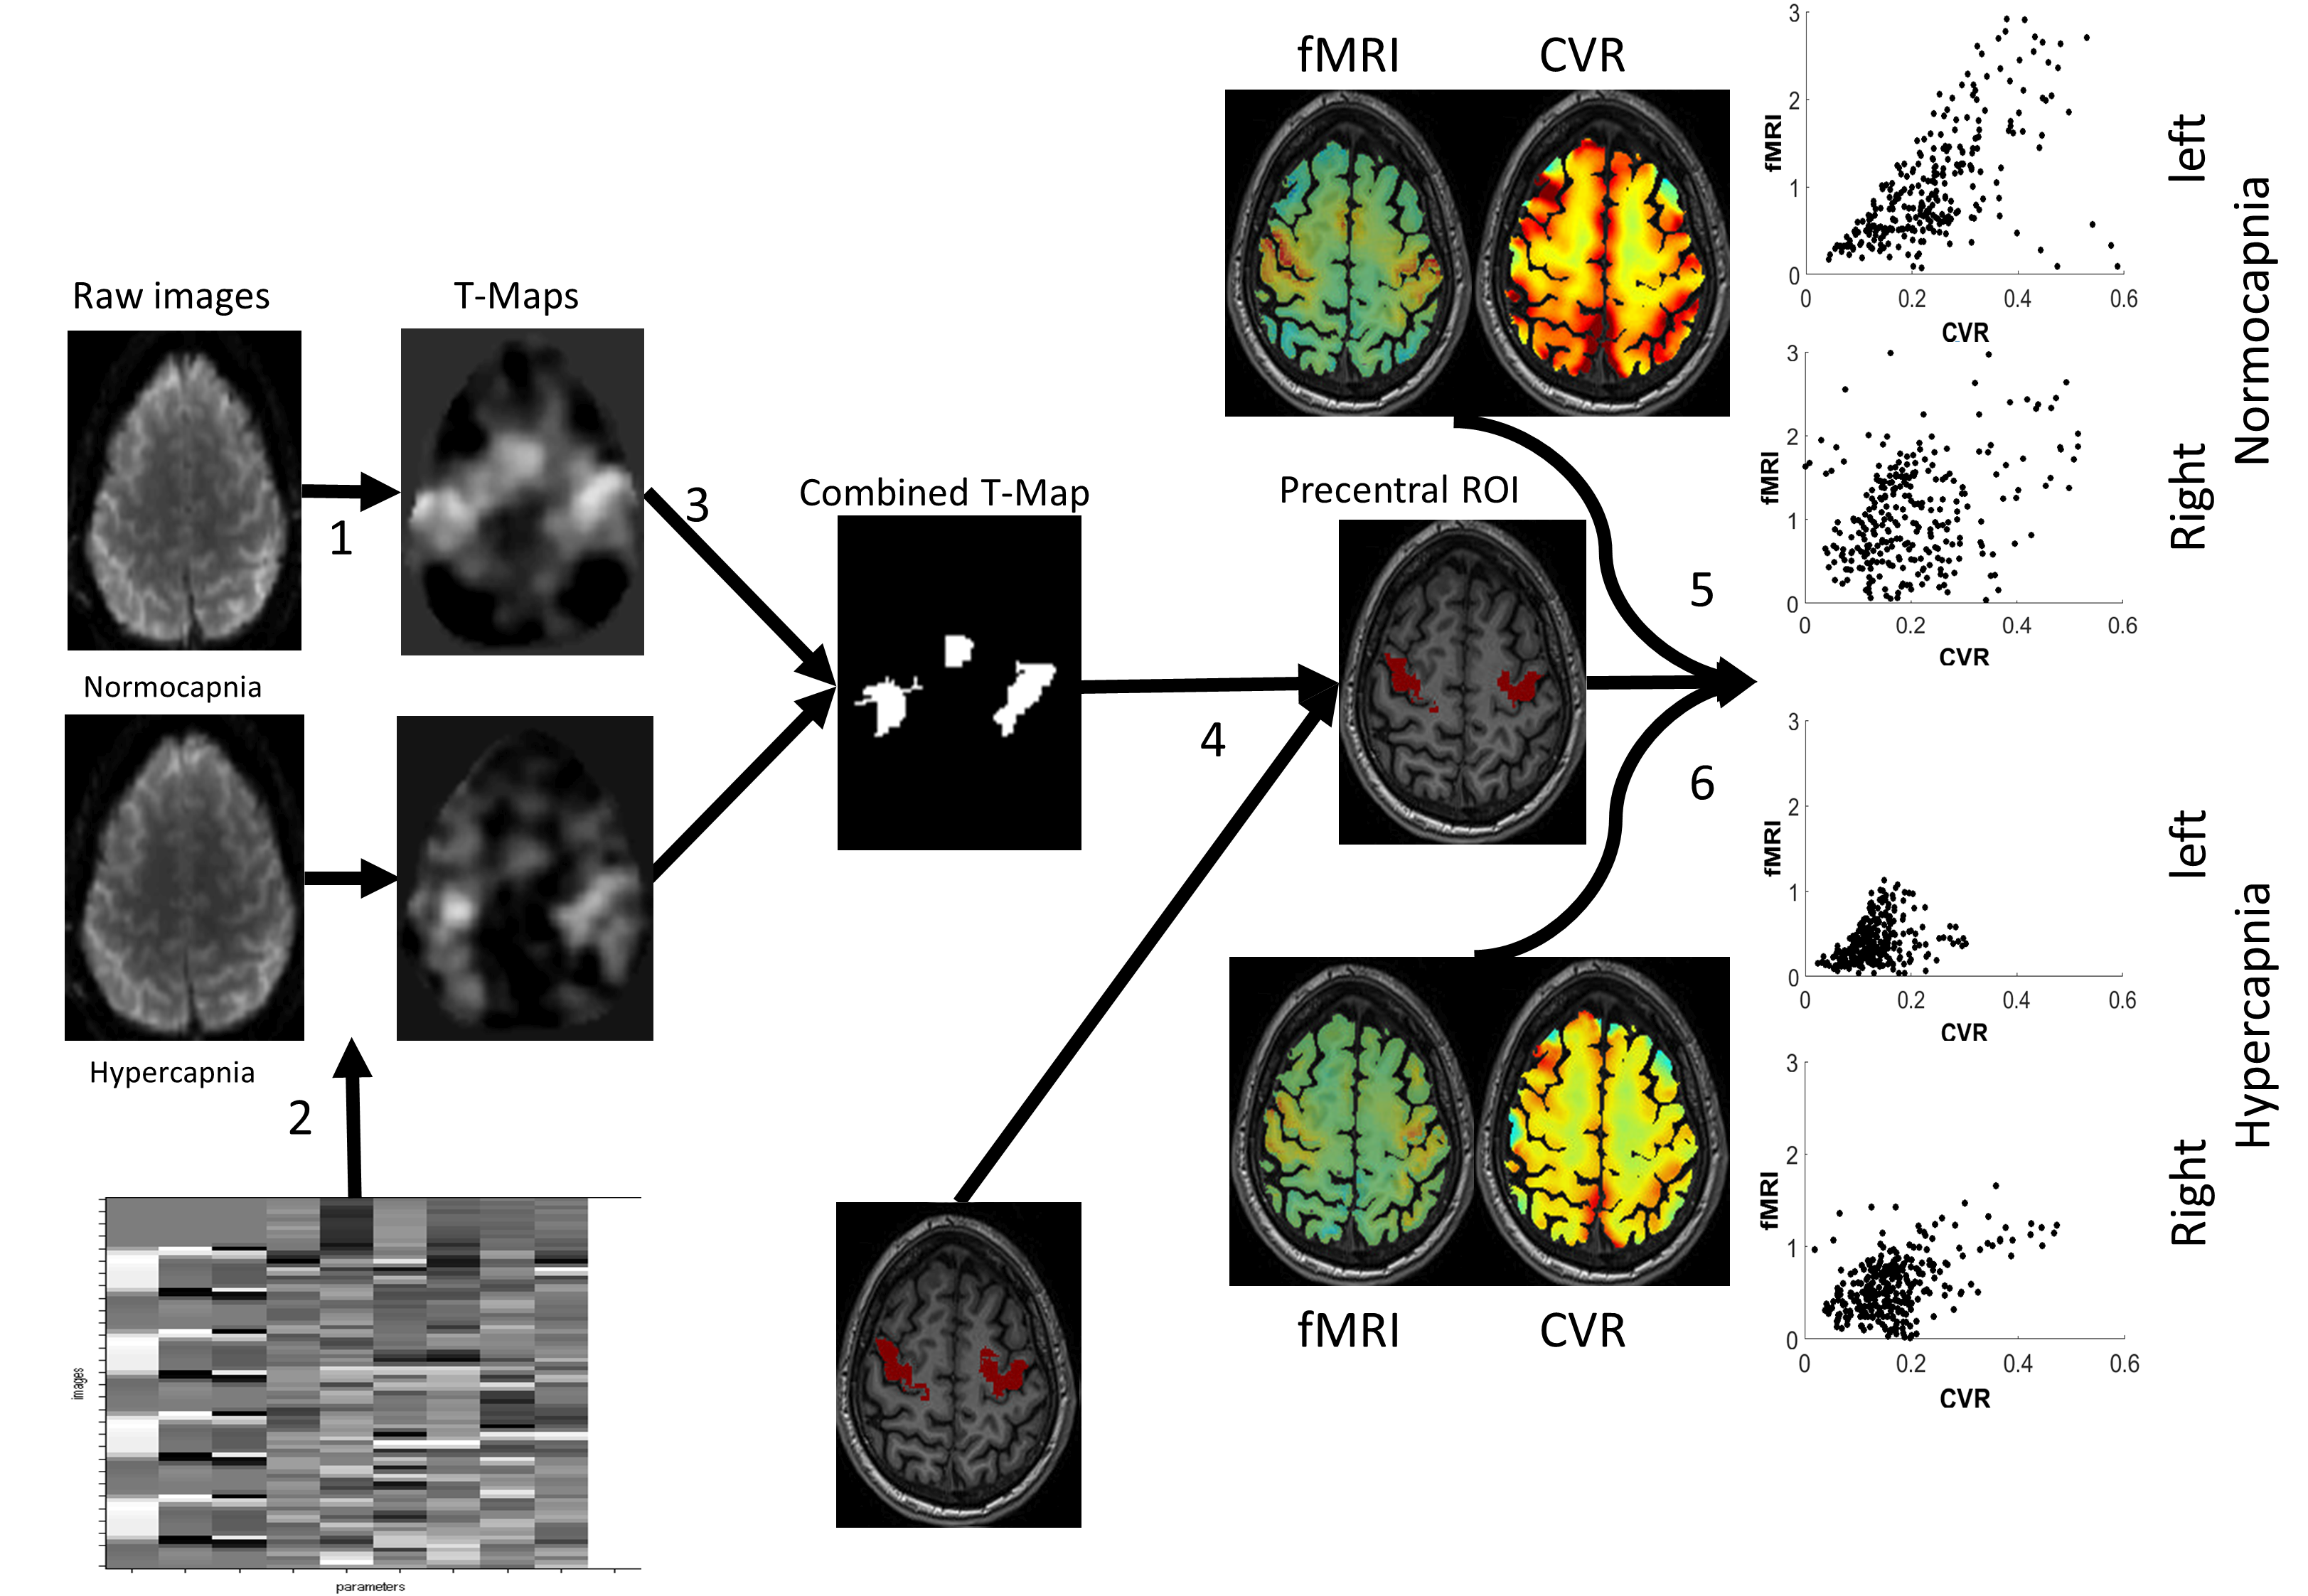
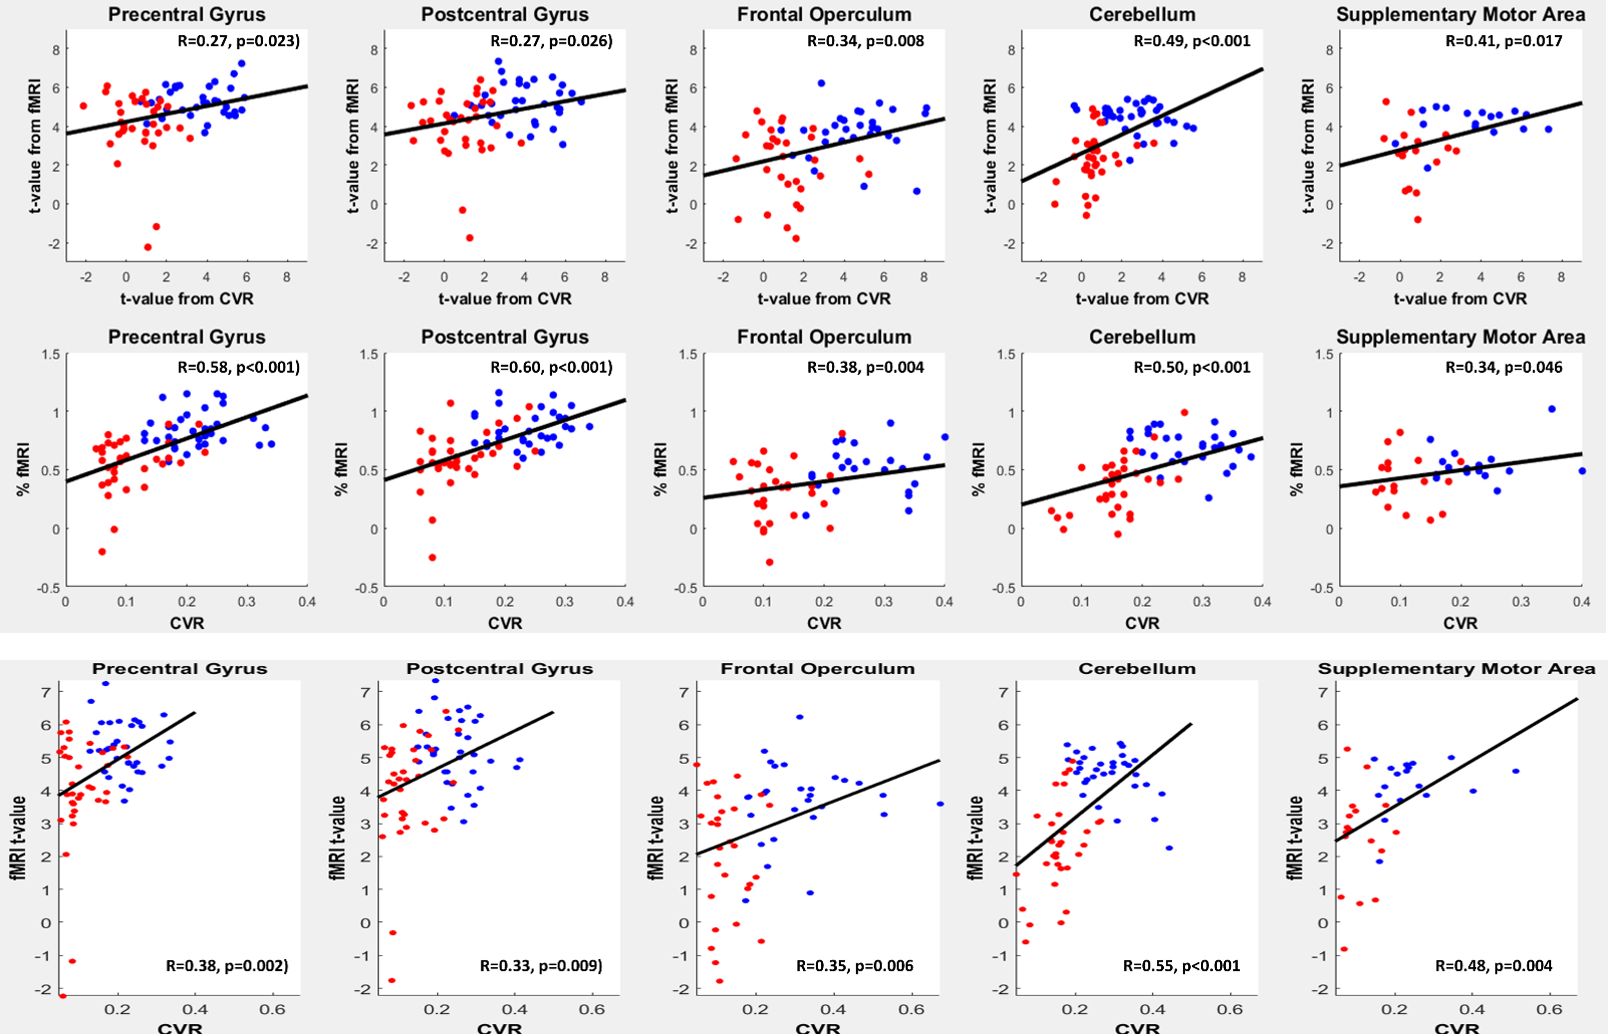
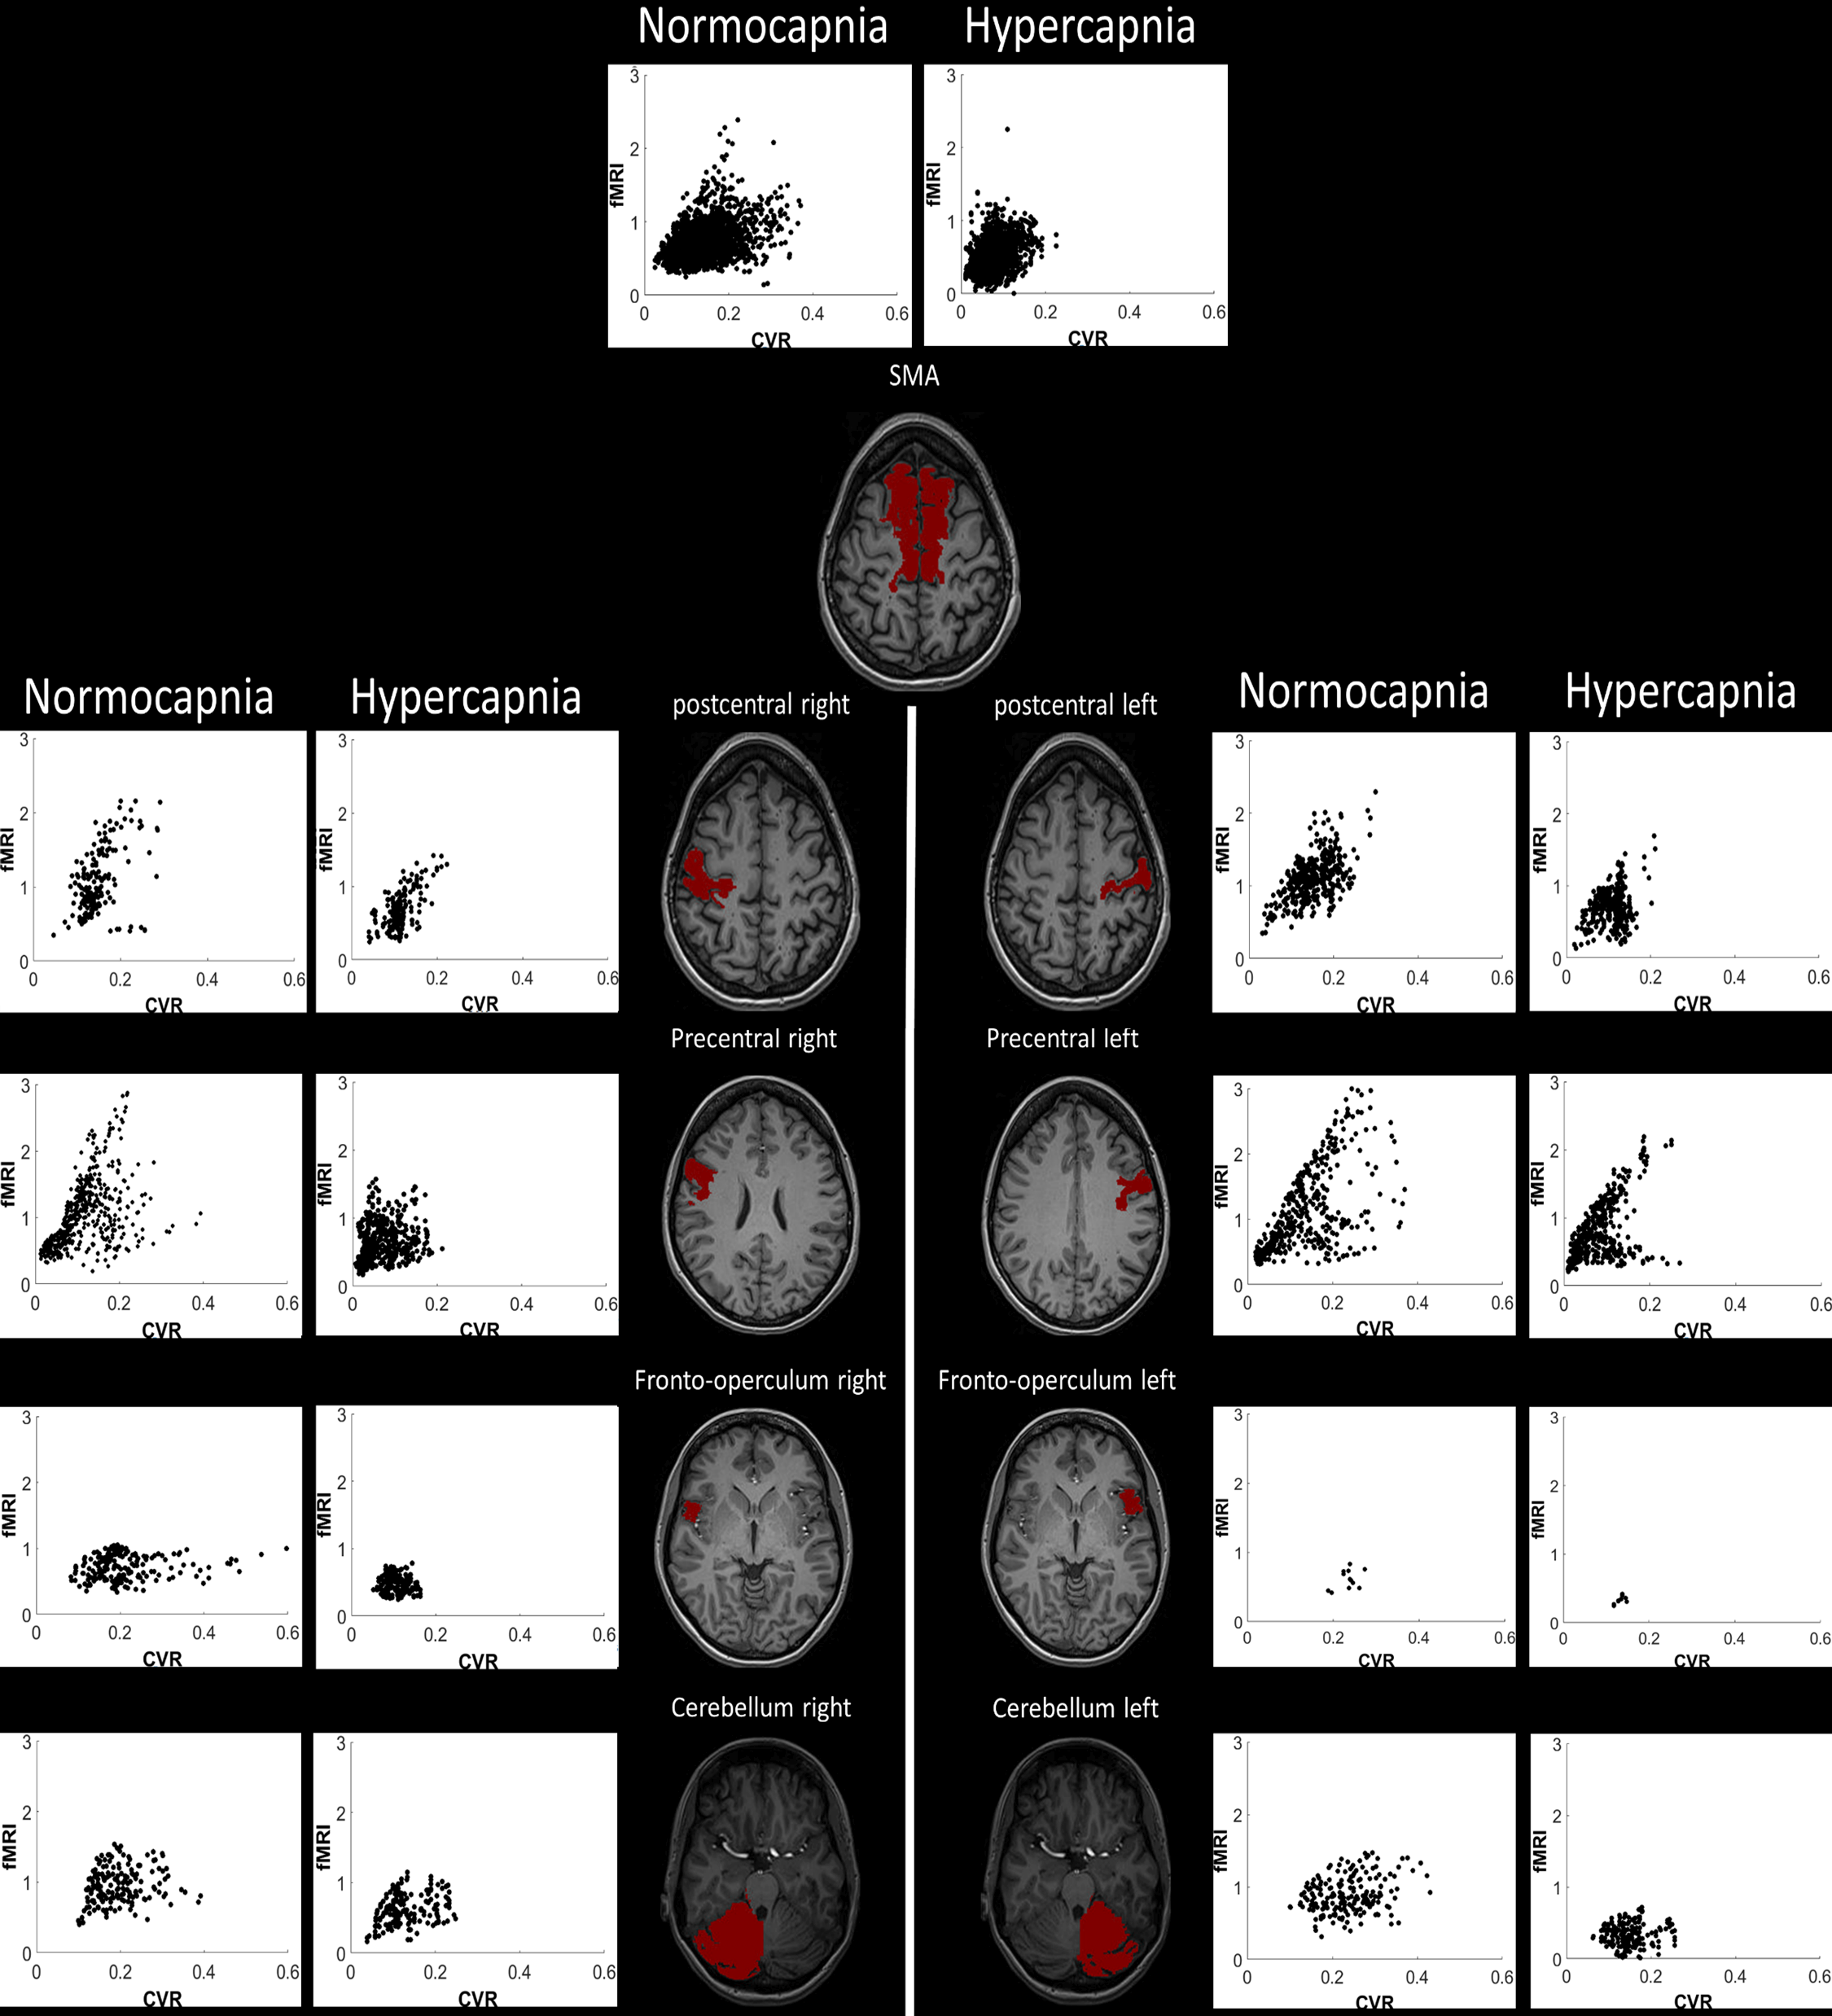
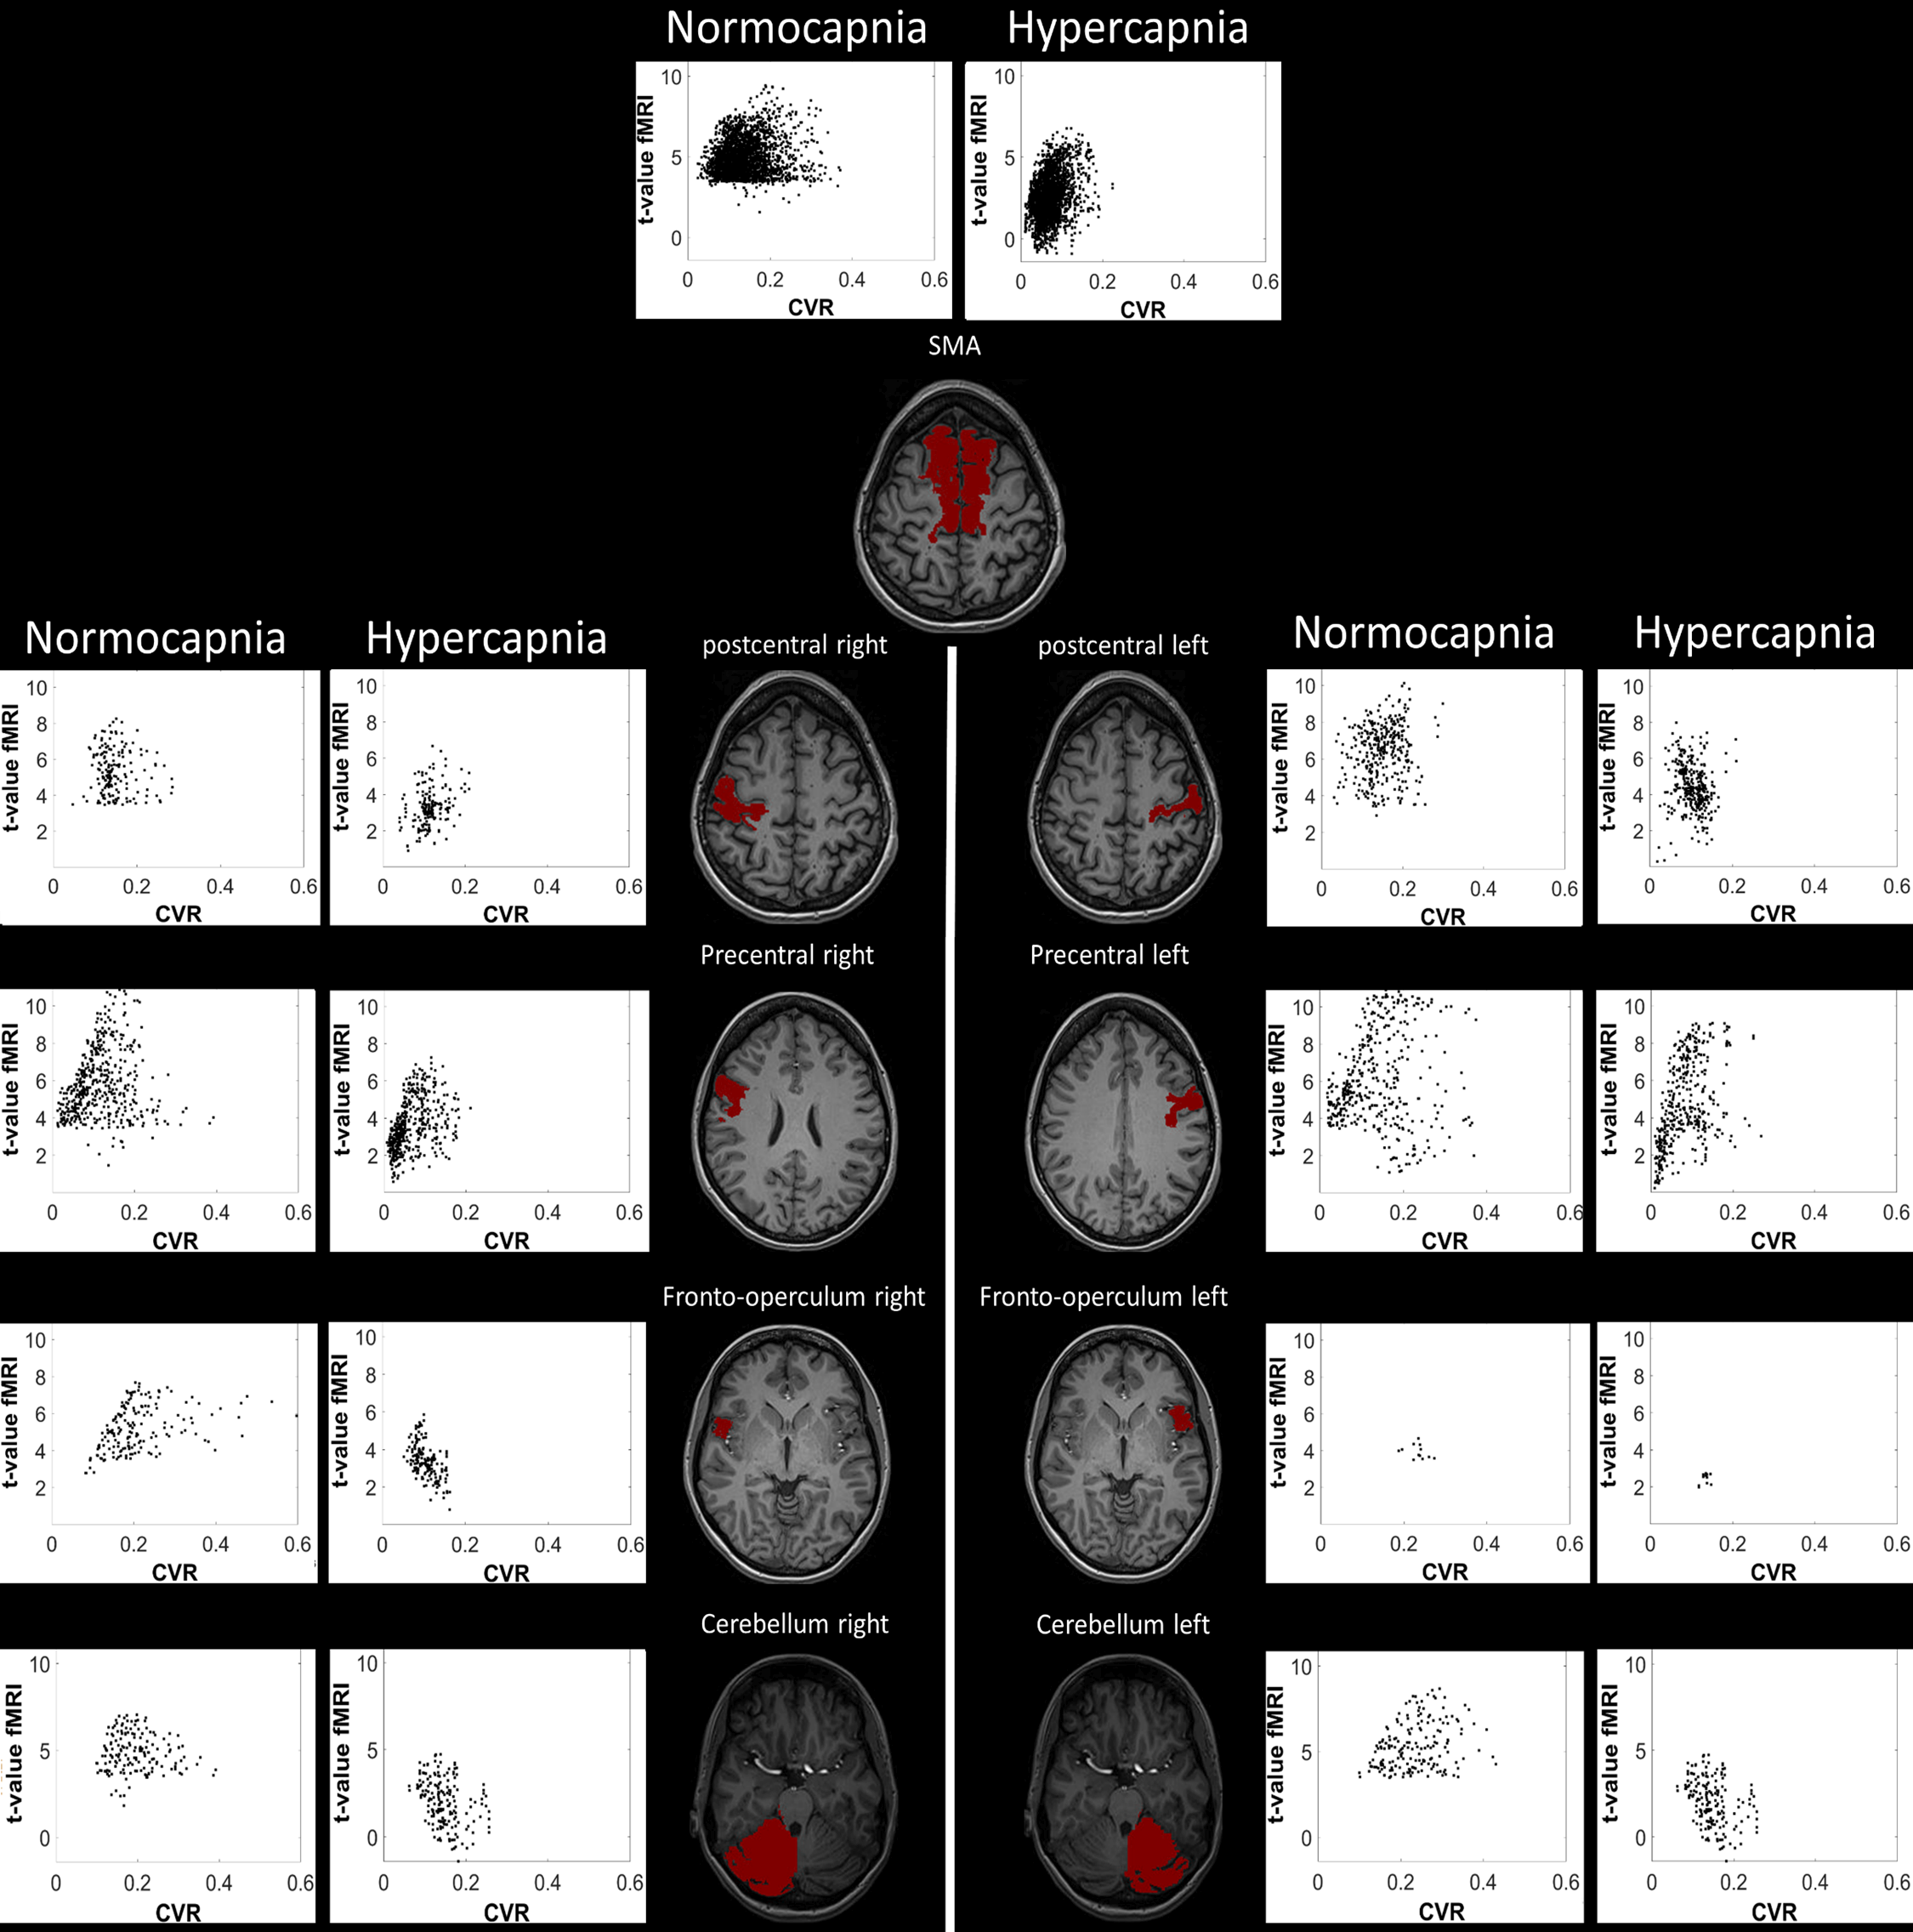
Figure3-top: Scatterplot of CVR and finger-tapping t-values. Lower row: Scatterplot of CVR and %fMRI for each ROI and subject. Each red and blue point represents the value for each ROI averaged for each subject. Blue points represent normocapnia, while red points hypercapnia. Black line: linear fit.
Figure3-bottom: The fMRI t-values are represented in function of the CVR (relative signal change per mmHg CO2). Each red and blue point represents the mean ROI value for each subject and side. Blue points represent normocapnia, while red points represent hypercapnia. Black line: least square error linear fit of each scatterplot. %fMRI: mean percent BOLD signal change