3722
Amplitude of low-frequency fluctuations in resting-state BOLD-fMRI is associated with cognitive decline in cerebral small vessel disease1ISR-Lisboa/LARSyS and Department of Bioengineering, Instituto Superior Técnico – Universidade de Lisboa, Lisboa, Portugal, 2Neurology Department, Hospital Egas Moniz, Centro Hospitalar de Lisboa Ocidental, Lisboa, Portugal, 3CEDOC - Nova Medical School, New University of Lisbon, Lisboa, Portugal, 4Faculdade de Medicina, Universidade de Lisboa, Lisboa, Portugal, 5Imaging Department, Hospital da Luz, Lisboa, Portugal
Synopsis
Cerebral small vessel disease (SVD) is a major vascular contributor to dementia and stroke, being associated with age-related cognitive decline. In this work, we aim to assess the potential of spontaneous BOLD fluctuations metrics to predict cognitive impairment in a group of SVD patients, therefore providing sensitive SVD biomarkers. The amplitude of low-frequency fluctuations (ALFF) and fractional ALFF (fALFF) were computed in four different frequency bands as metrics of spontaneous BOLD signal fluctuations. Results from multiple linear regression analyses demonstrated that spontaneous BOLD fluctuations metrics contribute to the prediction of cognitive impairment in executive function, processing speed and working memory.
Introduction
Cerebral small vessel disease (SVD) includes all pathological processes affecting small caliber vessels in the brain, and is implicated in age-related cognitive decline1. Measures reflecting cerebrovascular changes have been increasingly sought as SVD biomarkers that might precede structural lesions and help predict disease progression2. Interestingly, one study showed that the amplitude of spontaneous BOLD fluctuations measured by resting-state fMRI was increased in the normal appearing white matter (NAWM) of SVD patients compared with age-matched healthy controls, which were consistent with increased cardiac pulsatility3. Here, we investigated whether the amplitude of low-frequency fluctuations (ALFF) in resting-state BOLD-fMRI were predictive of cognitive impairment in SVD.Materials and Methods
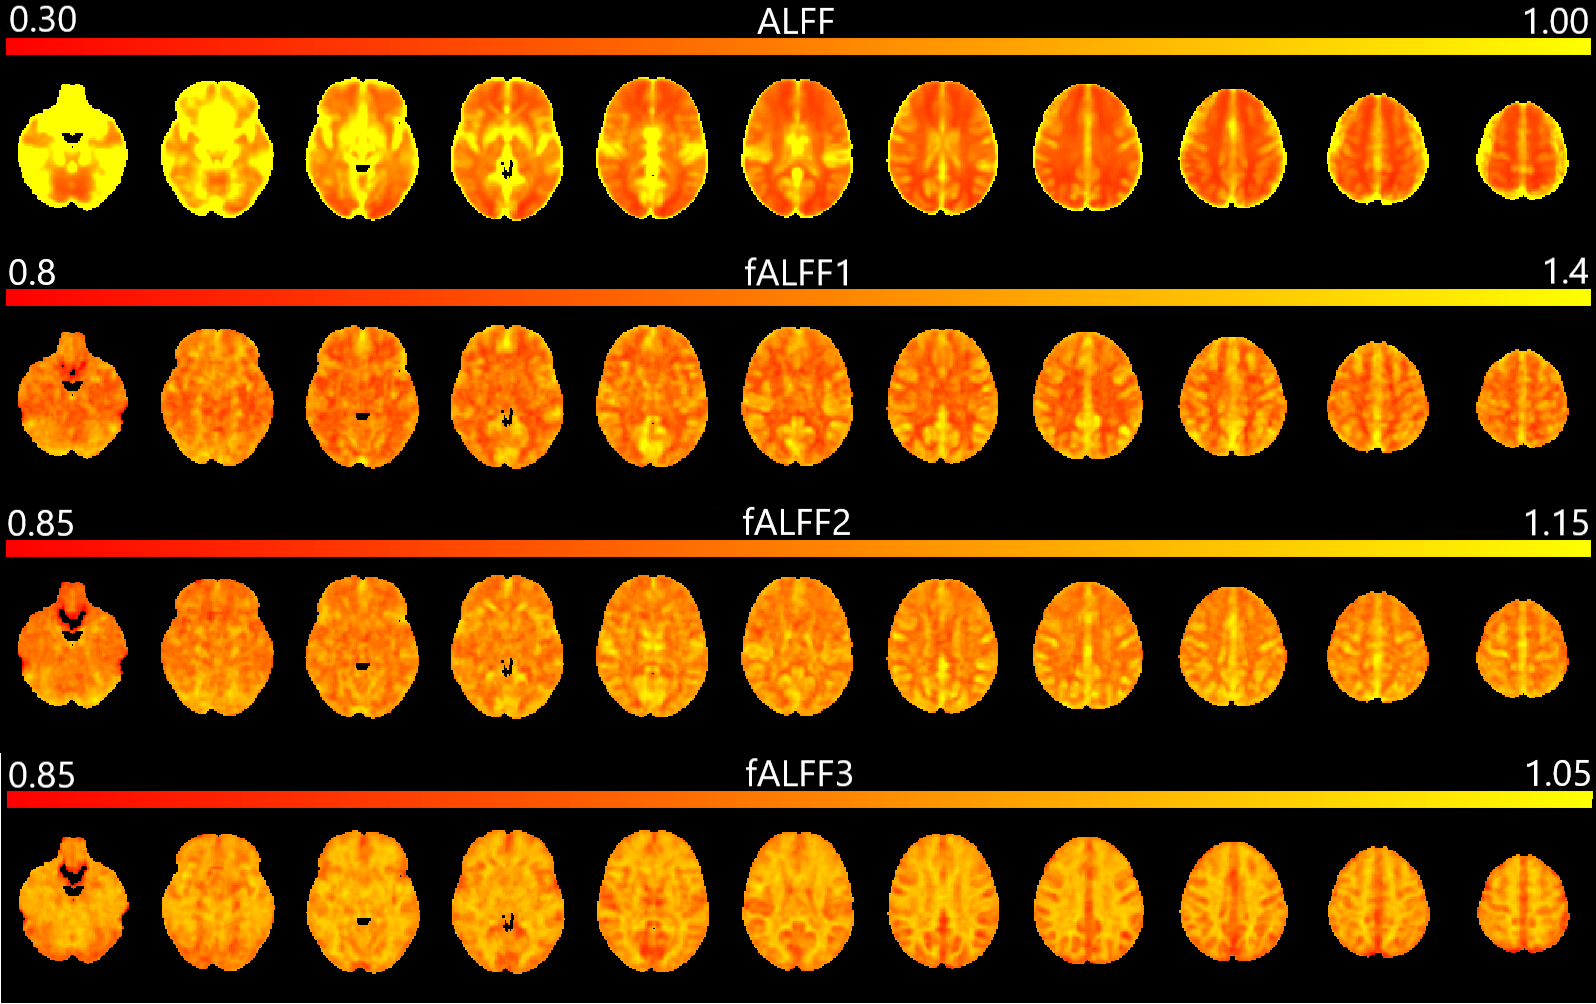
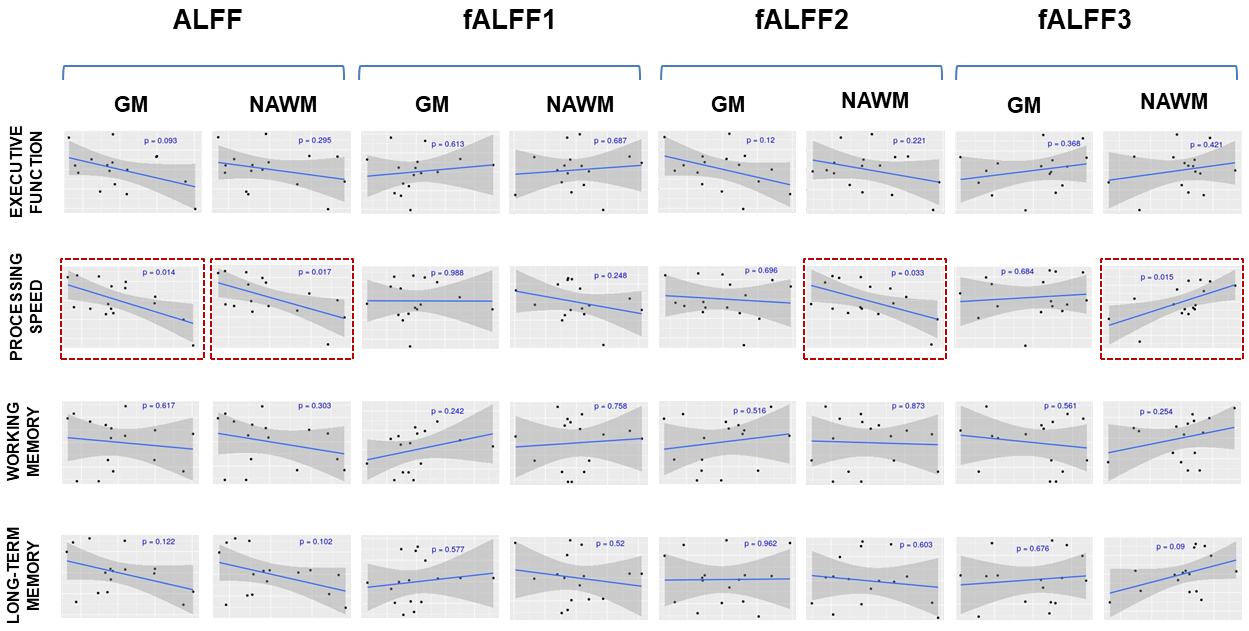
A group of 11 patients with sporadic SVD (sSVD) (52±7 yrs) and 6 patients with CADASIL (47±11 yrs) was studied on a 3T Siemens scanner, including: T1-weigthed MPRAGE (1mm isotropic), T2-weighted FLAIR (0.7x0.7x3.3mm3), and ~6.5min resting-state BOLD-fMRI (2D GE-EPI, TR/TE=2500/30ms, 3.5x3.5x3.0mm3). Data were analyzed using FSL (https://fsl.fmrib.ox.ac.uk/fsl), ANTs (http://stnava.github.io/ANTs/), MATLAB (R2016b), and R software. BOLD fMRI pre-processing steps included: fieldmap unwarping for correction for EPI distortions, motion correction, spatial smoothing (FWHM=5mm) and regression of motion parameters and a second order polynomial for removal of low-frequency drifts. The following ALFF and fractional ALFF (fALFF) (obtained by normalizing ALFF by the total power across the detectable frequency range, 0-0.2Hz) metrics were computed in specific frequency bands4: ALFF (0.01-0.10Hz), fALFF1 (0.010-0.023Hz), fALFF2 (0.023-0.073Hz) and fALFF3 (0.073-0.20Hz). For each metric, voxelwise maps were derived and average values were calculated across gray matter (GM) and NAWM ROIs obtained by segmentation of the structural images, resulting in 8 metrics. SVD patients were evaluated in 4 cognitive domains using a battery of neuropsychological tests: Stroop and Trail Making Test Part B, for executive function; Trail Making Test Part A, for processing speed; WAIS-III Digit Span, for working memory; and WMS-III, for long-term memory. The Pearson correlation was computed between each of the 8 metrics of interest and the normalized score of each of the 4 cognitive domains. The Pearson correlation was also computed between the 8 metrics of interest and the following demographic and structural imaging covariates: age, normalized brain volume (nBV) and normalized white matter hyperintensity lesion volume (nLV). Multiple linear regression (MLR) models of the cognitive scores were then estimated using stepwise analysis including the metrics that demonstrated significant correlations with cognitive scores as well as the demographic and structural covariates.Results
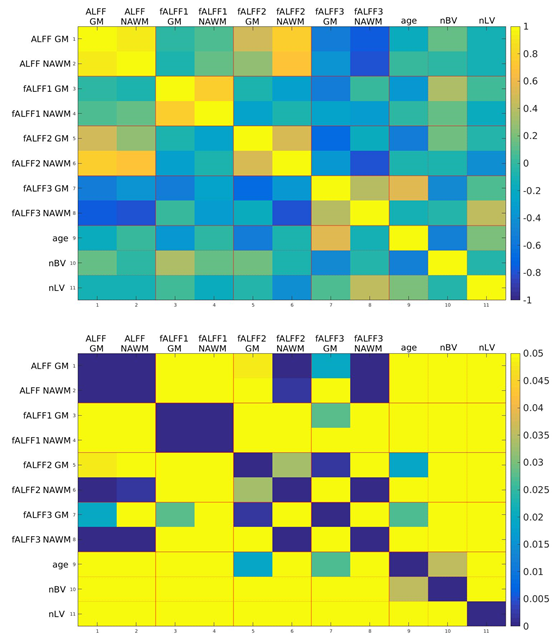
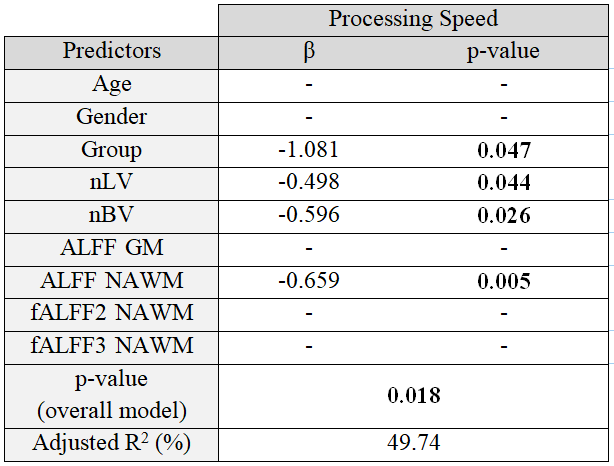
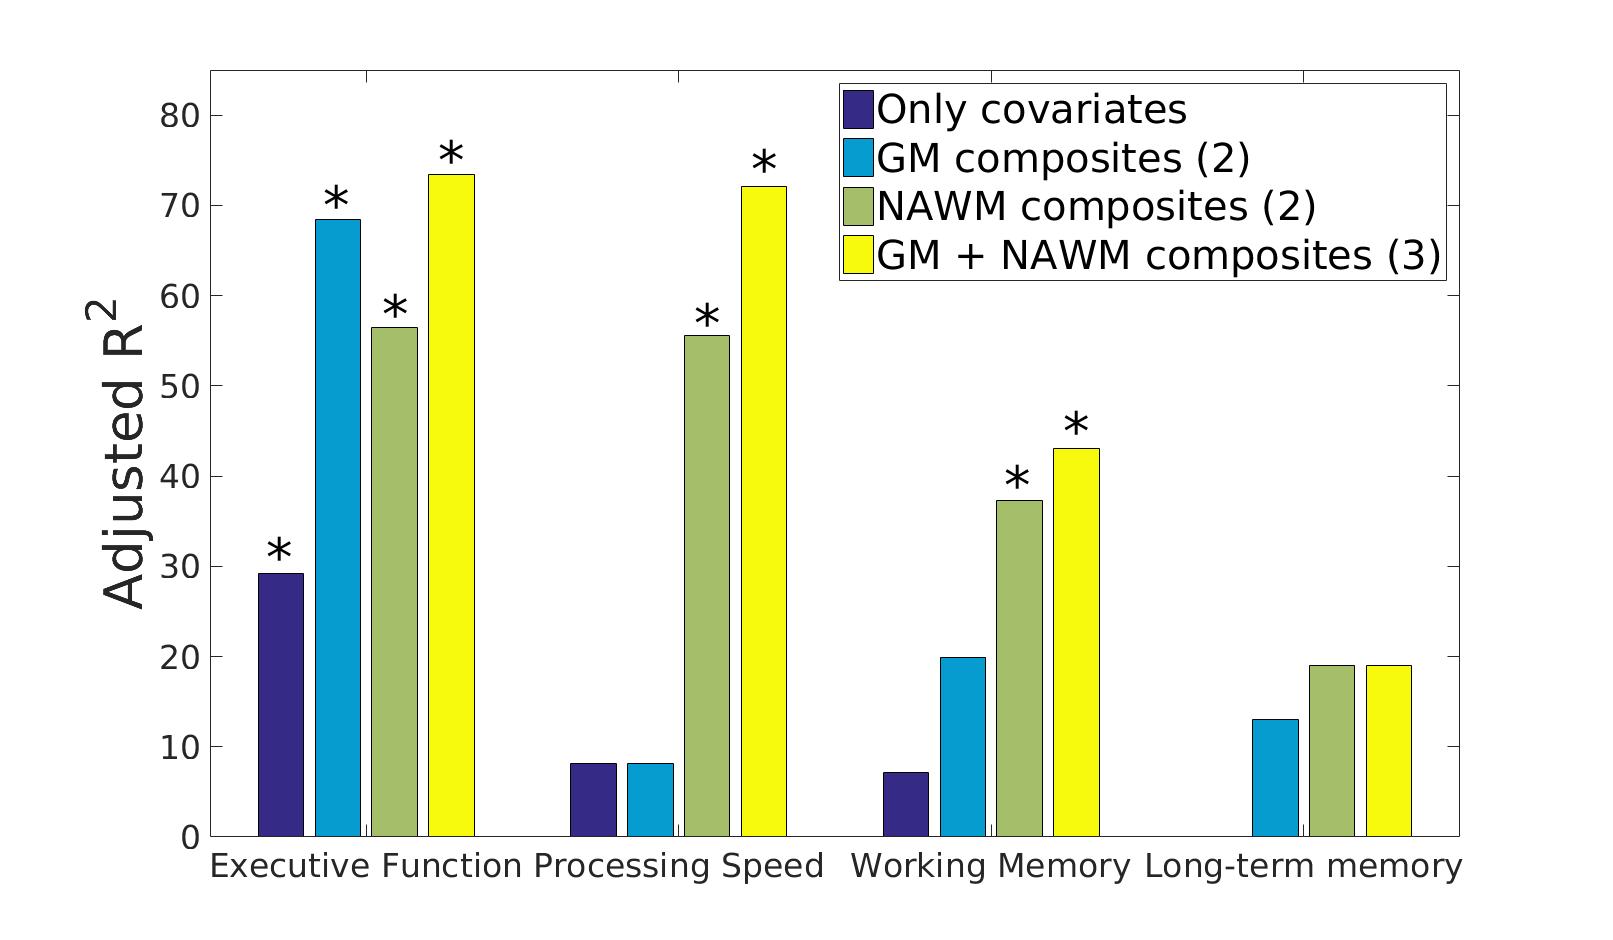
Fig.1 shows the ALFF, fALFF1, fALFF2 and fALFF3 maps, averaged across all patients, displaying the distribution of each metric across the brain. Fig.2 presents the Pearson correlation analysis between the neuropsychological scores in each of the four cognitive domains and the eight different metrics. Only processing speed was predicted with significance using single predictors, namely: fALFF2 and fALFF3 in NAWM (p=0.033 and p=0.015, respectively) and ALFF in GM and NAWM (p=0.014 and p=0.017, respectively). Correlation analyses between metrics and covariates are displayed in Fig.3. Significant correlations (p<0.05) between metrics can be observed, with the exception of fALFF1, which only correlates with fALFF3 in GM. In contrast, covariates generally did not present significant correlations with metrics and among themselves. Fig.4 displays results from MLR analyses, including the covariates and the corresponding significant processing speed predictors (ALFF in GM and NAWM, and fALFF2 and fALFF3 in NAWM). The model that best explained processing speed scores (49,74% of variance, p=0.018) included the ALFF metric in NAWM (predictor with the lowest p-value, p=0.005) in addition to the covariates: group, nBV and nLV (p=0.047, p=0.044 and p=0.026, respectively). Further MLR analyses of all four cognitive domains were also performed using only the covariates, the covariates and the composite scores (principal components explaining at least 80% of the variance) of GM metrics, NAWM metrics, and the combination of GM and NAWM metrics. These results are displayed in Fig.5.Conclusions
We found that cognitive impairments in processing speed were significantly correlated with ALFF/fALFF metrics obtained from resting-state BOLD-fMRI, with ALFF in NAWM significantly predicting cognitive scores (adjusted R2~50%) in a multiple linear regression analysis including demographic and structural covariates. We further showed that a combination of NAWM metrics was selected to predict also working memory and executive function. These findings are consistent with a previous study reporting increased physiologic fluctuations in NAWM of SVD patients compared with controls3 . Our results indicate that measures of spontaneous BOLD fluctuations, particularly in NAWM, have the potential to predict cognitive impairments associated with SVD, and therefore may provide sensitive disease biomarkers.Acknowledgements
This work was funded by FCT grants PD/BD/135114/2017, PTDC/BBB-IMG/2137/2012, and UID/EEA/50009/2013.References
1. Pantoni L. Cerebral small vessel disease: from pathogenesis and clinical characteristics to therapeutic challenges. The Lancet Neurology, 1;9(7):689-701, 2010.
2. Sam K, Conklin J, Holmes KR, et al. Impaired dynamic cerebrovascular response to hypercapnia predicts development of white matter hyperintensities. NeuroImage: Clinical, 11:796-801, 2016
3. Makedonov, S. E. Black, and B. J. MacIntosh. BOLD fMRI in the White Matter as a Marker of Aging and Small Vessel Disease. PLoS ONE, 8(7):1–9, 2013.
4. X. N. Zuo, A. Di Martino, C. Kelly, Z. E. Shehzad, D. G. Gee, D. F. Klein, F. X. Castellanos, B. B. Biswal, and M. P. Milham. The oscillating brain: Complex and reliable. NeuroImage, 49(2):1432–1445, 2010
Figures