3721
Breath-hold BOLD-fMRI cerebrovascular reactivity metrics predict cognitive impairment in cerebral small vessel disease1ISR-Lisboa/LARSyS and Department of Bioengineering, Instituto Superior Técnico – Universidade de Lisboa, Lisboa, Portugal, 2Neurology Department, Hospital Egas Moniz, Centro Hospitalar de Lisboa Ocidental, Lisboa, Portugal, 3CEDOC - Nova Medical School, New University of Lisbon, Lisboa, Portugal, 4Faculdade de Medicina, Universidade de Lisboa, Lisboa, Portugal, 5Imaging Department, Hospital da Luz, Lisboa, Portugal
Synopsis
Cerebral small vessel disease (SVD) is associated with an increased risk of stroke and dementia, being implicated in age-related cognitive decline. In this work, we investigate the potential of cerebrovascular reactivity (CVR) to provide sensitive biomarkers of SVD, by evaluating metrics extracted from breath-hold BOLD-fMRI in terms of their predictive power of cognitive impairment in a group of SVD patients. We modelled the breath-hold BOLD-fMRI response using a sinusoidal approach, and derived both CVR amplitude and delay-based maps. Multiple linear regression analysis showed that CVR metrics significantly contributed to explain cognitive impairments in working memory, long-term memory and executive function.
Introduction
Cerebral small vessel disease (SVD) encompasses pathological processes affecting the small vessels of the brain, and is associated with an increased risk of stroke and dementia. Biomarkers for SVD based on conventional structural imaging have been extensively studied but are poorly correlated with cognitive performance1. Although cerebrovascular reactivity (CVR) is thought to be impaired in SVD, to date only a few studies have investigated CVR measures as potential SVD biomarkers, with somehow discordant results2. Here, we aim to investigate the potential of CVR measurements obtained by BOLD-fMRI during a breath-hold (BH) task to provide sensitive biomarkers of SVD, by evaluating CVR metrics in terms of their predictive power of cognitive impairment.Methods
11 patients with sporadic SVD (sSVD) (52 ± 7 yrs) and 6 patients with a genetic form of SVD (CADASIL) (47 ± 11 yrs) were studied on a 3T Siemens system. Structural images included T1-weigthed MPRAGE (1mm isotropic), T2-weighted FLAIR (0.7x0.7x3.3mm3). BOLD-fMRI data were acquired using a GE-EPI sequence (TR/TE=2500/30ms, 40 slices, 132 volumes, 3.5x3.5x3.0 mm3) during a BH task (3 cycles of 15s BH after inspiration, alternated with normal breathing, following inspiration/expiration auditory cues). All data were analyzed using FSL (www.fsl.fmrib.ox.ac.uk), except for the non-linear co-registration to the standard MNI space performed using ANTs (www.stnava.github.io/ANTs/). BOLD fMRI data were corrected for EPI distortions using a fieldmap, motion corrected and high-pass filtered, and subsequently analysed using a general linear model (GLM) approach, including as regressors of interest a sine and a cosine at the task frequency and corresponding 1st harmonics. Voxelwise maps were derived for the CVR amplitude (percent signal change, PSC) and the CVR time-delay (time-to-peak, TTP). Both PSC and TTP were then averaged across gray matter (GM) and normal appearing white matter (NAWM). The patients’ cognitive function was evaluated using a battery of neuropsychological tests, including: Stroop and Trail Making Test Part B, for executive function; Trail Making Test Part A, for processing speed; WAIS-III Digit Span, for working memory; and WMS-III, for long-term memory. Multiple linear regression models were then estimated using the R software (www.rstudio.com) by including the CVR metrics, as well as the following demographic and structural imaging variables as covariates: group, gender, age, normalized brain volume (nBV) and normalized white matter hyperintensity lesion load (nWMHLL). All metrics were first transformed to z-scores. A best subsets regression analysis was performed in order to identify the subsets of regressors that best explain the neuropsychological scores (8 subsets). The model with highest adjusted coefficient of determination, R2adj was selected. For comparison purposes a based model with only covariates, and a model with covariates and PSC metrics alone were also evaluated.Results
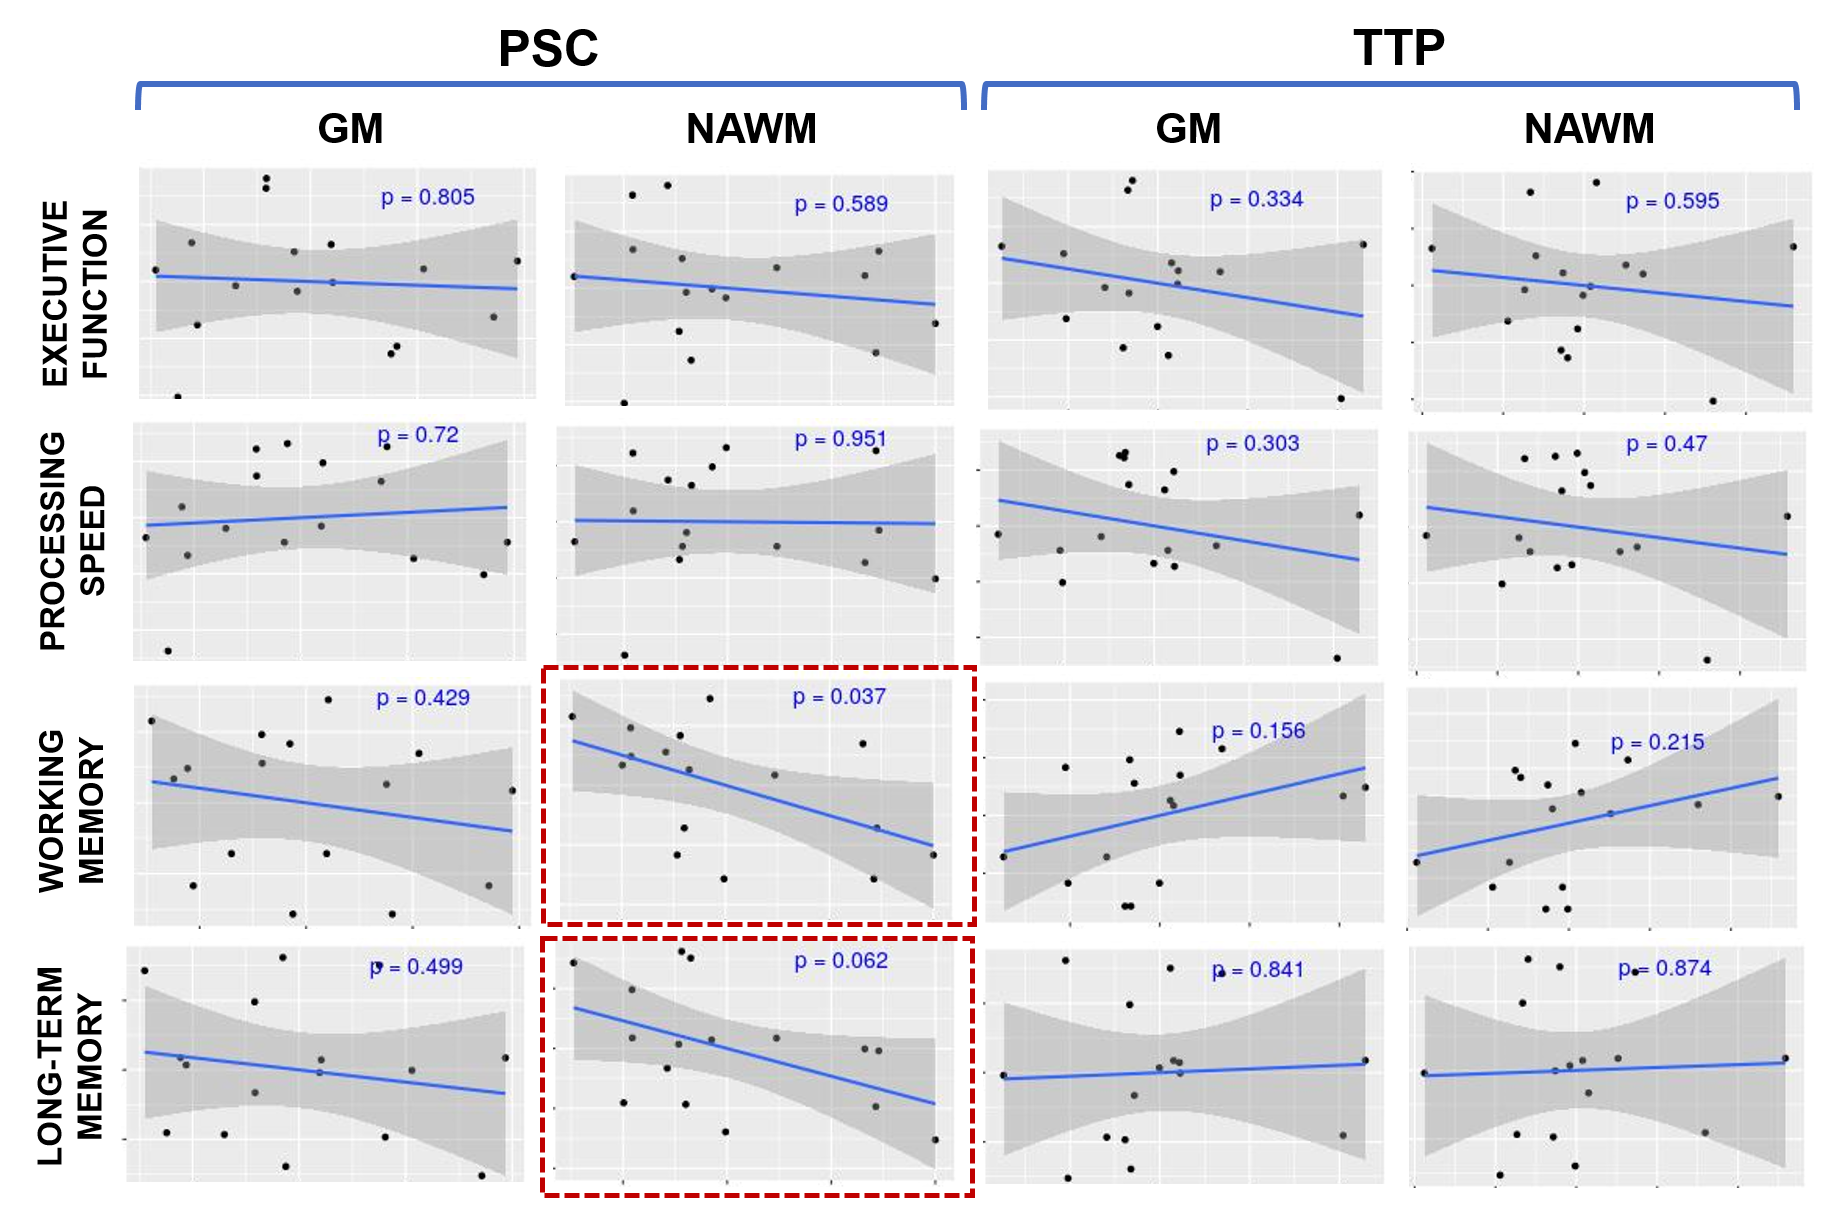
An illustrative example of CVR and TTP maps is displayed in Fig.1. Pearson correlation analysis between the neuropsychological scores in each of the four cognitive domains and each of the four CVR metrics considered (PSC and TTP in GM and NAWM) is shown in Fig.2. Only PSC in NAWM exhibited significant (or close to significant) correlations with the working memory and long-term memory scores (p=0.037 and p=0.062, respectively). Fig.3 displays the five subsets of regressors (including both CVR metrics and covariates) that best explained the neuropsychological scores. Consistently with the correlation analysis, PSC in NAWM is selected as a predictive regressor for working memory and long-term memory, and it is also selected for executive function. Interestingly, the CVR metric TTP in NAWM is additionally selected for these three cognitive domains. Importantly, in the case of the two memory functions, conventional structural imaging covariates (nBV and nLV) are not predictive. In the case of executive function, PSC and TTP in GM are also selected. Fig.4 summarizes the results of the linear regression using the best model (highest R2adj) for each cognitive domain, including the respective significant predictors, compared with a model containing only the covariates and another model containing the covariates and PSC metrics alone.Conclusions
Our results provide the first evidence that CVR metrics obtained by non-invasive BH fMRI measurements have the potential to predict cognitive decline in SVD, and therefore further support the hypothesis that CVR may provide sensitive SVD biomarkers. In particular, the CVR amplitude in NAWM (PSC NAWM) is significantly correlated with both working and long-term memory domain. Our results are in line with a previous report showing that reduced CVR amplitude and delay in NAWM precedes the development of white matter hyperintensities (WMH)3.Acknowledgements
This work was funded by FCT grants PD/BD/135114/2017, PTDC/BBB-IMG/2137/2012, and UID/EEA/50009/2013.References
1. Patel B, Markus HS. Magnetic resonance imaging in cerebral small vessel disease and its use as a surrogate disease marker. Int J Stroke 2011; 6: 47–59.
2. Thrippleton MJ, Shi Y, Blair G, et al. Cerebrovascular reactivity measurement in cerebral small vessel disease: Rationale and reproducibility of a protocol for MRI acquisition and image processing. Int J Stroke 2018; 13: 195–206.
3. Sam K, Conklin J, Holmes KR, et al. Impaired dynamic cerebrovascular response to hypercapnia predicts development of white matter hyperintensities. NeuroImage Clin 2016; 11: 796–801.
Figures