3719
Sympathetic contribution of respiratory effects to the fMRI signal1NINDS, NIH, Bethesda, MD, United States, 2Vanderbilt University, Nashville, TN, United States
Synopsis
fMRI signal covariation with fluctuations in systemic physiology, including cardiac rate and respiration, is well established. Recent work showed strong correlations between peripheral vascular tone, a proxy for sympathetic activity, and fMRI global signal during drowsiness and sleep. As sympathetic activity may also be triggered by inspiration, even during the alert waking condition typical of task fMRI, we investigated the relationship between respiration, peripheral vascular tone, and fMRI signal during a visual task.
Introduction
While fluctuations in systemic physiology are well known to contribute to the fMRI signal, the precise mechanisms of action and spatio-temporal characteristics of their effect are poorly understood. For example, variations in blood CO2content due to respiratory variations may cause widespread changes in fMRI signal through local (intracortical) mechanisms1,2. Previous work3 also showed that, during drowsiness and sleep, covariations in systemic physiology and the fMRI signal may be predominantly sympathetically mediated through the extrinsic innervation of the extraparenchymal arteries. It is important to understand the relative contribution of these mechanisms to increase our ability to interpret fMRI signal. Here, we investigated whether sympathetic mechanisms may be prominent during alertness conditions more typical of task fMRI by studying the effects of voluntary deep breaths during a visual task. As a proxy for sympathetic activity we measured finger skin vascular tone with photoplethysmography (PPG)3.Methods
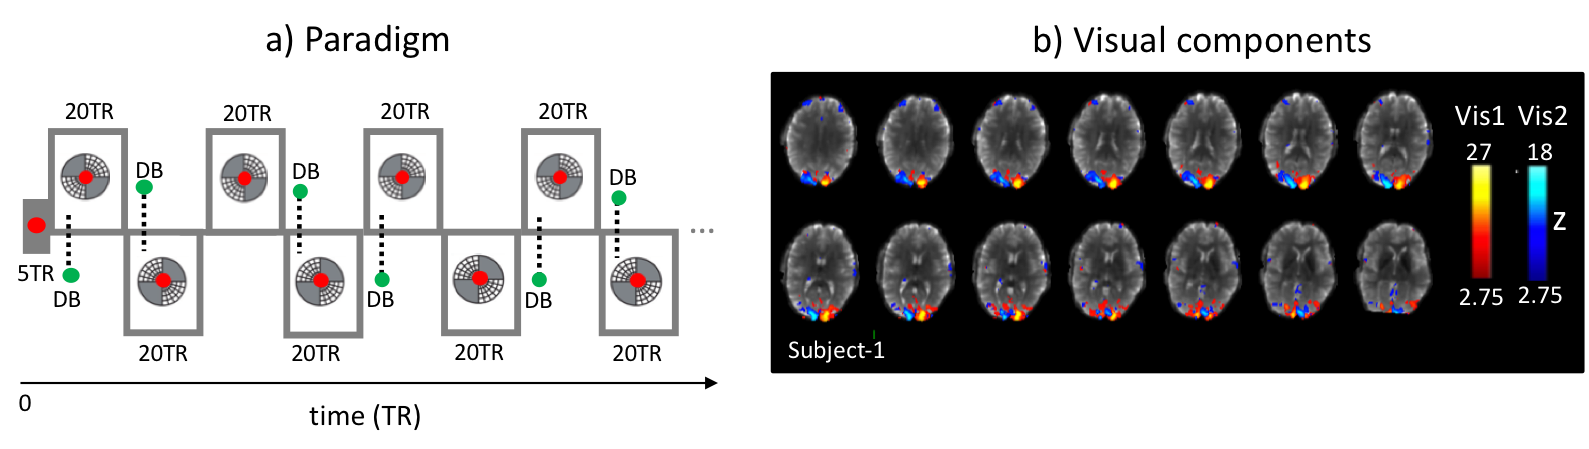
In order to understand the effect of respiration variation on fMRI signal during typical fMRI conditions, we used a visual task to prevent subjects from becoming drowsy. Subjects viewed an alternating flickering checkerboard and were instructed to take occasional deep breaths (DB) (Fig.1). The visual stimulus consisted of checkerboard patterns displayed diagonally in 2 opposing quadrants, presented in alternating pairs in 40 s blocks (Fig.1). A fixation dot presented in the center of the visual field changed color intermittently to cue the subject to take a single DB. This happened periodically, 10 seconds into each 40 s visual block. In every third block the DB cue was not presented.
BOLD fMRI data were obtained from four healthy subjects at 7T (Siemens) with gradient-echo-EPI (FA = 700, TR = 2 s, TE = 30 ms, isotropic resolution = 2 mm, acceleration-factor = 2) with a 32-channel head coil. Preprocessing of fMRI data included motion coregistration and regression, polynomial regression of low-frequency signal drifts, and slice timing correction. Physiological signals were collected with a PPG pulse oximeter attached to the finger, and respiratory bellows. PPG signals were aligned with fMRI data and amplitudes (PPG-AMP) were extracted3. Zero-mean heart rate (HR) time-series (beats-per-minute) and respiration volumes (RV) were calculated as previously described4.
Both PPG-AMP and fMRI response to a single DB were calculated by averaging over multiple 40s blocks. fMRI averaging was done for whole brain grey matter (GM) and the activated visual area, defined using independent component analysis (ICA) (MELODIC, FSL5, number of components = 20, data spatially smoothed with 3 mm FWHM), as the combined effect of stimulus and DB was not a-priori known. PPG-AMP, fMRI, and RV signals were also compared by temporal cross correlation.
Results
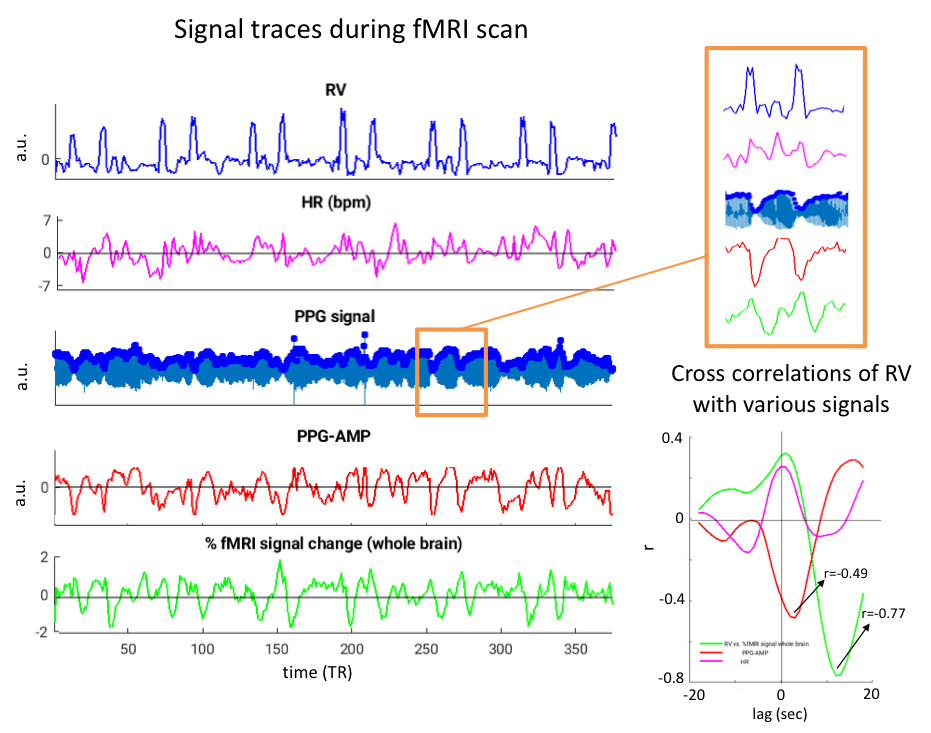
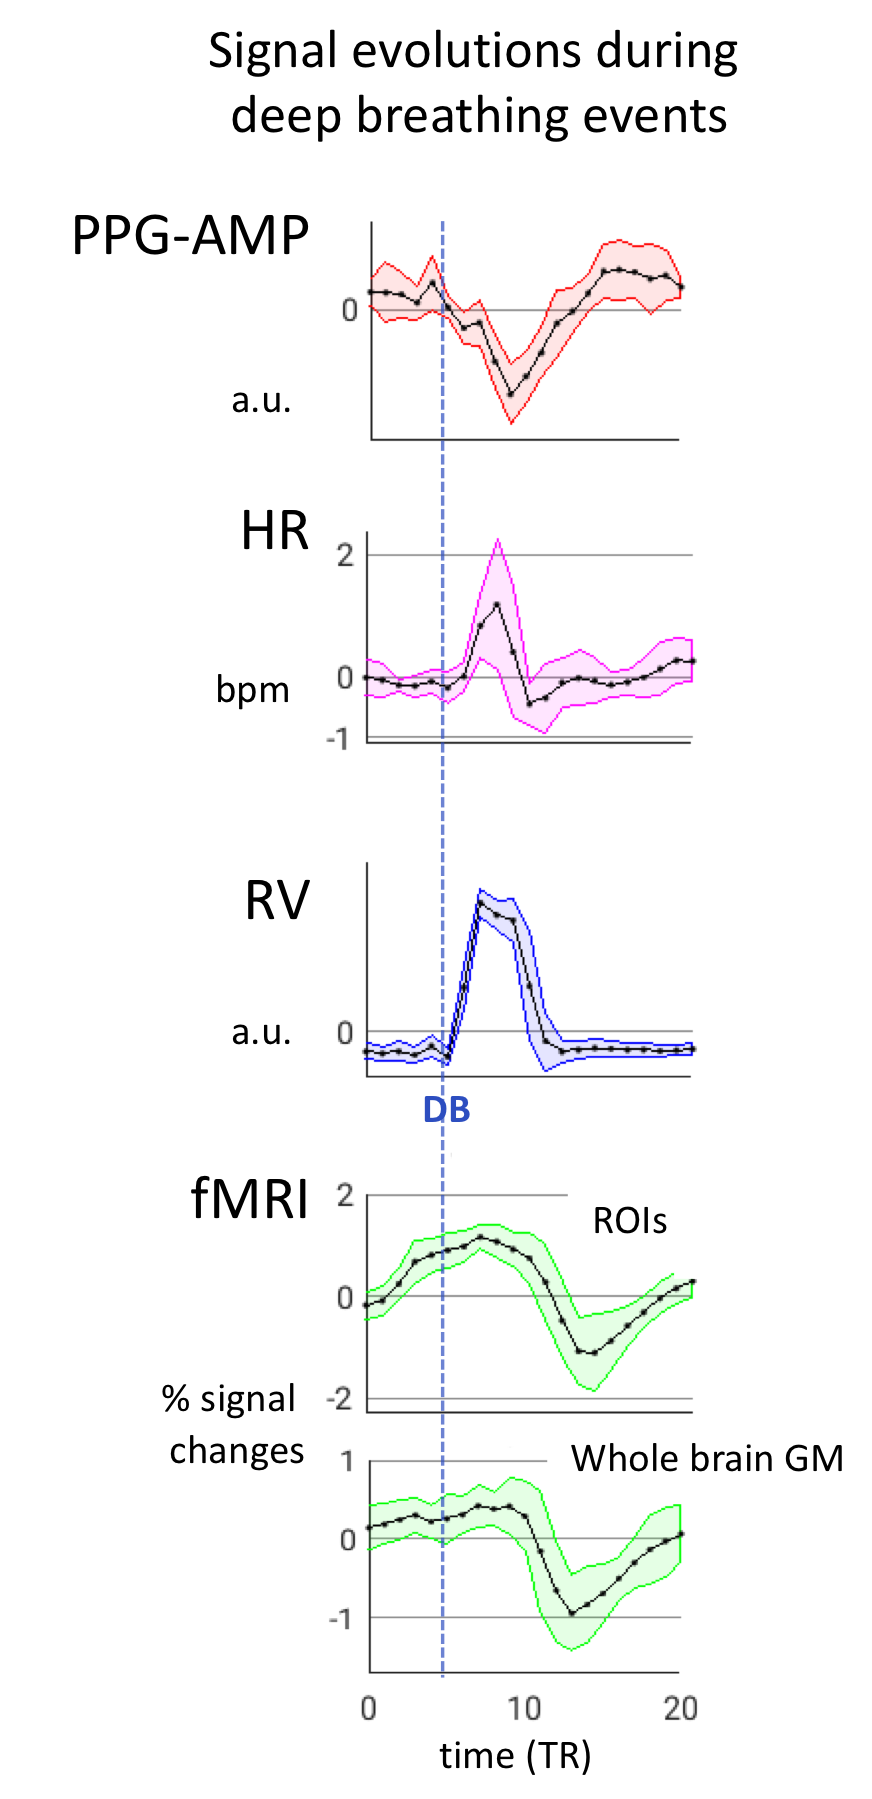
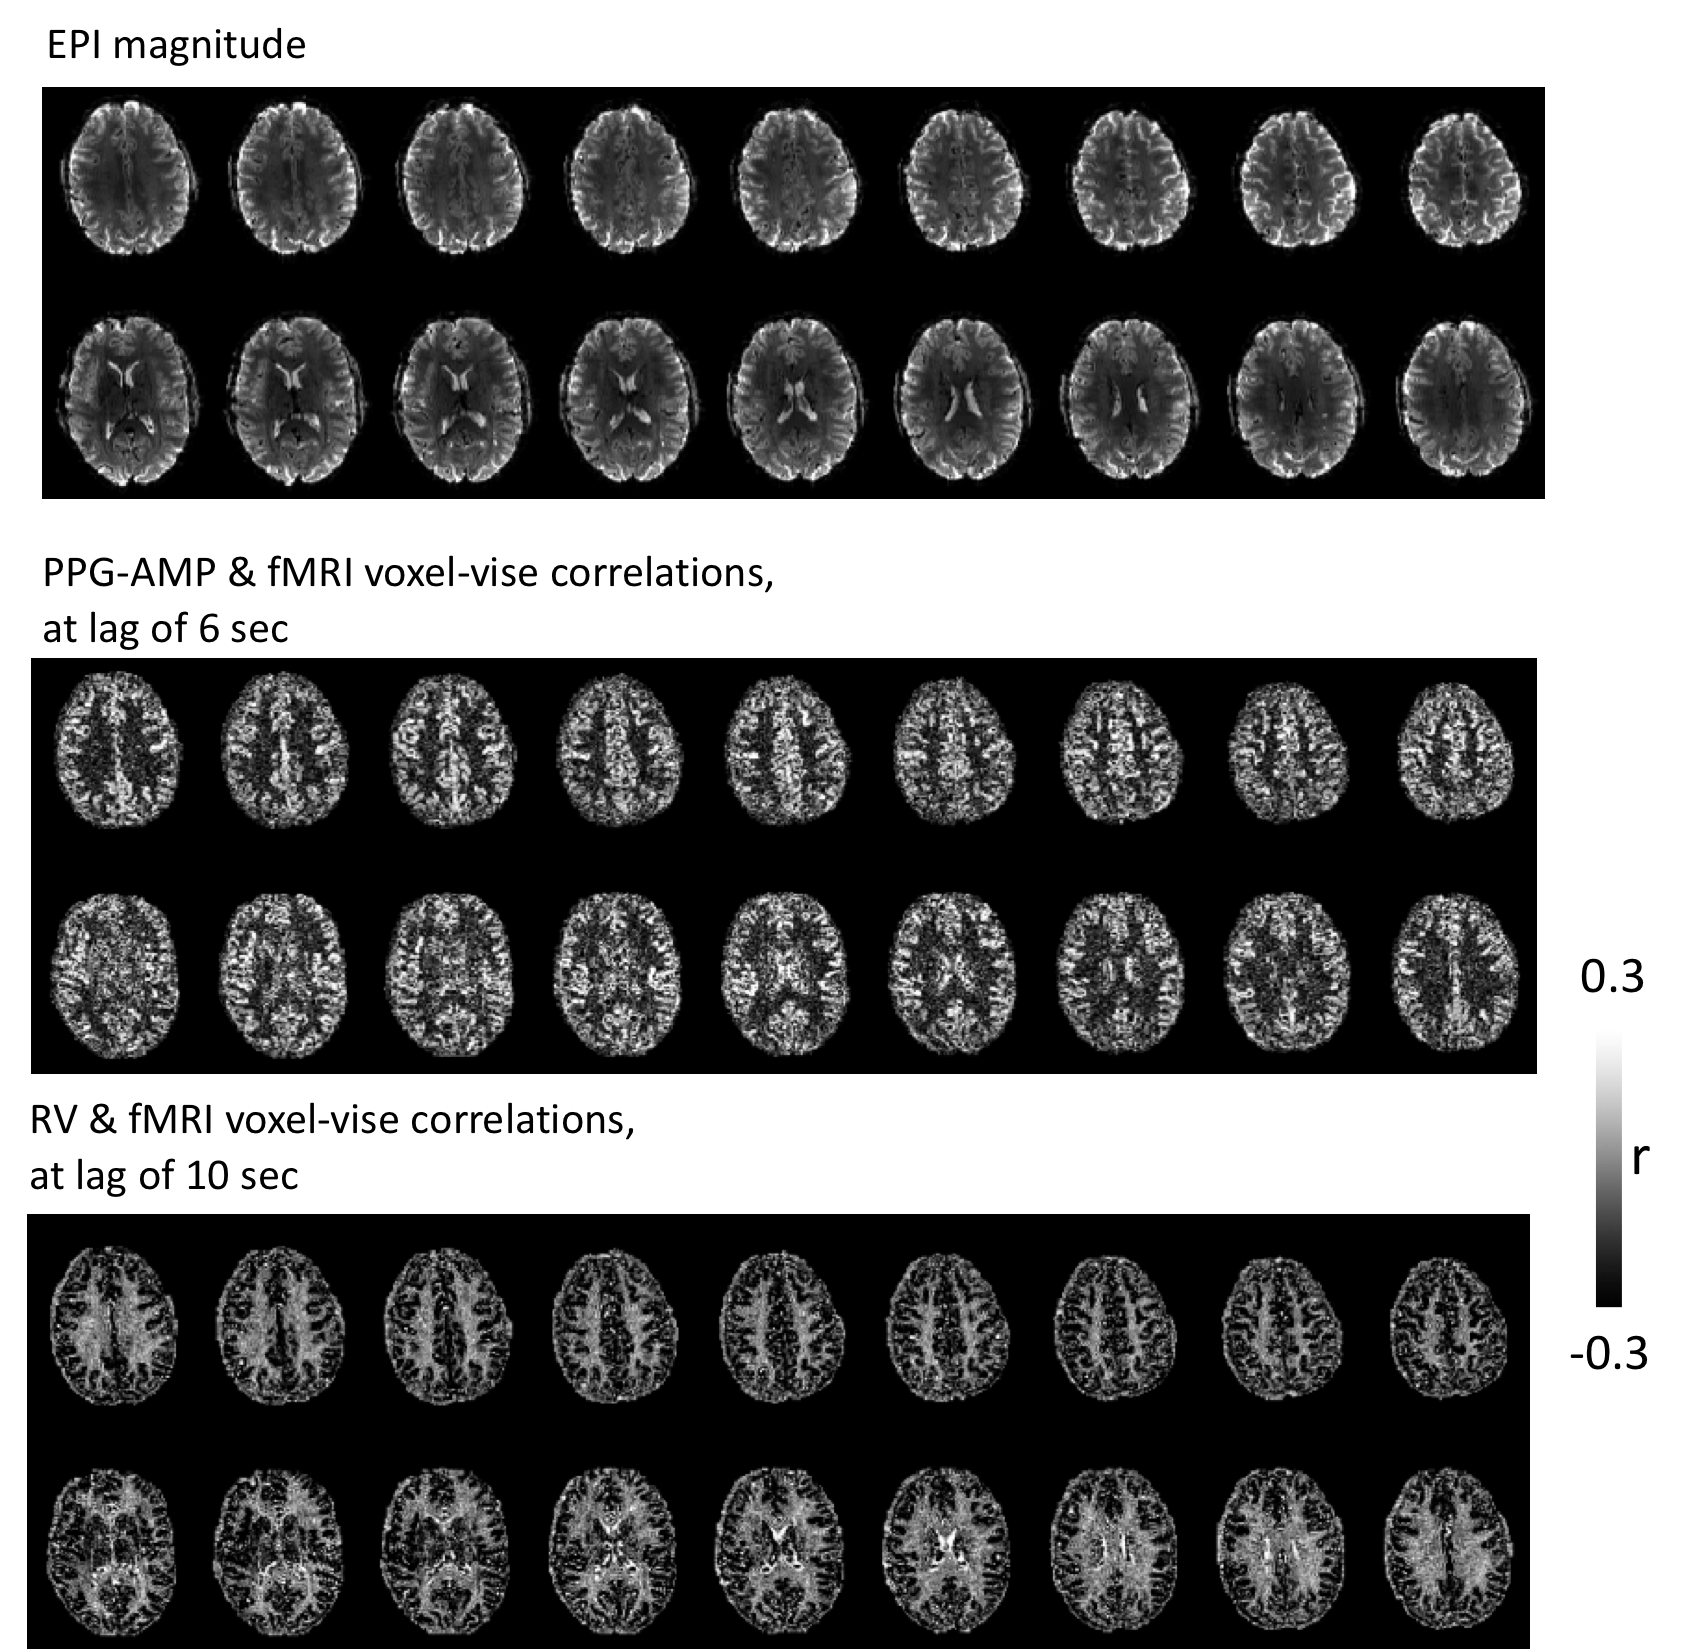
During deep breathing, PPG-AMP drops correspond with increased RV, followed by an fMRI signal decrease (Fig.2). Temporal correlations of RV with PPG-AMP and % fMRI signal change showed substantial negative correlations at positive lags, with fMRI signal changes having the longest lags (Fig.2b). Signal changes were averaged over 40 s windows that contained a DB, further supporting our observations (Fig.3): an RV increase was observed at around 10s, followed by PPG-AMP drop and fMRI signal decrease. An initial increase in fMRI signal is due to the task paradigm. Variations in HR also seemed to follow the increase in RV, consistent with a sympathetic mechanism. Voxel-wise correlations of fMRI with PPG-AMP showed positive correlation in GM (i.e. decreased PPG-AMP, decreased fMRI signal), and with RV a negative correlation (Fig.4).Conclusion and Discussion
Our preliminary results support the well-known relation of deep breathing effects on peripheral measures of sympathetic activity6, and further illustrate their temporal relationship with fMRI, suggesting a mechanism other than local (intracortical) vasodilation. Spatial patterns of correlations between PPG-AMP/RV and fMRI are highly similar to the previous observations reported during light-sleep3 and deep breathing7,2. The similarity with light sleep is consistent with sympathetic origin, as the arousal variations in this state are accompanied by sympathetic variation3. It should also be noted that joint PPG-fMRI variations are not always accompanied by changes in RV, e.g. during light sleep. Because of this, physiological noise removal from fMRI data under general conditions may benefit from using additional regressors, including PPG-AMP.
Following each deep inspiration, fMRI signal drops reached a minimum at a latency of ~10 s, similar to that observed in earlier studies2,7,8. This drop was previously attributed to a local vascular response to CO2 changes. In contrast, the data presented here suggest an important systemic contribution from the sympathetic mechanism, which may be triggered by various stimuli other than a CO2 change, including psychological stimuli during cognitive tasks9,10. Hence, interpretation of fMRI signals in terms of neuronal activity and functional connectivity should proceed with caution.
Acknowledgements
No acknowledgement found.References
1. Wise, R. G., Ide, K., Poulin, M. J. & Tracey, I. Resting fluctuations in arterial carbon dioxide induce significant low frequency variations in BOLD signal. Neuroimage 21, 1652-1664, (2004).
2. Birn, R. M., Diamond, J. B., Smith, M. A. & Bandettini, P. A. Separating respiratory-variation-related fluctuations from neuronal-activity-related fluctuations in fMRI. Neuroimage 31, 1536-1548, (2006).
3. Ozbay, P. S. et al. Contribution of systemic vascular effects to fMRI activity in white matter. Neuroimage 176, 541-549, (2018).
4. Chang, C., Cunningham, J. P. & Glover, G. H. Influence of heart rate on the BOLD signal: the cardiac response function. Neuroimage 44, 857-869, (2009).
5. Jenkinson, M., Beckmann, C. F., Behrens, T. E., Woolrich, M. W. & Smith, S. M. Fsl. Neuroimage 62, 782-790, (2012).
6. Gilliatt, R. W. Vaso-constriction in the finger after deep inspiration. The Journal of physiology 107, 76-88 (1948).
7. Bright, M. G., Bianciardi, M., de Zwart, J. A., Murphy, K. & Duyn, J. H. Early anti-correlated BOLD signal changes of physiologic origin. Neuroimage 87, 287-296 (2014).
8. Bright, M. G., Bulte, D. P., Jezzard, P. & Duyn, J. H. Characterization of regional heterogeneity in cerebrovascular reactivity dynamics using novel hypocapnia task and BOLD fMRI. Neuroimage 48, 166-175, (2009).
9. Critchley, H. D. Psychophysiology of neural, cognitive and affective integration: fMRI and autonomic indicants. International journal of psychophysiology : official journal of the International Organization of Psychophysiology 73, 88-94, (2009).
10. Yoshihara, K. et al. Neural correlates of fear-induced sympathetic response associated with the peripheral temperature change rate. Neuroimage 134, 522-531, (2016).
Figures