3715
Quantification of draining vein dominance across cortical depths in BOLD fMRI from first principles using realistic Vascular Anatomical Networks1Athinoula A. Martinos Center for Biomedical Imaging, Massachusetts General Hospital, Charlestown, MA, United States, 2Department of Radiology, Harvard Medical School, Boston, MA, United States, 3Neurophotonics Center, Department of Biomedical Engineering, Boston University, Boston, MA, United States, 4Division of Health Sciences and Technology, Massachusetts Institute of Technology, Cambridge, MA, United States
Synopsis
The neuronal specificity of gradient echo (GE) BOLD is diminished by the extravascular signal from large draining veins, whose contribution can be reduced by using small voxel sizes and sampling far away from the cortical surfaced. Here we use simulations of the GE-BOLD signal based on a realistic vascular network (VAN) to quantify the extent of the pial vein dominance into the cortex field strengths between 7 and 14 Tesla. We estimate a pial vessel dominance down to a depth of 800 μm at 14 Tesla in humans, suggesting that small GE-BOLD voxels below this depth can be immune to the effects of these surface vessels.
Introduction
Gradient echo (GE) based pulse sequences provide the most widely-used, robust, and sensitive technique for BOLD fMRI signal acquisition, however GE-BOLD is well-known to be sensitive to extravascular signal changes from large veins, which reduces the spatial specificity to the site of active neurons. Recent technological developments have enabled voxel sizes well below the thickness of the cortical gray matter, creating the possibility to improve the neuronal specificity of GE-BOLD by restricting analysis to voxels farthest from large veins1,2,3. Unfortunately, the large draining veins on the cortical surface have long-ranging extravascular fields that penetrate deep into the cortical gray matter generating a GE-BOLD signal that is contaminated even for small voxels situated far from the cortical surface. Here we calculate the extravascular fields of large draining vessels from first principles using a realistic Vascular Anatomical Network (VAN) reconstructed from rodent cerebral cortex4,5. To evaluate whether the GE-BOLD signal from surface veins or the parenchymal microvasculature dominates, we separately simulated the GE-BOLD signal changes from each vascular compartment and compared their magnitudes. Because the extent of extravascular fields increases at higher field-strengths, we also investigated the penetration of the vein-dominated region into the cortex at several ultra-high fields-strengths.Methods
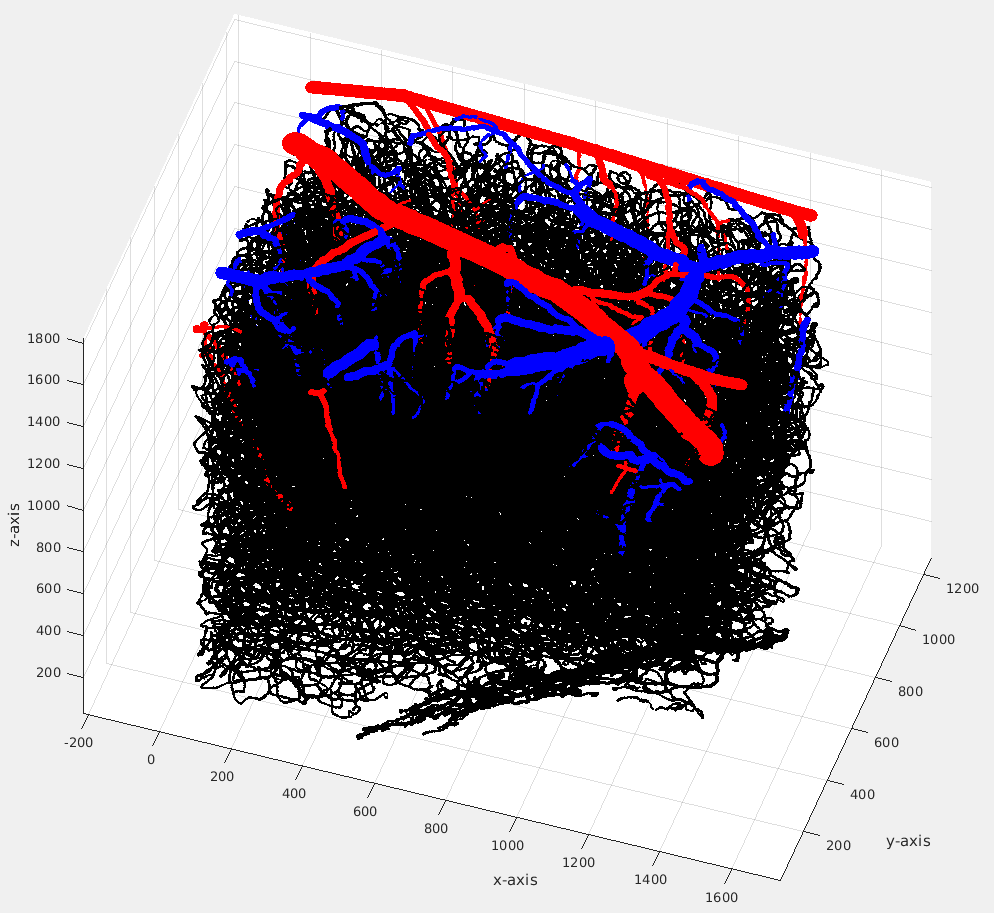
We used a VAN model of size 1200×1500×1900 μm3 reconstructed from rodent somatosensory cortex5 (see Fig. 1). Extravascular fields were computed separately for arteries, draining veins, and capillaries using the finite perturber method6 and different hematocrit and oxygen saturation (SO2) levels for each compartment for both baseline and activated states7. B0 was oriented either parallel or perpendicular to the cortical surface in separate simulations. To quantify the accuracy of the numerical finite perturber method we also compute the fields of long cylinders and compared them to known analytical solutions. The resulting extravascular GE-BOLD signal change between baseline and activated states was then simulated within the volume4 for a given TE, providing the T2’ component of the GE-BOLD signal; the effect of T2 decay was also included, with T2 values for each field-strength taken from previous reports8. The GE-BOLD signal change from both the draining vein and capillary compartments was simulated across all cortical depths for a 500×500×500 µm3 voxel. Contributions of veins were deemed negligible if smaller than capillary contributions by a factor of 10.Results
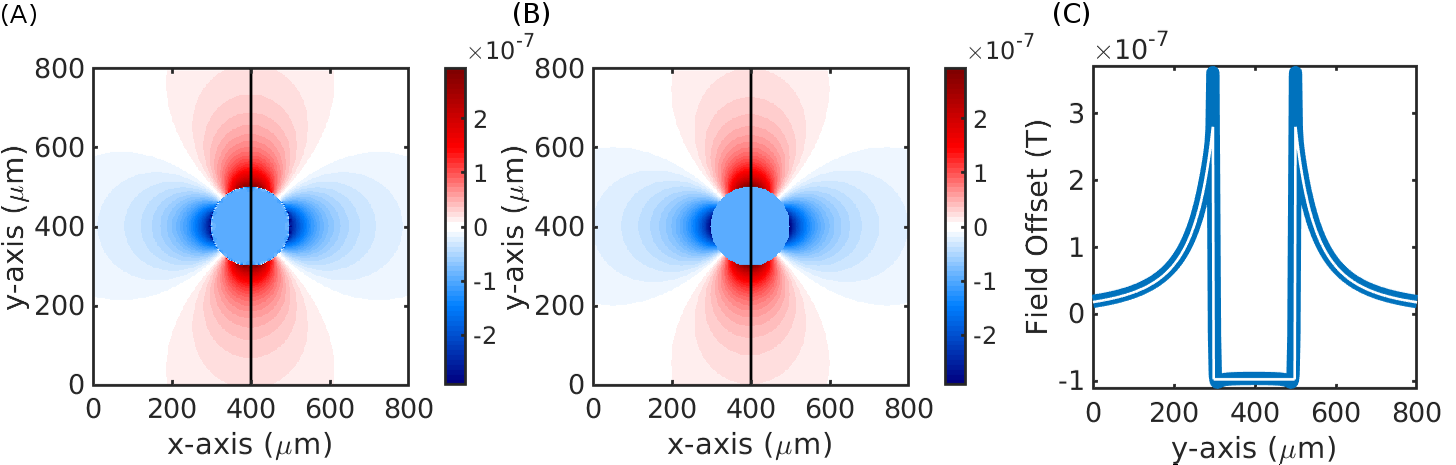
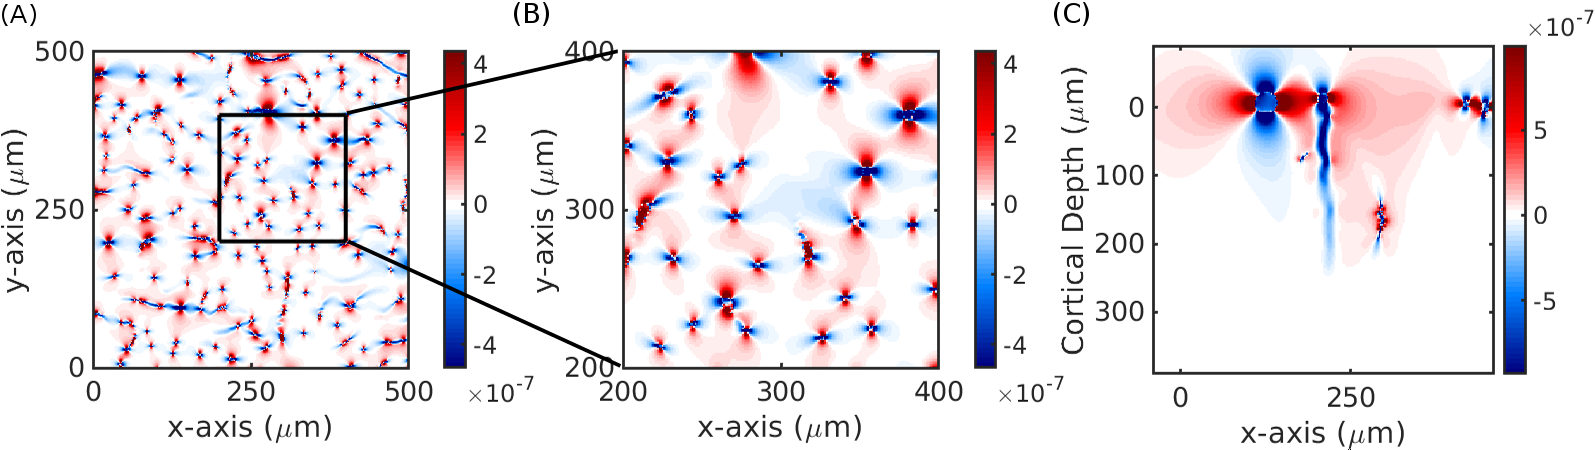
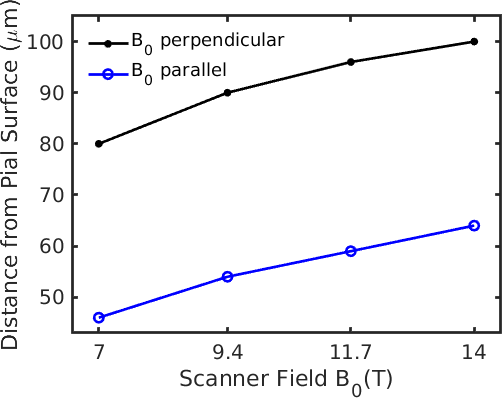
Fig. 2 demonstrates the agreement of fields generated from the finite perturber method and the analytic solution for a simple cylinder. While there are small differences near the boundary of the cylinder likely due to spatial discretization/truncation effects, overall the two calculated fields agreed to within 10%. Fig. 3 depicts example patterns of field offsets within a voxel positioned inside the VAN shown as cross-sections. Fig. 4 summarizes the cortical depths at which capillaries dominate and pial veins are negligible across field strengths; at 14T the pial vessel contribution extends to a cortical depth of 100 µm; assuming a similar contribution from capillaries but an increased range of extravascular fields from pial veins due to a larger vein radius in humans (30 µm → 190 µm)9 we calculated that a depth of at least 800 µm would be seen in human cortex. We further found that intra-cortical veins contributed approximately 30% of the parenchymal signal when B0 was parallel to the cortical surface.Discussion
Several simplifying assumptions have been made in our simulations which must be taken into account. We assumed a constant hematocrit and SO2 value within each vascular compartment and simulated static-dephasing water molecules. In our future work we will use more realistic SO2 distributions and include random motion of water molecules. The rodent cortical vasculature composition is known to be different from that of humans10 and therefore predictions on pial vein dominance in humans is difficult based on our current framework. However, our VAN model allowed to compare the relative GE-BOLD signals from draining veins to parenchymal capillaries in a much more realistic scenario than possible if vessels are approximated by cylinders. We observed qualitative and quantitative agreement with previous simulations4,8,9,11.Conclusion
GE-BOLD sampling outside of the pial vein dominance region is possible even at UHF. Special care has to be taken about the contributions of diving veins which can be present across the entire cortical depth. We demonstrated that the determination of the regions dominated by venous signals can help to guide future studies and enable fMRI acquisitions with both high sensitivity and specificity to the microvasculature.Acknowledgements
This work was supported in part by a fellowship of the German Research Foundation (DFG grant PF 897/2-1), NIH NIBIB (grants P41-EB015896 and R01-EB019437), by the BRAIN Initiative (NIH NIMH grant R01-MH111419), and by the MGH/HST Athinoula A. Martinos Center for Biomedical Imaging; and was made possible by the resources provided by NIH Shared Instrumentation Grant S10-RR023043. We also thank Prof. David Kleinfeld of UCSD for providing the Vascular Anatomical Networks.References
1. Polimeni JR, Fischl B, et al. Laminar analysis of 7 T BOLD using an imposed spatial activation pattern in human V1. Neuroimage 2010; 52(4): 1334–1346.
2. Nasr S, Polimeni JR, Tootell RBH. Interdigitated Color- and Disparity-Selective Columns within Human Visual Cortical Areas V2 and V3. J. Neurosci. 2016; 36: 1841–1857.
3. Ahveninen, J., Chang, W.-T., Huang, S., Keil, B., Kopco, N., Rossi, S., Bonmassar, G., Witzel, T., Polimeni, J.R., 2016. Intracortical depth analyses of frequency-sensitive regions of human auditory cortex using 7T fMRI. Neuroimage 143, 116–127.
4. Gagnon L, Sakadžić S, et al. Quantifying the Microvascular Origin of BOLD-fMRI from First Principles with Two-Photon Microscopy and an Oxygen-Sensitive Nanoprobe. J. Neurosci. 2015; 35(8): 3663–3675.
5. Blinder P, Tsai P, et al. The cortical angiome: an interconnected vascular network with noncolumnar patterns of blood flow. Nat. Neurosci. 2013; 16: 889–897.
6. Pathak AP, Ward BD, Schmainda KM. A novel technique for modeling susceptibility-based contrast mechanisms for arbitrary microvascular geometries: the finite perturber method. Neuroimage 2008; 40(3): 1130-43.
7. Vovenko E. Distribution of oxygen tension on the surface of arterioles, capillaries and venules of brain cortex and in tissue in normoxia: an experimental study on rats. Eur. J. Physiol. 1999; 437:617–623.
8. Uludağ K, Müller-Bierl B, Uğurbil K. An integrative model for neuronal activity-induced signal changes for gradient and spin echo functional imaging. Neuroimage 2009; 48(1): 150-65.
9. Duvernoy HM, Delon S, Vannson JL.Cortical blood vessels of the human brain. Brain Research Bulletin 1981; 7(5):519-579.
10. Schmid F, Barrett MJP, et al. Vascular density and distribution in neocortex. Neuroimage 2017; in press.
11. Báez-Yánez MG, Ehses P, et al. The impact of vessel size, orientation and intravascular contribution on the neurovascular fingerprint of BOLD bSSFP fMRI. Neuroimage 2017; 163:13-23.
Figures