3713
Measurements and modeling of the negative hemodynamic response function in human early visual cortex1Neuroscience, Baylor College of Medicine, Houston, TX, United States
Synopsis
A negative BOLD response is often observed in early visual cortex. Previous measurements indicate that negative BOLD is the consequence of flow decreases. However, negative BOLD is usually evoked by blocked experimental designs that obscure details of their temporal dynamics. To understand the physiology of the negative BOLD, we used a slow event-related paradigm to elicit strong hemodynamic response functions (HRFs) in primary visual cortex as a function of eccentricity. We used a modified version of the Arterial Impulse Model to predict the neurovascular and neurometabolic mechanisms of negative BOLD. Results indicate that negative BOLD physiology is profoundly different than positive BOLD with greater non-linearity.
Introduction
A negative BOLD response is often observed in retinotopically organized early visual cortex. It occurs during visual stimulation in cortical regions that represent unstimulated portions of the visual field. Previous measurements indicate that negative BOLD is the consequence of flow decreases.1 However, negative BOLD is usually evoked by blocked experimental designs that obscure details of their temporal dynamics.To better understand the physiology of the negative BOLD, we used a slow event-related paradigm to elicit strong negative hemodynamic response functions (HRFs) in primary visual cortex. Detailed retinotopy measurements were used to examine the HRFs as a function of eccentricity. We used a modified version of the Arterial Impulse Model (AIM)2 to predict the neurovascular and neurometabolic mechanisms of negative BOLD.Methods
HRFs are elicited by having the subject perform a challenging contrast-discrimination task upon a brief (2–s) high-contrast flickering grating while maintaining fixation. Stimulus aperture is an annular sector (4–6° eccentricity) presented in a single hemifield subtending a 140° polar angle. The subject then performs a non-challenging and infrequent fixation dot color-detection task for 28 s. This cycle is repeated 12 times each run, with 6 runs/session. Stimulated hemifield is alternated left-right from run-to-run. fMRI data is collected using an T2*-weighted EPI sequence obtaining 30 quasi-coronal slices with 2-mm voxels, TR = 1 s, using 2X GRAPPA, 2X SMS acceleration3.
Separately, a high-resolution (0.7-mm voxels) T1-weighted volume was obtained for each subject using MP-RAGE and segmented to delineate cortical gray matter using high-resolution FreeSurfer.4 In another session, we used population receptive field methods to delineate early visual areas and their retinotopic coordinates for each subject.5 Areas V1 and V2 were then subdivided into 1°-wide regions-of-interest (ROIs) by eccentricity (Fig 1).
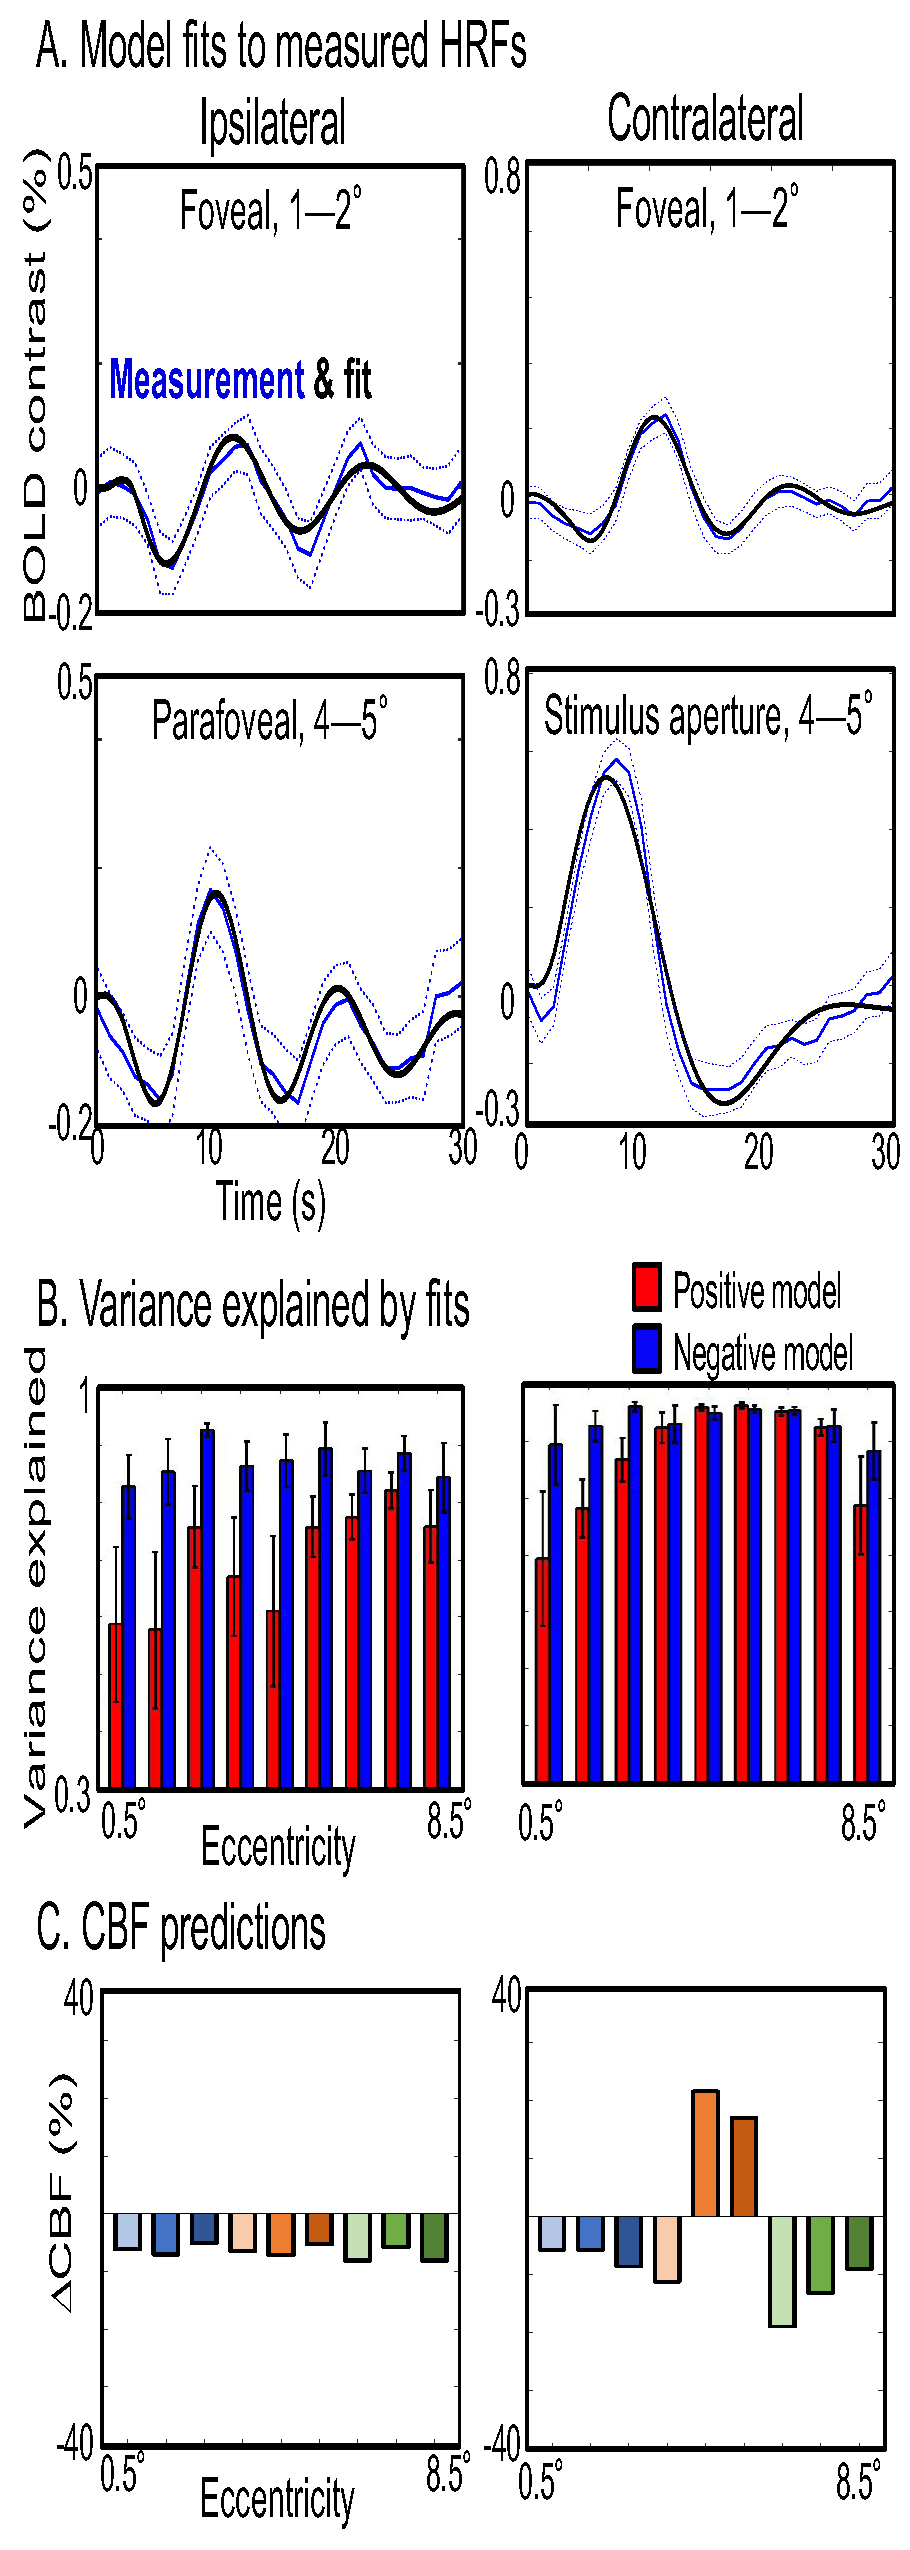
HRF time series are described by a modified version of the AIM. The cerebral blood flow (CBF) kernel was an underdamped sinusoid as described previously,2 but the CMRO2 kernel was characterized as Rect functions with magnitude Γt during the task, Γr during rest periods, then smoothed by a gamma kernel, t exp(-t/τm); task and rest gamma value have opposite signs. Fits used either a positive BOLD assumption, CBF and Γt both positive, or both negative to model negative BOLD.
Results
The contralateral hemifield exhibits strong positive HRFs within the representation of the stimulus aperture (Fig 2A). Outside the aperture, strong HRFs (peak SNR > 2) are broadly evident both contra- and ipsilaterally. Remarkably, most of the HRFs are positive are larger eccentricities, with true negative HRFs only apparent near the fovea. HRF time series (Fig 2B) show an clearly orderly progression by eccentricity on the contralateral side, with strong initial dips and delayed time-to-peak clearly emerging from stimulus aperture-to-fovea. Ipsilateral HRFs are similar in character to contralateral foveal HRFs, but a smaller eccentricity progression is still apparent. Quantitation of HRF parameters by eccentricity (Fig 2C) clearly shows that almost all ipsilateral and foveal contralateral parameters differ significantly from those observed in the stimulus aperture (blue symbols: small, p < 0.05; large, p < 0.01). Initial dips become stronger toward the fovea, and the trend is significant contralaterally. Contralateral time-to-dip increases significantly toward the fovea, and also shows a significant trend ipsilaterally. Time-to-peak also increases significantly toward the fovea. Similar but non-significant trends are also seen peripherally on the contralateral side.
The AIM fit the measured HRFs well (Fig 3A). Ipsilateral and foveal HRFs were best fit by the negative model, and both positive and negative models fit well in the stimulus aperture (Fig 3B). The success of the negative model was largely due to its ability to match the persistent ringing in HRFs outside of the stimulus aperture. The model predicts that the early initial dip is caused by negative CBF, and the subsequent positive peak is caused by a flow overshoot. The ipsilateral CBF response is clearly negative, with ringing, as is the contralateral foveal and possibly peripheral CBF (Fig 3C).
Discussion
The negative BOLD HRF is different than the positive HRF, with a strong and long-lasting initial dip followed by a late positive peak. These HRFs are not linearly consistent with results using longer stimuli6, suggesting a greater degree of non-linearity for negative BOLD. Moreover for short-stimulus experiments, negative HRFs provide another mechanism for the initial dip, and the late positive peak could confound linear analysis.
The AIM explains the unusual HRF features by an underdamped negative flow response together with a CMRO2 reduction. The flow response shows a higher frequency than for the positive HRF, suggesting that such flow inhibitions operate on a smaller, more localized blood pool.
Acknowledgements
Supported by NIH grants: R01 NS095933, R01 EB027586, R21 HL108143, & K25 HL131997. Much thanks to Elizabeth Halfen for her initial efforts on this project.References
1. Shmuel, A., et al. (2002), Neuron 36 (6) 1195-1210.
2. Kim J.H., Ress D. (2016), NeuroImage 124, 394-408.
3. Breuer, F., et al. (2005), Magnetic Resonance in Medicine, 53 (3) 684–691.
4. Zaretskaya, N., et al. (2017), Neuroimage. doi:10.1016/j.neuroimage.2017.09.060
5. Greene, C.A., et al. (2014), Journal of Vision 14 (1) 1-17
6. Wade, A.R. & Rowland, J., (2010), J. Neurosci. 30 (14) 5008-5019
Figures
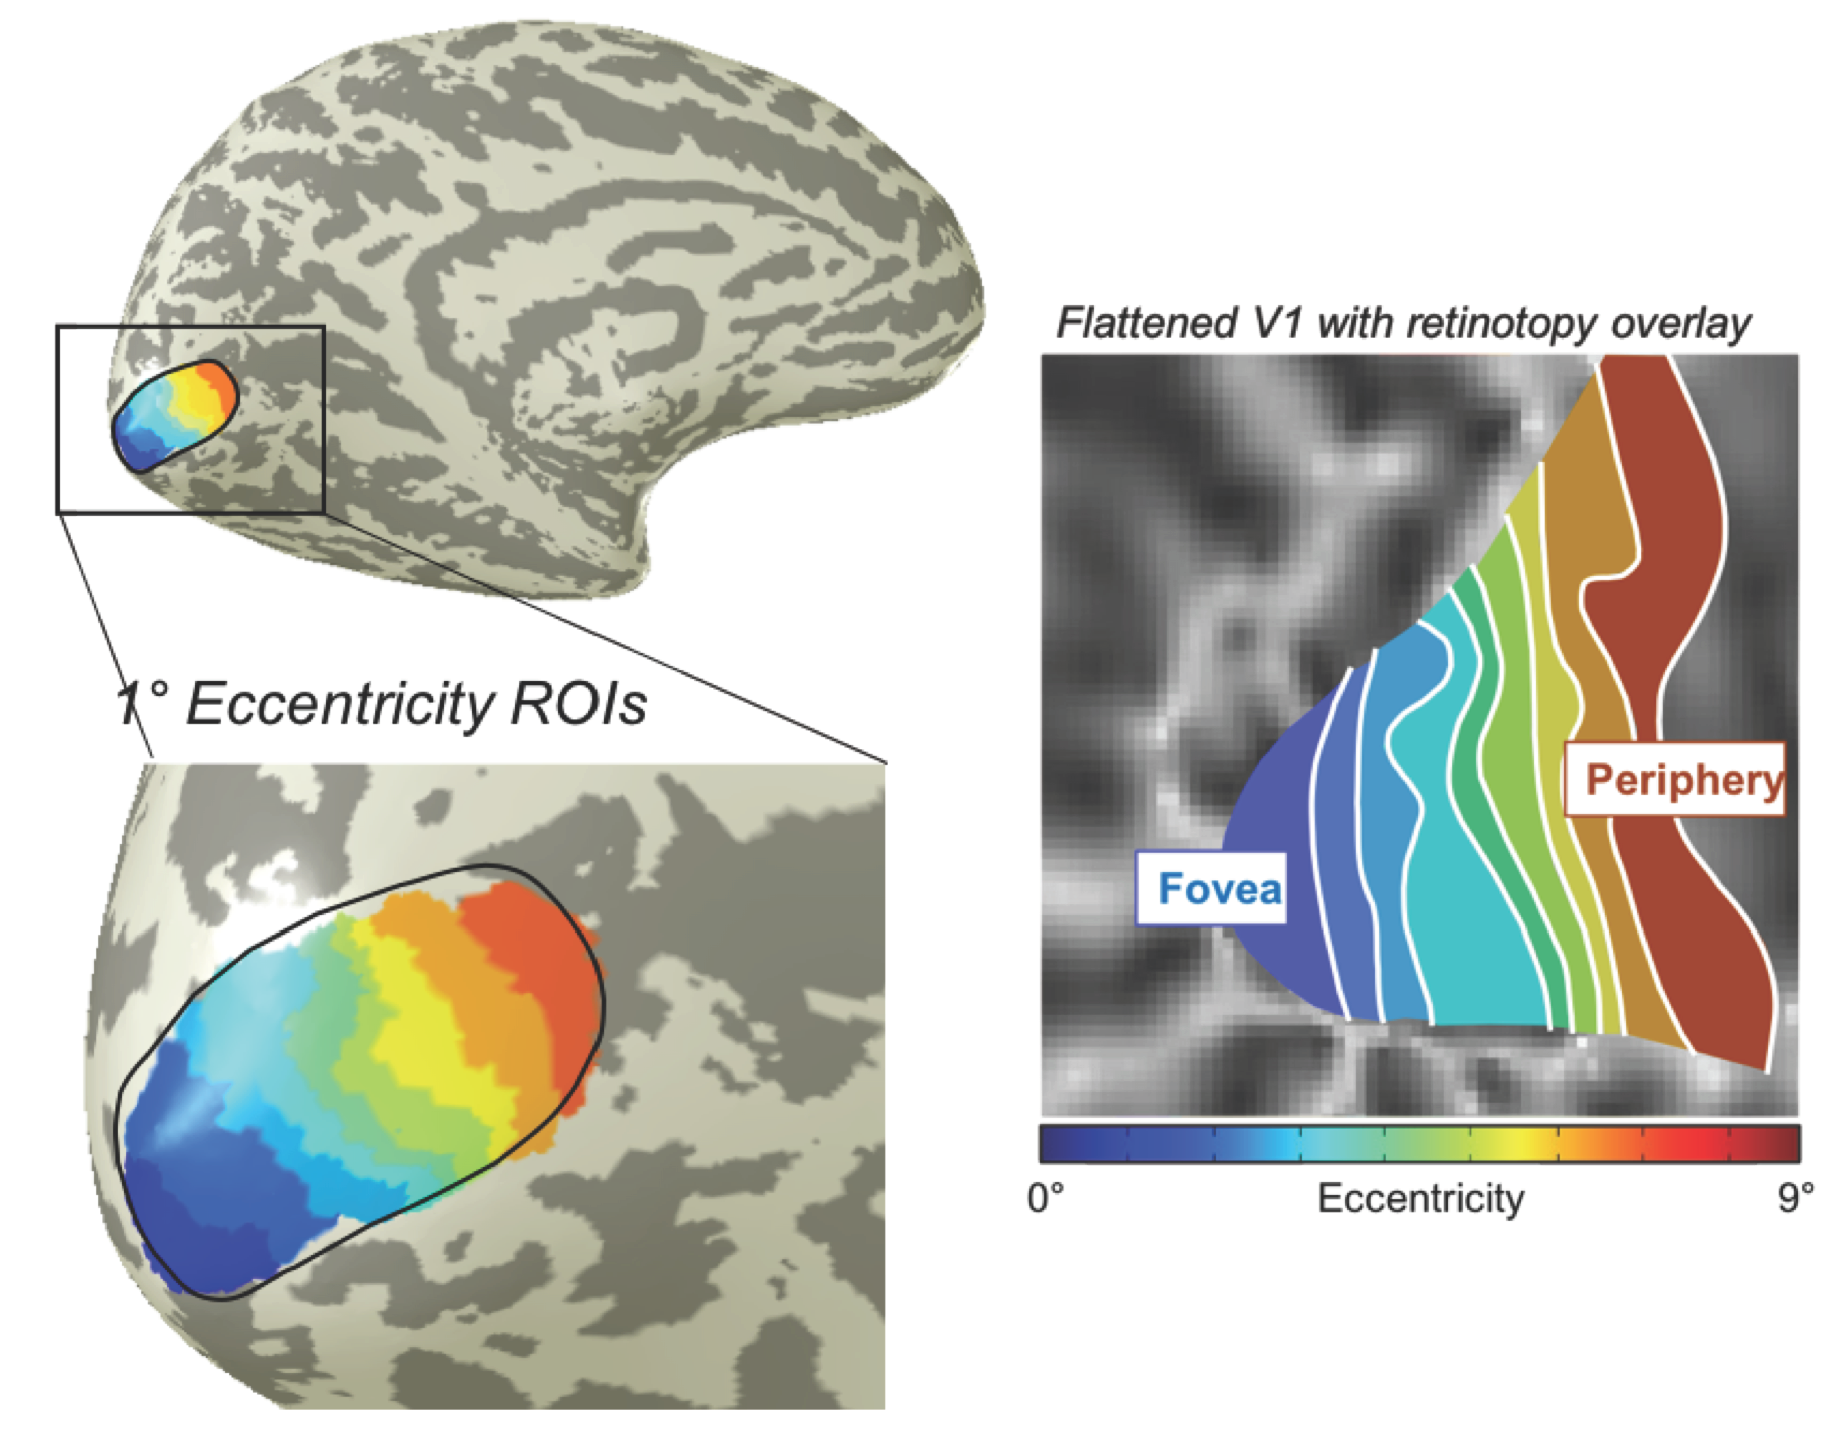
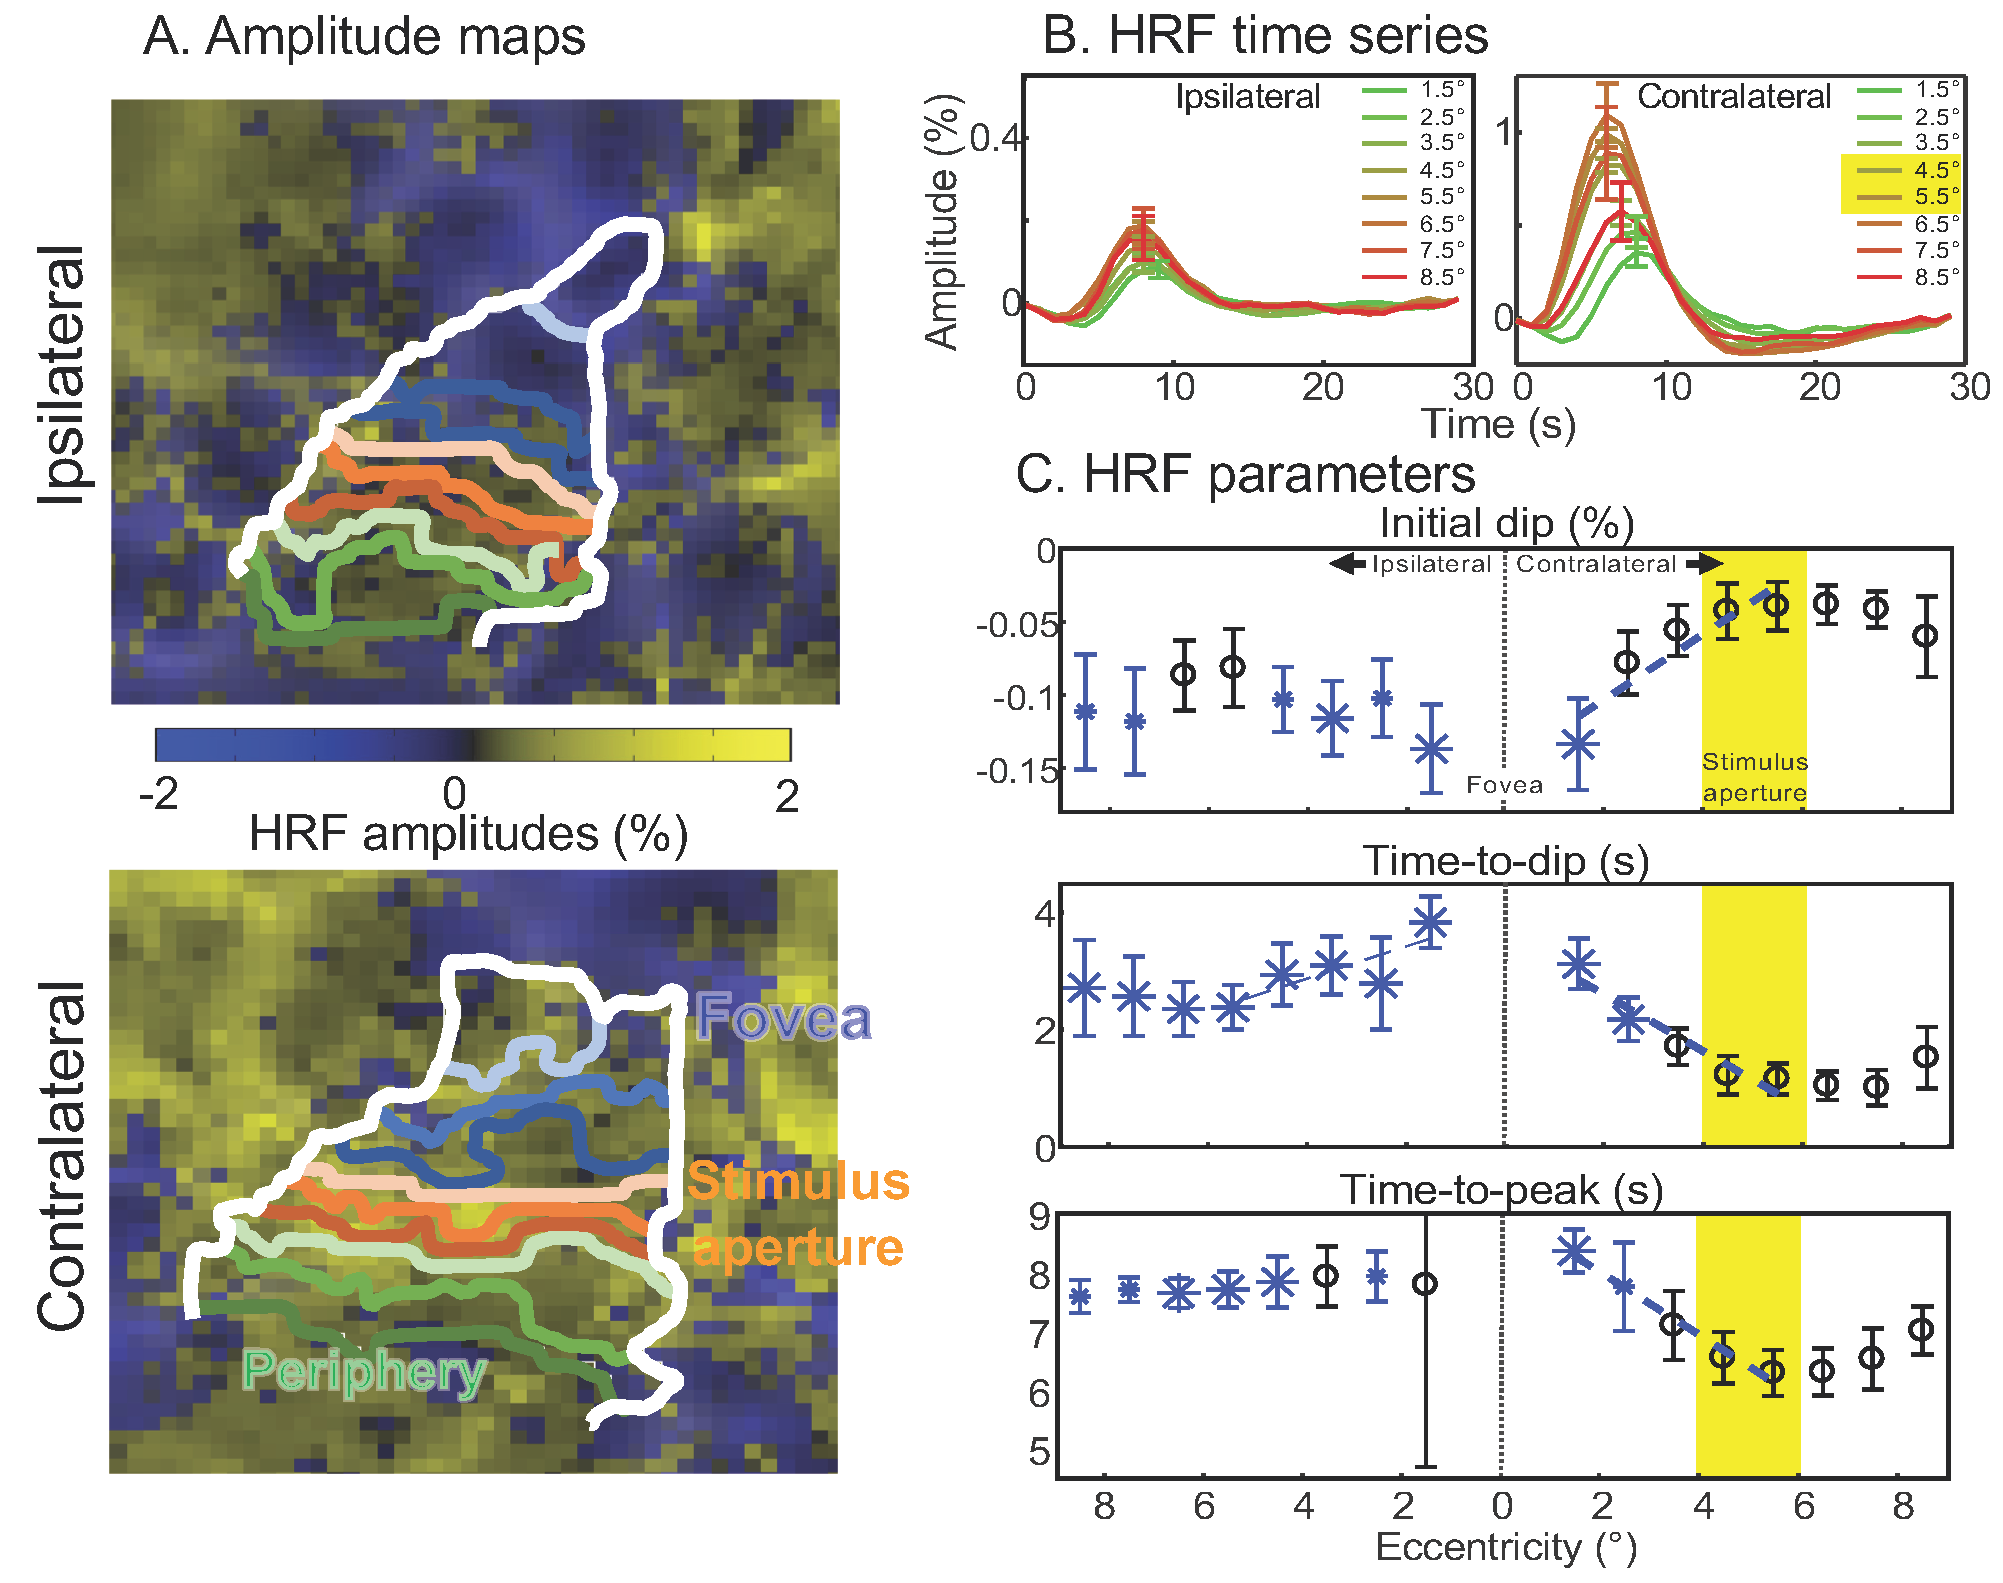
Figure 2: HRF characteristics. A. Sample map of HRF amplitudes on flattened cortex with eccentricity ROIs. HRFs with negative amplitudes are mostly evident near the fovea. B. Contralateral HRF time series show positive HRF in stimulus aperture, transitioning to foveal HRFs with large initial dip and late positive peak. Ipsilateral HRFs look similar to contralateral foveal HRFs. C. HRF parameters significant differences for intial dip amplitude & timing for foveal ROIs compared to the stimulus aperture (blue symbols) with significant foveal-peripheral trends (blue lines). Time-to-peak also shows significant differences and spatial trend.