3712
Improved sensitivity for detecting functional CBF changes by center-out EPI with very short echo time1Max Planck Institute for Human Cognitive and Brain Sciences, Leipzig, Germany
Synopsis
Compared to BOLD imaging, the detection of functional CBF changes by arterial spin labeling is difficult due to the inherently small signal changes in the range of one percent or less. We compared a multi-echo EPI readout to center-out EPI that achieves a very short TE. The reduction of the minimum TE from 9.3 ms (multi-echo EPI) to a value of 1.8 ms (center-out EPI) yielded significantly improved statistical power in the human visual cortex in addition to diminished confounding BOLD and physiological noise contributions.
Purpose
The quantifiability of cerebral blood flow (CBF) changes in regions of neuronal activity is a highly attractive feature of arterial spin labeling (ASL) fMRI when compared to the widely used BOLD imaging1. However, ASL suffers from issues of low sensitivity due to the inherently small signal changes and confounding physiological noise. The echo time (TE) of the readout module provides a means of reducing these effects, and thus, improving the sensitivity to detect subtle CBF changes. In this work, the suitability of a center-out EPI readout dubbed as Double-shot EPI with Center-out Trajectories and Intrinsic NaviGation2 (DEPICTING) for functional ASL studies is investigated. It achieves a significant reduction of the minimum TE compared to conventional EPI.Methods
12 slices located in the human visual cortex (matrix 64×64, voxel size 3×3×4mm3, 0.8mm gap, bandwidth 2kHz/Px) were acquired on a Siemens 3T MAGNETOM Prisma scanner. For multi-echo (ME) EPI, three echoes with TE1/TE2/TE3 of 9.3/26.3/43.3ms, partial Fourier of 6/8 and GRAPPA factor of 2 were acquired, while a non-accelerated single-echo readout with TE=1.8ms was employed for DEPICTING. Pseudo-continuous ASL3, 4 (pCASL) with a labeling duration of 1.5s and a post-labeling delay of 1.2s was used. Functional runs consisted of 50 control-label pairs with TR of 3.5s. A 10Hz black-and-white flickering checkerboard was presented for 35s as visual stimulation and contrasted with a blank black screen of the same duration. Functional time series were first realigned using SPM12. For ME-EPI, motion correction of all echoes was performed based on the estimated realignment parameters of the first echo. A temporal high-pass filter with a cutoff frequency of 1/140 Hz (i.e., 2 stimulation cycles) was then applied, followed by a 2D spatial Gaussian filter (3mm FWHM). Additionally, time series of the parameters T2* and S0fit were derived for ME-EPI by linear regression. A geometric distortion correction was not performed due to the small B0 offsets in the visual cortex and sufficiently short total acquisition times. Statistical analysis was performed by a general linear model (GLM) that included the ASL difference during rest, its change during activation, and the BOLD signal change as regressors5. CBF was quantified based on a two-compartment model6, 7.Results
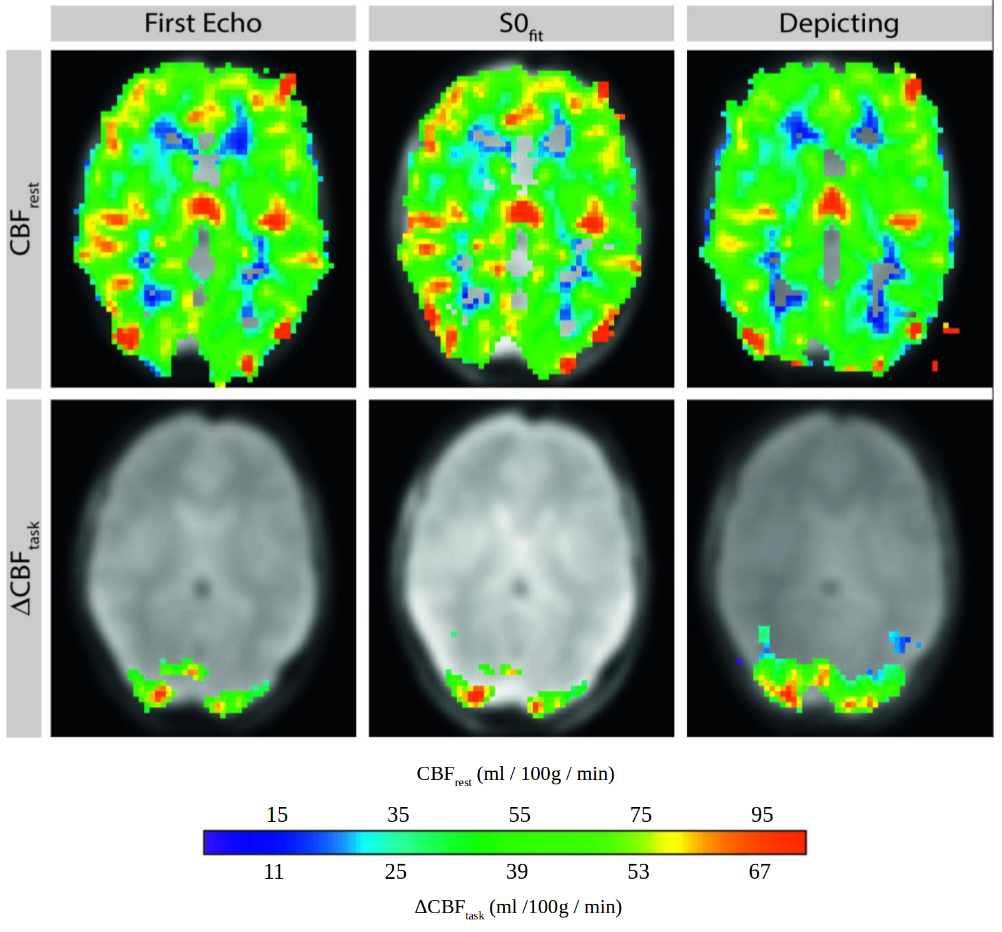
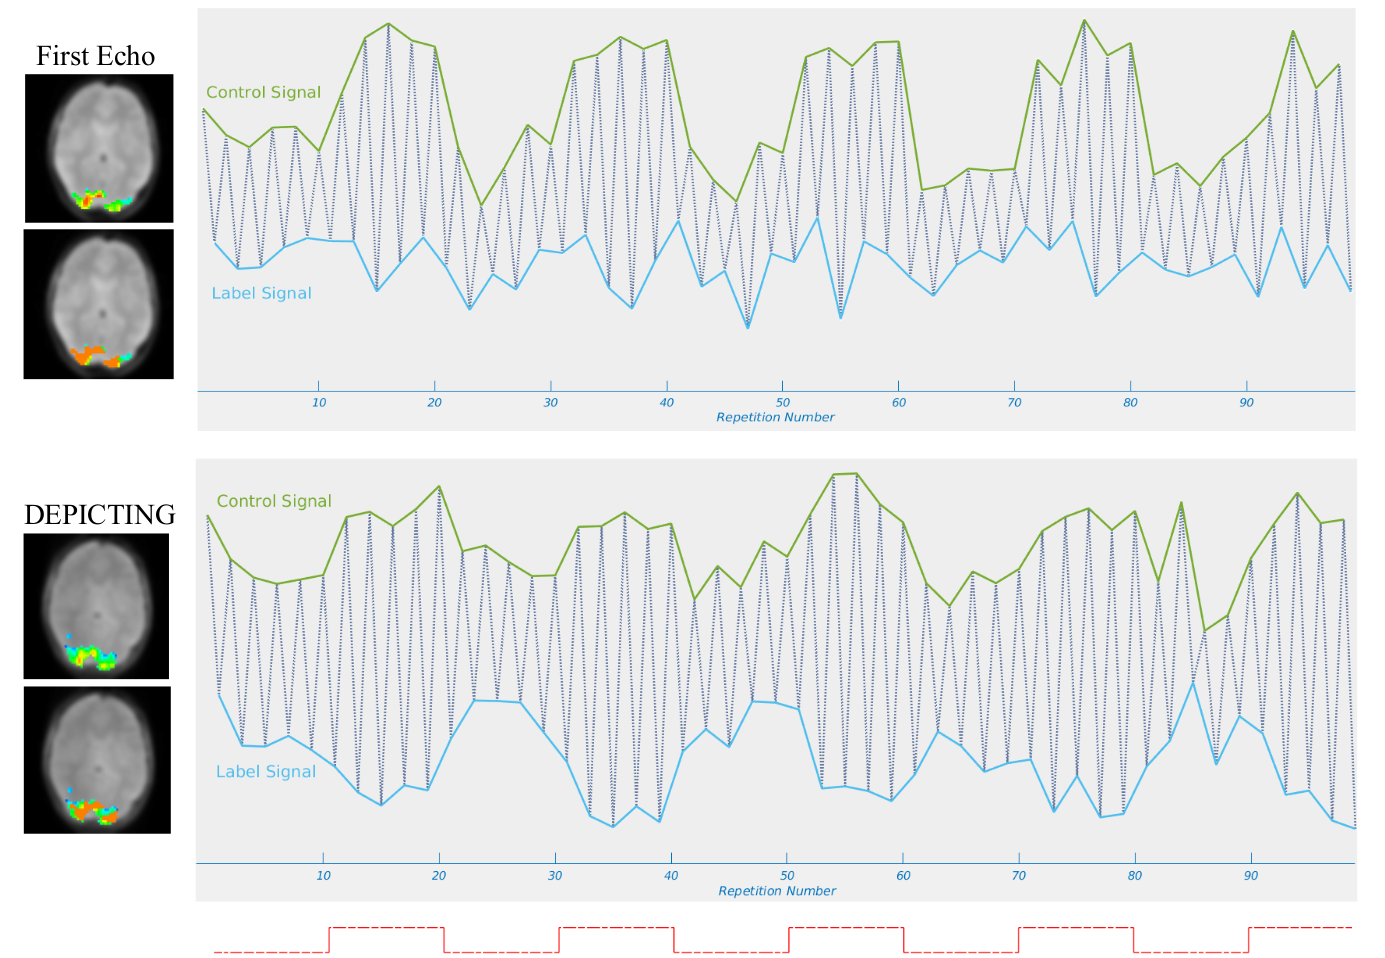
Figure 1 shows TE-dependent BOLD and CBF activation maps for the single echoes of ME-EPI. In contrast to BOLD-fMRI, a strong enhancement in sensitivity for detecting CBF changes is observed with decreasing TE. As DEPICTING achieves a five-fold reduction of the minimum TE compared to ME-EPI (9.3→1.8ms), a concomitant improvement of statistical power is expected. In Figure 2, CBF maps obtained at rest and regions with activation-induced CBF increase are shown at p<0.05 (corrected) for the first-echo, S0fit and DEPICTING. The resting ASL signal (top) was significant in gray matter for all methods whereas the extent of a significant functional CBF increase (bottom) was about twice as large for DEPICTING compared to both, the first-echo and the fitted signal S0fit extrapolated to TE=0. Table 1 provides details of the statistical analysis for all functional runs in two subjects. Mean values of CBFrest and ΔCBFtask agreed well with those reported in the literature8. Example time series of the first-echo and the DEPICTING scans from an activated overlapping brain region are presented in Figure 3. The elevated baseline signal during activation hints at the susceptibility of the first-echo to task-related BOLD and concomitant physiological noise effects, whereas minimal baseline signal change is visible for DEPICTING.Discussion
In this work, the DEPICTING readout-module was employed in a functional pCASL study. This achieved a substantial TE reduction to only 1.8ms. As effects from physiological noise are known to scale with TE,2,6 the observed sensitivity gain for functional CBF changes obtained with DEPICTING is reasonable. This improvement is quantified by the considerably larger activated ROIs and lower mean standard errors in Table 1. The CBFrest and ΔCBFtask values also show a better reproducibility for DEPICTING when repeated experiments are compared. We note that sophisticated processing techniques9 to remove the physiological noise contamination were not applied in this study. These methods are expected to have a positive impact mainly for ME-EPI. The sensitivity gain for DEPICTING, however, will persist especially at increasing image resolutions, because larger acquisition matrices are possible without relevant increases of the minimum TE.2Acknowledgements
References
1. Detre JA, Wang J. Technical aspects and utility of fMRI using BOLD and ASL. Clin Neurophysiol, 2002. 113(5): 621-34.
2. Hetzer S, Mildner T, Möller HE. A modified EPI sequence for high-resolution imaging at ultra-short echo time. Magn Reson Med, 2011. 65(1): 165-75.
3. Alsop DC, Detre JA, Golay X, Günther M, et al. Recommended implementation of arterial spin-labeled perfusion MRI for clinical applications: A consensus of the ISMRM perfusion study group and the European consortium for ASL in dementia. Magn Reson Med, 2015. 73(1): 102-16.
4. Lorenz K, Mildner T, Schlumm T, Möller HE. Characterization of pseudo-continuous arterial spin labeling: Simulations and experimental validation. Magn Reson Med, 2018. 79(3): 1638-1649.
5. Hernandez-Garcia L, Jahanian H, Rowe DB. Quantitative analysis of arterial spin labeling FMRI data using a general linear model. Magn Reson Imaging, 2010. 28(7): 919-27.
6. Wang J, Alsop DC, Li L, Listerud J, et al. Comparison of quantitative perfusion imaging using arterial spin labeling at 1.5 and 4.0 Tesla. Magn Reson Med, 2002. 48(2): 242-54.
7. Mildner T, Müller K, Hetzer S, Trampel R, et al. Mapping of arterial transit time by intravascular signal selection. NMR Biomed, 2014. 27(5): 594-609.
8. Kastrup A, Li TQ, Glover GH, Krüger G, et al. Gender differences in cerebral blood flow and oxygenation response during focal physiologic neural activity. J Cereb Blood Flow Metab, 1999. 19(10): 1066-71.
9. Cohen AD, Nencka AS, Wang Y. Multiband multi-echo simultaneous ASL/BOLD for task-induced functional MRI. PLoS One, 2018. 13(2): e0190427.
Figures