3711
Increased Blood-Brain Barrier Water Permeability in the Visual Cortex in Response to Visual Stimulation1Biomedical Engineering, Stony Brook University, Stony Brook, NY, United States, 2Radiology, Stony Brook University, Stony Brook, NY, United States
Synopsis
Evidence of cell swelling upon activation has been observed in early diffusion functional MRI studies, and has been attributed to the co-transported water due to transient changes in ionic transmembrane flux. Blood-brain barrier (BBB) water permeability is also believed to be a marker of cerebral metabolism. Here we provide an initial investigation of visual stimulation on BBB water permeability parameters, water extraction fraction (Ew) and permeability surface area product (PSw), using the recently developed Intrinsic Diffusivity Encoding of Arterial Labeled Spins (IDEALS). Significant increase of PSw were observed with no change of Ew in the visual cortex during visual stimulation.
Introduction
Studying the movement of water during brain activation could help improve understanding of neuronal activation mechanisms. Evidence of cell swelling upon activation has been observed in early diffusion functional MRI studies, and has been attributed to the co-transported water due to transient changes in ionic transmembrane flux1. The effects of neuronal activation on cerebral blood flow (CBF) and cerebral metabolic rate of oxygen (CMRO2) are well characterized, describing a substantial increase of CBF with moderate increase of CMRO22-4. Blood-brain barrier (BBB) water permeability is also believed to be a marker of cerebral metabolism5-9. Here we provide an initial investigation into the effect of visual stimulation on BBB water permeability parameters, water extraction fraction (Ew) and water permeability surface area product (PSw), using the recently developed Intrinsic Diffusivity Encoding of Arterial Labeled Spins (IDEALS) technique10,11.Methods
Four healthy participants were recruited with IRB approval and informed consent. All studies were performed on a Siemens 3T Prisma MRI with 64-channel head/neck coil. In the IDEALS paradigm, intravascular and extravascular ASL water are separated by their different diffusion sensitivities at two segmentation factors in 3D-GRASE acquisition12. IDEALS-fMRI was acquired with the following parameters: TR/TE/Label Time = 4500/16.12/1600 ms, FA = 120°, matrix of 64×64×32, FOV of 256×256×128 mm3, iPAT2. Two segmentation schemes (4PAR×2PE and 1PAR×2PE) and two PLDs (1000 ms and 2000 ms) were used for a total of 4 sets of ASL images. The IDEALS-fMRI visual stimulation task consisted of 7, 5-minute blocks, each containing 2.5 minutes of crosshair fixation followed by 2.5 minutes of flashing checkerboard (8 Hz). The 8 blocks resulted in 2.5 minutes of 1000 ms PLD data with 4PAR×2PE and 1PAR×2PE, 5 minutes of 2000 ms PLD data with 1PAR×2PE, and 7.5 minutes of 2000 ms PLD data with 4PAR×2PE for each condition (flashing checkerboard and crosshair fixation). Conventional 2D-EPI BOLD-fMRI was acquired to determine the activated region due to limited visual field in the scanner. The parameters were: TR/TE = 2000/30 ms, FA = 90°, matrix of 70×70, FOV of 224×224 mm2, 30-3.2 mm contiguous slices. The BOLD-fMRI visual stimulation task consisted of 4, 40-second blocks, each containing 20 seconds of crosshair fixation followed by 20 seconds of flashing checkerboard (8 Hz).
IDEALS-fMRI data were processed using Matlab and SPM. Images for the same condition with the same parameters (i.e. PLD and segmentation scheme) were combined. The arterial transit time (ATT) was estimated from the 1000 ms PLD data. CBF, Ew, and PSw were subsequently estimated from the 2000 ms PLD data. BOLD-fMRI data were processed using FSL. Regions of interest (ROIs) were defined for each subject by coregistering the BOLD-fMRI z-score maps to the IDEALS images then thresholding for z>3 with cluster corrected p<0.05. Paired t-tests were used to test for significant differences in BBB water permeability parameters during rest and visual stimulation; p<0.05 was considered significant.
Results
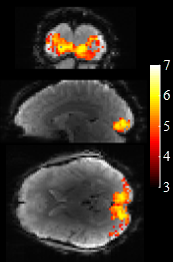
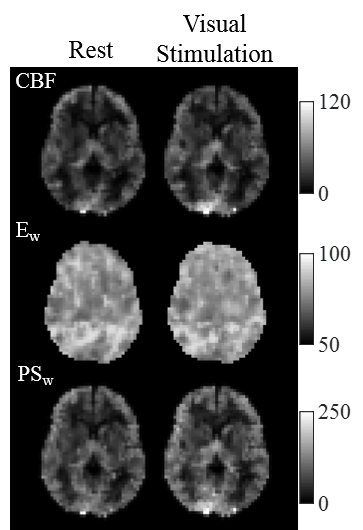
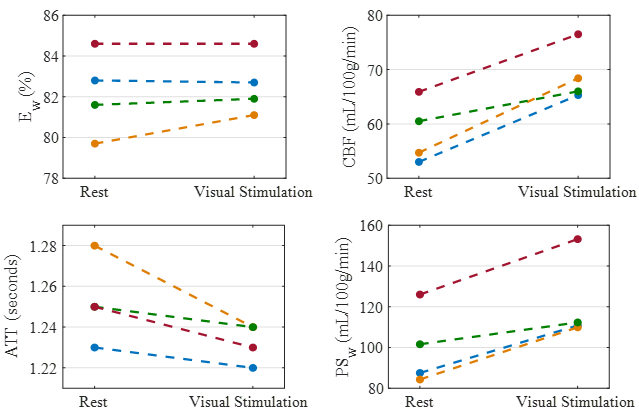
Figure 1 shows the activated region from a representative subject. Figure 2 displays the derived IDEALS-fMRI parameter maps from a representative subject during rest and visual stimulation. Noticeable increases of CBF and PSw in the visual cortex can be seen. Figure 3 shows the ladder plots of CBF, ATT, Ew, and PSw from the visual cortex ROI (determined from BOLD-fMRI) for the 4 subjects. In this study, visual stimulation significantly increased CBF (+18.3% ± 7.3%) and PSw. (+22.3% ± 8.6%). Also, the estimated ATT decreased significantly (-1.7% ± 1.1%) and the estimated Ew increased slightly, but not significantly (+0.5% ± 0.9%). The relative increase of PSw in response to visual stimulation was significantly larger than the relative increase of CBF (24.3% ± 9.0% higher for PSw).Discussion
The observed increase of CBF and decrease of ATT during visual stimulation are consistent with previous studies13-16. Although the duration of each condition in our visual stimulation task was relatively long (2.5 minutes), it has been reported that activation estimated from ASL is stable over a wide range of condition lengths (30 seconds – 1 hour)17. The observed increase of PSw during visual stimulation is consistent with reports that transmembrane water exchange is driven by metabolically active pathways such as NaK-ATPase5-7. Interestingly, the increase of PSw was greater than the increase of CBF; this contrasts with previous findings that CMRO2 increases less than CBF during visual stimulation2-4. These results suggest that increased PSw during visual stimulation may reflect increased neuronal activity.Conclusion
Changes to BBB water permeability in response to visual stimulation were measured using the IDEALS approach. Significant increases of CBF and PSw were observed with no change of Ew in the visual cortex.Acknowledgements
No acknowledgement found.References
1. Le Bihan D. The ‘wet mind’: water and functional neuroimaging. Physics in Medicine & Biology. 2007;52(7):R57.
2. Fox PT, Raichle ME. Focal physiological uncoupling of cerebral blood flow and oxidative metabolism during somatosensory stimulation in human subjects. Proceedings of the National Academy of Sciences. 1986;83(4):1140-1144.
3. Hoge RD, Atkinson J, Gill B, Crelier GR, Marrett S, Pike GB. Linear coupling between cerebral blood flow and oxygen consumption in activated human cortex. Proceedings of the National Academy of Sciences. 1999;96(16):9403-9408.
4. Uludağ K, Dubowitz DJ, Yoder EJ, Restom K, Liu TT, Buxton RB. Coupling of cerebral blood flow and oxygen consumption during physiological activation and deactivation measured with fMRI. Neuroimage. 2004;23(1):148-155. 5. Bai R, Springer Jr CS, Plenz D, Basser PJ. Fast, Na+/K+ pump driven, steady‐state transcytolemmal water exchange in neuronal tissue: A study of rat brain cortical cultures. Magnetic resonance in medicine. 2018;79(6):3207-3217.
6. Bai R, Springer Jr CS, Plenz D, Basser PJ. Brain active transmembrane water cycling measured by MR is associated with neuronal activity. Magnetic resonance in medicine. 2018.
7. Zhang Y, Poirier-Quinot M, Springer CS, Balschi JA. Active trans-plasma membrane water cycling in yeast is revealed by NMR. Biophysical journal. 2011;101(11):2833-2842.
8. Rooney WD, Li X, Sammi MK, Bourdette DN, Neuwelt EA, Springer CS. Mapping human brain capillary water lifetime: high‐resolution metabolic neuroimaging. NMR in Biomedicine. 2015;28(6):607-623.
9. S. SC, Xin L, A. TL, et al. Intratumor mapping of intracellular water lifetime: metabolic images of breast cancer? NMR in Biomedicine. 2014;27(7):760-773.
10. He X, Wengler K, Duong T, Schweitzer M. 3D MRI Mapping of Whole-Brain Water Permeability with Intrinsic Diffusivity Encoding of Arterial Labeled Spins (IDEALS). In Proceedings of the 27th Annual Meeting of ISMRM, Paris. 2018;0180.
11. Wengler K, Ha J, Coyle P, Schweitzer M, Duong T, He X. Blood Brain Barrier Water Permeability in Non-Enhancing Multiple Sclerosis Lesion with Intrinsic Diffusivity Encoding of Arterial Labeled Spins (IDEALS). In Proceedings of the 27th Annual Meeting of ISMRM, Paris. 2018;4921.
12. He X, Wengler K, Schweitzer ME. Diffusion sensitivity of 3D‐GRASE in arterial spin labeling perfusion. Magnetic resonance in medicine. 2018;80(2):736-747.
13. Li T-Q, Haefelin TN, Chan B, et al. Assessment of hemodynamic response during focal neural activity in human using bolus tracking, arterial spin labeling and BOLD techniques. Neuroimage. 2000;12(4):442-451.
14. Gonzalez‐At JB, Alsop DC, Detre JA. Cerebral perfusion and arterial transit time changes during task activation determined with continuous arterial spin labeling. Magnetic Resonance in Medicine: An Official Journal of the International Society for Magnetic Resonance in Medicine. 2000;43(5):739-746.
15. Hendrikse J, Lu H, Van der Grond J, Van Zijl PC, Golay X. Measurements of cerebral perfusion and arterial hemodynamics during visual stimulation using TURBO‐TILT. Magnetic Resonance in Medicine: An Official Journal of the International Society for Magnetic Resonance in Medicine. 2003;50(2):429-433.
16. Yang Y, Engelien W, Xu S, Gu H, Silbersweig DA, Stern E. Transit time, trailing time, and cerebral blood flow during brain activation: measurement using multislice, pulsed spin‐labeling perfusion imaging. Magnetic Resonance in Medicine: An Official Journal of the International Society for Magnetic Resonance in Medicine. 2000;44(5):680-685.
17. Wang J, Aguirre GK, Kimberg DY, Roc AC, Li L, Detre JA. Arterial spin labeling perfusion fMRI with very low task frequency. Magnetic Resonance in Medicine: An Official Journal of the International Society for Magnetic Resonance in Medicine. 2003;49(5):796-802.
Figures