3710
The neurovascular response is attenuated by focused ultrasound-mediated disruption of the blood-brain barrier1Brigham and Women's Hospital, Boston, MA, United States, 2Harvard Medical School, Boston, MA, United States, 3Boston Children's Hospital, Boston, MA, United States
Synopsis
Focused ultrasound (FUS) disruption of the blood-brain barrier (BBB) is a promising technology for achieving targeted delivery of pharmacological agents into the brain. While the method has been shown to be safe from the standpoint of not damaging tissue cells, it causes other changes to local physiology that are not fully understood. This study aims to characterize the effects on the hemodynamic response that FUS BBB opening causes. We present BOLD and CBF fMRI results to investigate the particular mechanisms within the neurovascular response responsible for this effect.
Introduction
Focused ultrasound (FUS) disruption of the blood-brain barrier (BBB) is a non-invasive technique that has been used for targeted delivery of a wide variety of therapeutic and neuroactive agents into the brain1-2. In addition to making the cerebral vasculature permeable to large molecules, recent studies have shown that FUS-BBB opening also has several secondary effects on local tissue that alters neuronal and vascular physiology2-5.
This abstract is a continuation of a study that was presented at the 2018 ISMRM where we demonstrated that FUS-BBB opening attenuated changes in the hemodynamic response to an external stimulus as measured by BOLD and cerebral blood flow (CBF) signals in rats. The neurovascular response is a complicated array of mechanisms consisting of multiple signaling pathways exist from both neurons and astrocytes to the local vasculature and retrograde signaling through the vasculature to induce vasodilation of upstream arterioles6-7. Here, we present further results to better isolate the particular mechanism responsible for the observed phenomenon of the attenuated hemodynamic response following FUS-BBB opening.
Methods
Study design: N = 9 Sprague Dawley rats underwent sham and actual FUS-BBB opening followed by imaging protocol 1. N = 3 rats underwent FUS-BBB opening followed by imaging protocols 2 and 3. All images were acquired on a Bruker 7T small animal scanner.
BBB opening. BBB disruption was targeted to the right somatosensory cortex (S1) in one hemisphere only using Optison microbubbles (200 μl/kg) and a 690 kHz FUS transducer (10 ms bursts, 1 Hz, 120 seconds).
Imaging 1: BOLD and CBF. Block designed hind paw stimulation fMRI sessions were performed with BOLD and ASL data acquisition. BOLD data was acquired with a single shot EPI sequence (TR = 1.5 s, TE = 18 ms, 18 slices, 0.5 x 0.5 x 1.0 mm resolution, 325 images); ASL data was acquired with a continuous ASL sequence with single shot EPI readout (TR = 3000 ms, TE = 15.5 ms, 2000 ms labeling duration, 350 ms post-label delay, interleaved label/control, 1 2mm thick slice) and converted to CBF. Signal change time courses over the stimulus block were extracted from the non-targeted left S1 region and the targeted right S1 region.
Imaging 2: Cortical Depth BOLD: High resolution BOLD images were acquired during a similar stimulus fMRI session for analysis of cortical depth effects (TR = 1.0 s, TE = 18 ms, 18 slices, 0.25 x 0.25 x 1.2 mm resolution, 480 images).
Imaging 3: Carbogen gas challenge: BOLD images were acquired during 3 blocks of switching between medical air (78% Nitrogen, 21% oxygen for 3 minutes) and carbogen (95% oxygen, 5% carbon dioxide for 1 minute) in order to induce a vascular response that was not initiated by neuronal activity. The same BOLD imaging parameters were used as in imaging protocol 1.
Results
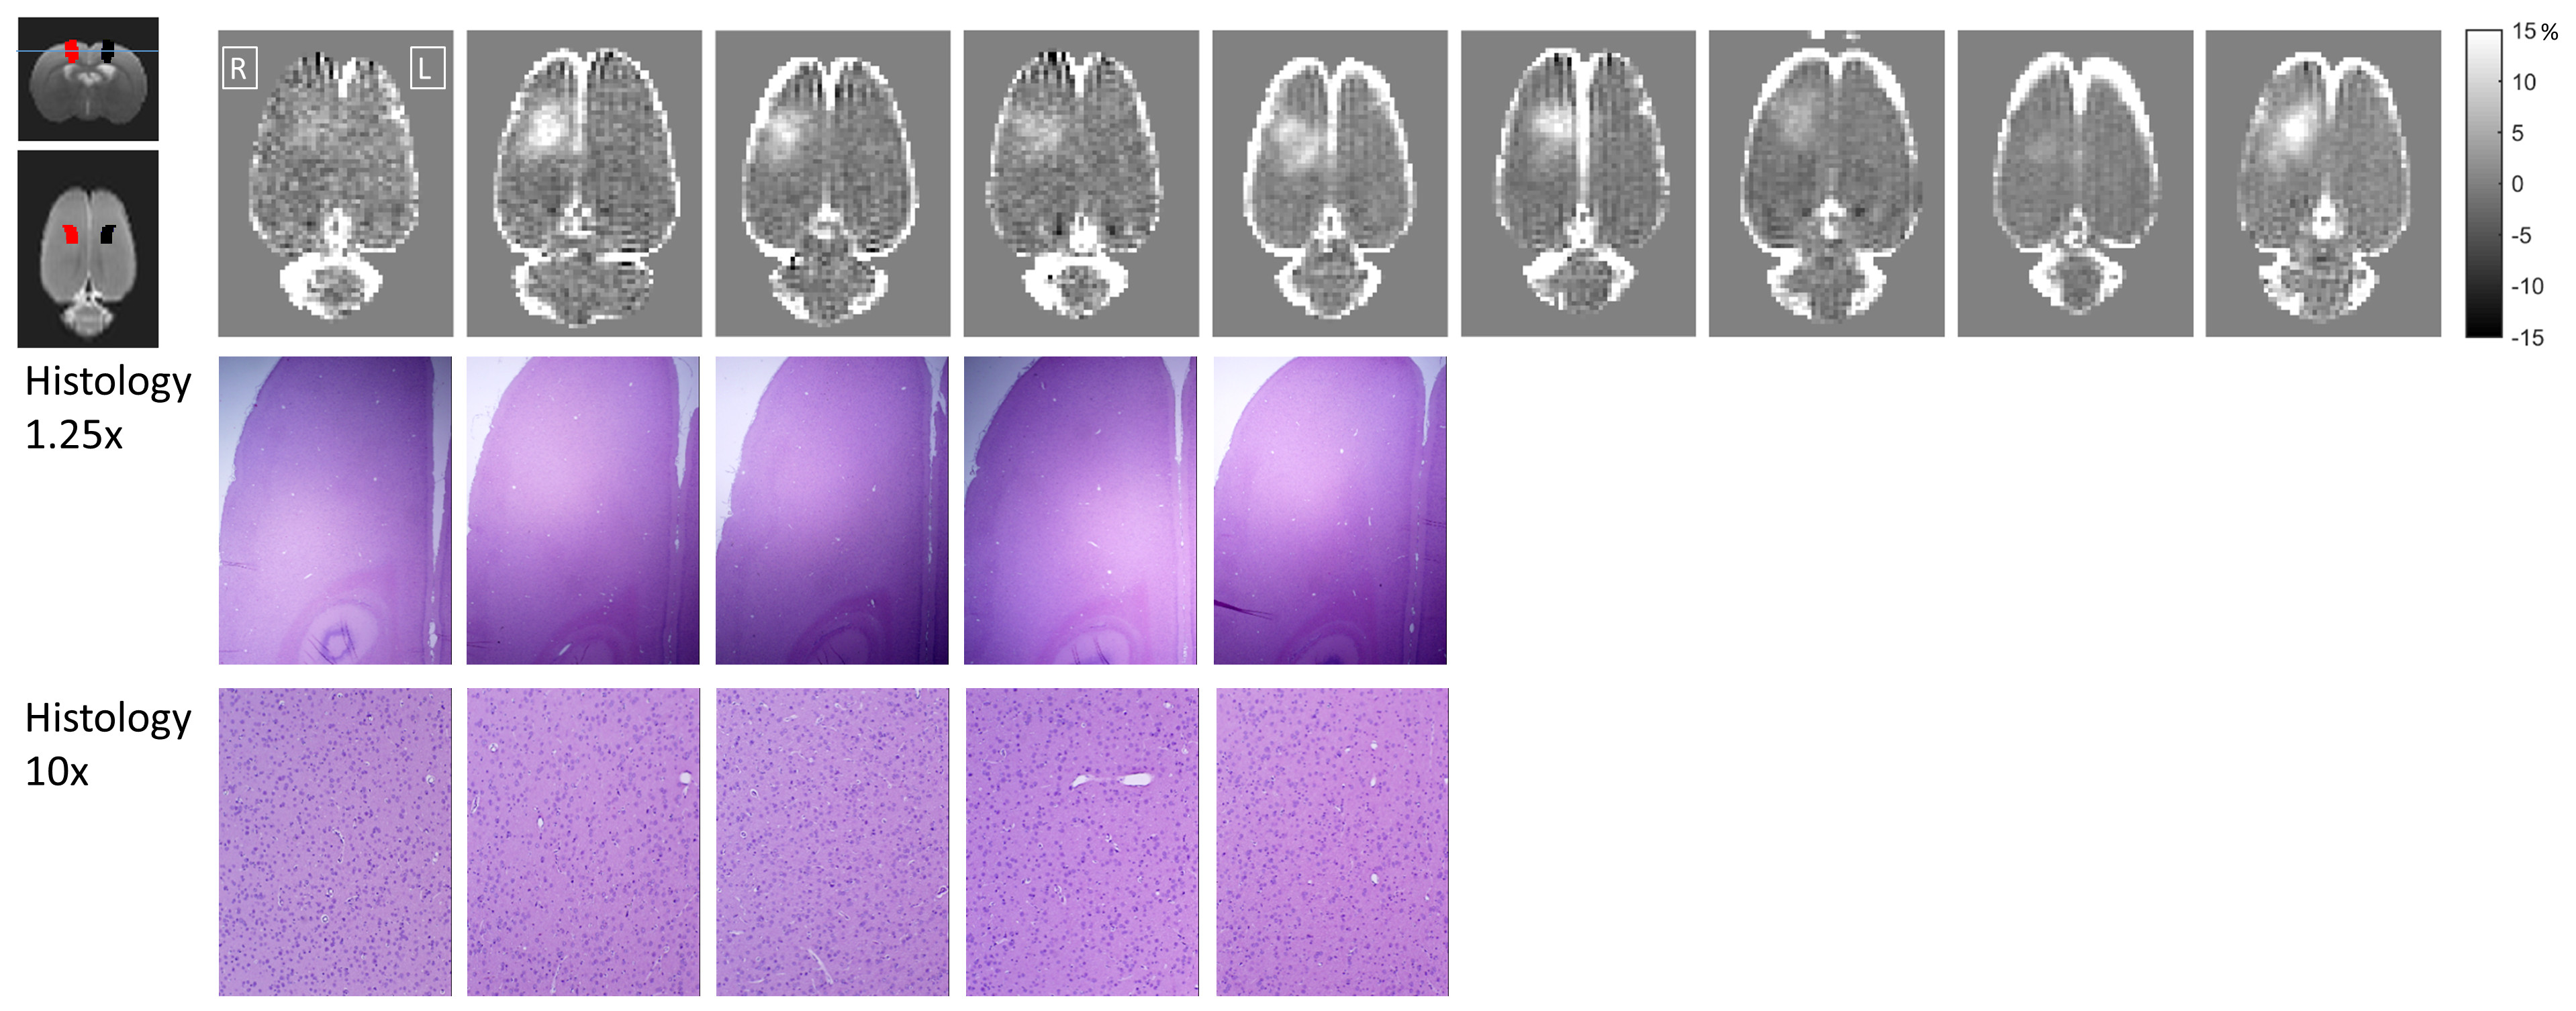
Figure 1 shows T1-weighted contrast images depicting the extent and location of BBB opening achieved in each of the 9 rats from Imaging 1, with histology performed on the first 5 rats showing no signs of tissue damage in the FUS targeted region.
Figure 2 shows the BOLD and CBF time courses in response to the stimulus for cases of BBB closed and BBB open. As previously reported, BBB opening attenuates both the BOLD and CBF changes in terms of amplitude and duration. The baseline CBF values are not different between the left and right S1 regions.
Figures 3 shows the cortical depth results from the high resolution BOLD imaging. In two of three rats, the BOLD signal change near the pial surface is not as strong in the targeted right S1 region, potentially indicating less contribution to the BOLD signal change from surface vessels.
Figure 4 shows the results of gas challenge experiments. An attenuation in the BOLD response is still seen in the right S1 region, but only in amplitude, not duration.
Discussion and Conclusions
When imaged 1-2 hours after BBB opening, there is no difference in baseline CBF values between the targeted and non-targeted S1 regions, indicating that the vessels are not in a state of continuous dilation or constriction. However, it is clear that the neurovascular response to an external stimulus is attenuated in the region of BBB opening. The carbogen imaging experiments suggest that the phenomenon cannot be entirely due to suppressed neuronal activity or a breakdown in neurovascular signaling. The cortical depth results showing reduced BOLD changes towards the pial surface indicate a possible breakdown in the vascular retrograde signaling mechanisms that recruit enhanced blood flow from upstream arterioles.Acknowledgements
NIH grants K01EB023983 and P01CA17464501.References
1. Hynynen, K. et al., 2001. Noninvasive MR imaging-guided focal opening of the blood-brain barrier in rabbits. Radiology, 220(3), pp.640–6.
2. M. Aryal, C. D. Arvanitis, P. M. Alexander, and N. McDannold, “Ultrasound-mediated blood-brain barrier disruption for targeted drug delivery in the central nervous system.,” Adv. Drug Deliv. Rev., vol. 72, pp. 94–109, Jun. 2014
3. Chu, P. et al., 2015. Neuromodulation accompanying focused ultrasound-induced blood-brain barrier opening. Scientific Reports, 5:15477.
4. Downs, M. et al., 2015. Blood-Brain Barrier Opening in Behaving Non-Human Primates via Focused Ultrasound with Systemically Administered Microbubbles. Scientific Reports, 5:15076.
5. Kovacs, Z.I., et al., 2017. Proc. Natl. Acad. Sci. 114, E75–E84
6. Hillman, E., 2014. Coupling Mechanism and Significance of the BOLD Signal: A Status Report Annual Review Neuroscience. 37:161-181.
7. Iadecola, C., 2017. The Neurovascular Unit Coming of Age: A Journey through Neurovascular Coupling in Health and Disease. Neuron 96, September 27.
Figures