3709
The temporal stability of BOLD is improved by calibrating the cerebral vascular reactivity underpinned by the vascular probability within the group1Institute of Biomedical Engineering, National Taiwan University, Taipei, Taiwan, 2Department of Medical Imaging, Taipei Medical University - Shuang-Ho Hospital, New Taipei, Taiwan, 3Graduate Institute of Biomedical Electronics and Bioinformatics, National Taiwan University, Taipei, Taiwan, 4Department of Neuroscience and Biomedical Engineering, Aalto University, Espoo, Finland, 5Department of Medical Biophysics, University of Toronto, Toronto, ON, Canada
Synopsis
We hypothesize that the local venule vasculature underlies the BOLD signal latency and its variability. This hypothesis was tested by measuring the BOLD signal in the human primary visual cortex with a 10-Hz sampling rate during a visuomotor and a breath-holding (BH) task. A venule probability (VP) map was estimated by susceptibility-weighted images. We found that VP was significantly correlated to the relative BOLD latency and relative latency variability during the visuomotor task. These correlations disappeared after subtracting the latency in the BH task from the latency in the visuomotor task. These results support our hypothesis.
INTRODUCTION
The blood oxygenation-level-dependent (BOLD) signal varies significantly across subjects, brain regions, and repetitive measurements1-4. The BOLD signal is highly weighted by venous oxygenation changes5,6. The latency in the BOLD dynamics is closely related to the transit time of oxygenated blood5 and the expansion of the venous drainage system7,8. Based on previous studies, here we hypothesize that the local venule vasculature underlies the BOLD signal latency and its variability. To test this hypothesis, we used high temporal resolution simultaneous-multi-slice inverse imaging (SMS-InI)9 to record the BOLD signal in the human visual cortex with 10-Hz sampling rate. To correct bias related to cerebral vascular reactivity, BOLD signal latency was mapped and calibrated by a breath-holding (BH) task10. Meanwhile, we also estimated a venule probability (VP) map. Via the correlation between these two structural and physiological measures, we aimed at revealing how the regional venule vasculature is related to the dynamics and variability of the BOLD signal within a group.METHODS
Data were collected on a 3T MRI scanner (Skyra, Siemens) from 14 healthy subjects with written informed consents approved by the Institute Reviewing Board. SMS-InI measured the BOLD signal with 100 ms temporal precision, 5 mm isotropic spatial resolution, and whole-brain coverage11. Each subject participated a BH and a visuomotor task during fMRI scans. The BH challenge was preceded by paced breathing (43s; 2s/cycle; visually cued) followed by 2-s exhalation and then 15-s breath holding. The hemodynamic latency revealed by the BH was used to subtract the BOLD signal latency due to vascular (non-neural) response10. Forty trials of checkerboard flashing (1-s duration; 8-Hz reversal rate) were randomly presented to participants (20 left and 20 right hemifield) in 240s. The primary visual cortex (V1) region-of-interest (ROIs) was identified between the intersection of brain area showing significant BOLD signal and the probabilistic labels provided by FreeSurfer12,13.
Voxel-wise hemodynamic latencies were measured by correlating between the fMRI time series at each voxel and a reference time series14. The latencies measured in the BH task was subtracted from that in the visuomotor task in order to reduce the confounds caused by vascular reactivity. We also calculated BOLD amplitude and temporal variability across subjects. Vasculature was measured by the vesselness method15-17 based on susceptibility-weighted images (SWI; TR/TE = 27/20 ms, flip angle = 15°, Voxel size = 0.86x0.86x1.5 mm3, FOV = 22x20x12 cm3). The vesselness method allows us to visualize the venous vascular tree across the brain (Figure 1: middle). Structural images for each subject were also acquired using a 3D T1-weighted sequence (MP-RAGE). The VP map (Figure 1: right; Figure 2: top) were generated by estimating the probability of venules at each location across all participants. Finally, we calculated the linear regression between VP and latency as well as latency variability of BOLD signal at V1.
RESULTS
VP was significantly positively correlated to V1 BOLD signal amplitude (R2 = 0.049; p < 0.001; Figure 3A), amplitude variability (R2 = 0.081; p < 0.001; Figure 3B), and latency variability (R2 = 0.048; p < 0.001; Figure 3D) during the BH task. It was significantly negatively correlated to the V1 BOLD signal latency (R2 = 0.110; p < 0.001; Figure 3C) during the BH task. VP was also significantly correlated to relative latency (R2 = 0.084; p < 0.001; Figure 4A) and relative latency variability (R2 = 0.072; p < 0.001; Figure 4B) of the V1 BOLD signal during the visuomotor task. However, VP was no longer correlated significantly with relative latency (R2 = 0.007; p = 0.189; Figure 4C) and relative latency variability (R2 = 0.001; p = 0.999; Figure 4D) after subtracting the latency in the BH task from the latency in the visuomotor task.DISCUSSION & CONCLUSION
The positive correlation between vascular structure (VP) and functional features (amplitude and latency as well as their variabilities) corroborated with the previous studies18,19. The negative correlation between BOLD response latency and VP suggested that the faster BOLD signal is likely caused by more venule contribution. After subtracting the vascular latency (estimated from the BH task) from the task latency (estimated from the visuotmotor task), neither BOLD latency nor BOLD latency variability was correlated with VP. The results supports that the vasculature contributes to the anatomical source of temporal instability of the BOLD response. Taken together, the temporal stability of BOLD signal across participants can be empirically improved by calibrating individual’s cerebral vascular reactivity (CVR), which is underpinned by vascular probability within the group.Acknowledgements
This work was partially supported by Ministry of Science and Technology, Taiwan (103-2628-B-002-002-MY3, 105-2221-E-002- 104), the National Health Research Institutes, Taiwan (NHRI-EX107-10727EI), and the Academy of Finland (No. 298131).References
1 Aguirre G. K., Zarahn E. & D'Esposito M.Neuroimage.1998; 8:360-369.
2 D'Esposito M., Zarahn E., Aguirre G. K. et al.Neuroimage.1999; 10:6-14.
3 Handwerker D. A., Ollinger J. M. & D'Esposito M.Neuroimage.2004; 21:1639-1651.
4 Huettel S. A., Singerman J. D. & McCarthy G.Neuroimage.2001; 13:161-175.
5 Leonard B. E.Hum. Psychopharmacol. Clin. Exp.,2002; 17:433-433.
6 Keilholz S. D., Silva A. C., Raman M. et al.Magn. Reson. Med.,2006; 55:316-324.
7 Buxton R. B., Wong E. C. & Frank L. R.Magn. Reson. Med.,1998; 39:855-864.
8 Mandeville J. B., Marota J. J., Ayata C. et al.J. Cereb. Blood Flow Metab.,1999; 19:679-689.
9 Chu Y. H., Hsu Y. C. & Lin F. H.Proc Intl Soc Magn Reson Med.2016; 946.
10 Chang C., Thomason M. E. & Glover G. H.Neuroimage.2008; 43:90-102.
11 Hsu Y.-C., Chu Y.-H., Tsai S.-Y. et al.Sci. Rep.,2017; 7:17019.
12 Fischl B., Rajendran N., Busa E. et al.Cereb. Cortex.2008; 18:1973-1980.
13 Hinds O. P., Rajendran N., Polimeni J. R. et al.Neuroimage.2008; 39:1585-1599.
14 Li Y.-T., Wu P.-Y., Lu J. T.-Y. et al. Proc. Intl. Soc. Mag. Reson. Med. 26., 2018; p. 148.
15 Frangi A. F., Niessen W. J., Vincken K. L. et al. in International Conference on Medical Image Computing and Computer-Assisted Intervention. 130-137.
16 Descoteaux M., Collins L. & Siddiqi K. in International Conference on Medical Image Computing and Computer-Assisted Intervention. 500-507.
17 Descoteaux M., Collins D. L. & Siddiqi K.Med. Image Anal.,2008; 12:497-513.
18 Vigneau‐Roy N., Bernier M., Descoteaux M. et al.Hum. Brain Mapp.,2014; 35:1906-1920.
19 Li Y.-T., Lin J.-F. L., Wu P.-Y. et al. Proc. Intl. Soc. Mag. Reson. Med. 25., 2017; p. 5257.
Figures
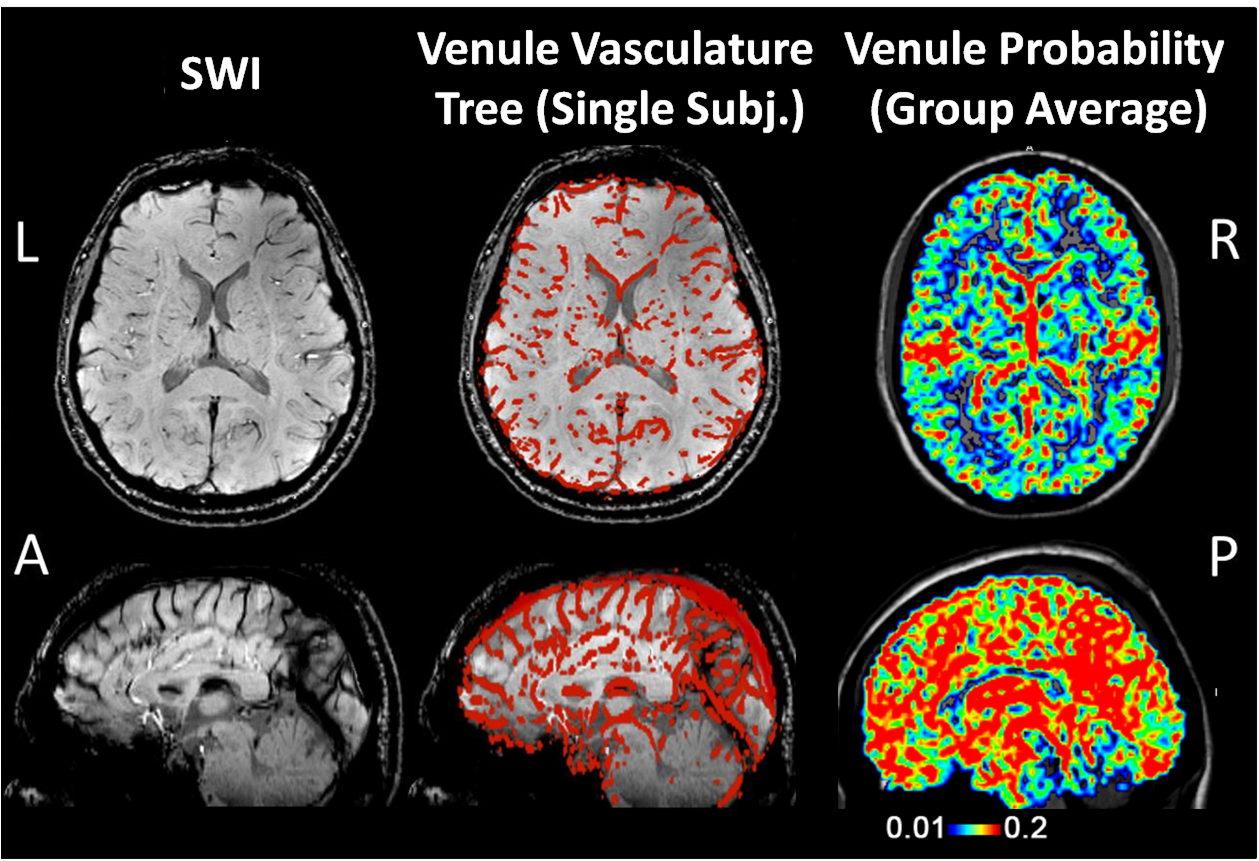
Figure 1. Segmented venules from a single subject, and the group-averaged venule probability map
Left: Susceptibility weighted imaging (SWI).
Middle: The segmented venule (red) overlaid on SWI.
Right: The venule probability (VP) map.
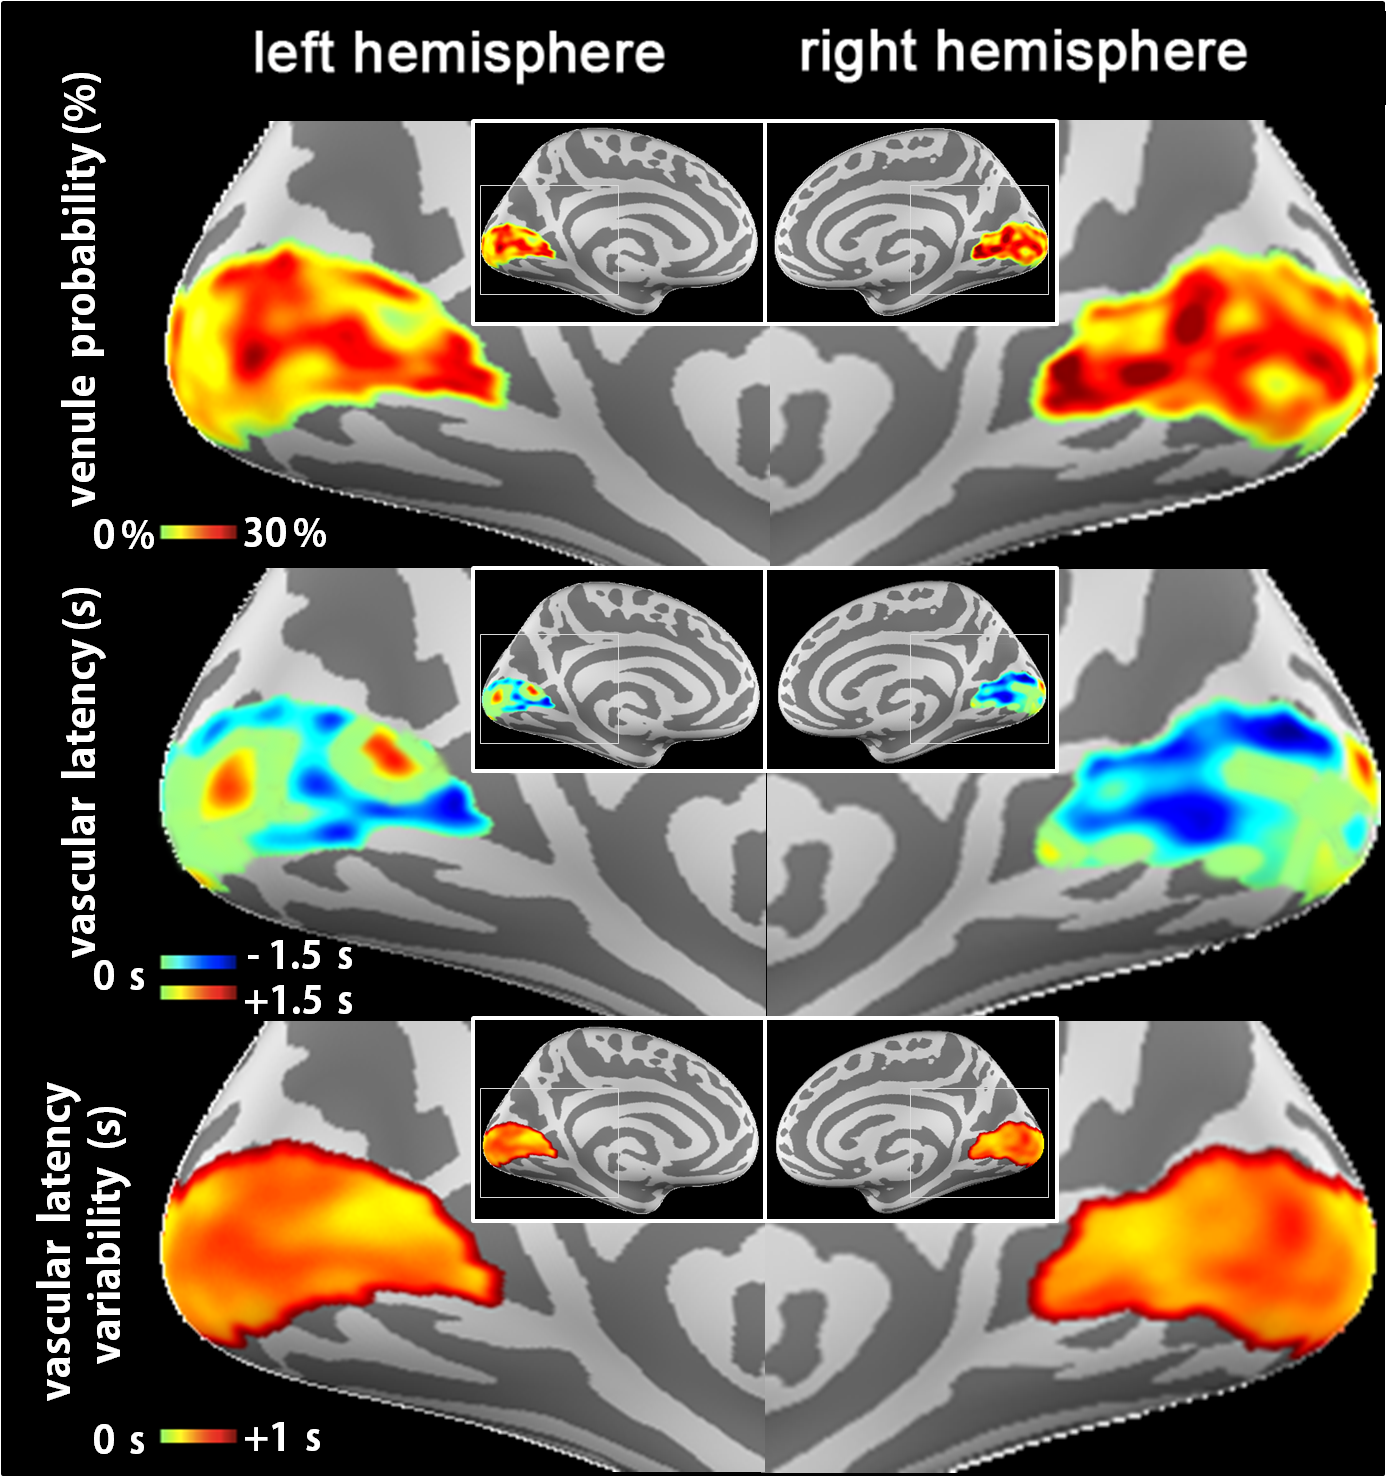
Figure 2. Venule probability (VP), vascular latency, and vascular latency variability map
Top: the VP map.
Middle: Vascular latency calculated from the BH task. Negative values indicate the local BOLD signal latency faster than the whole-brain average latency.
Bottom: Vascular latency variability calculated from the BH task across subjects.
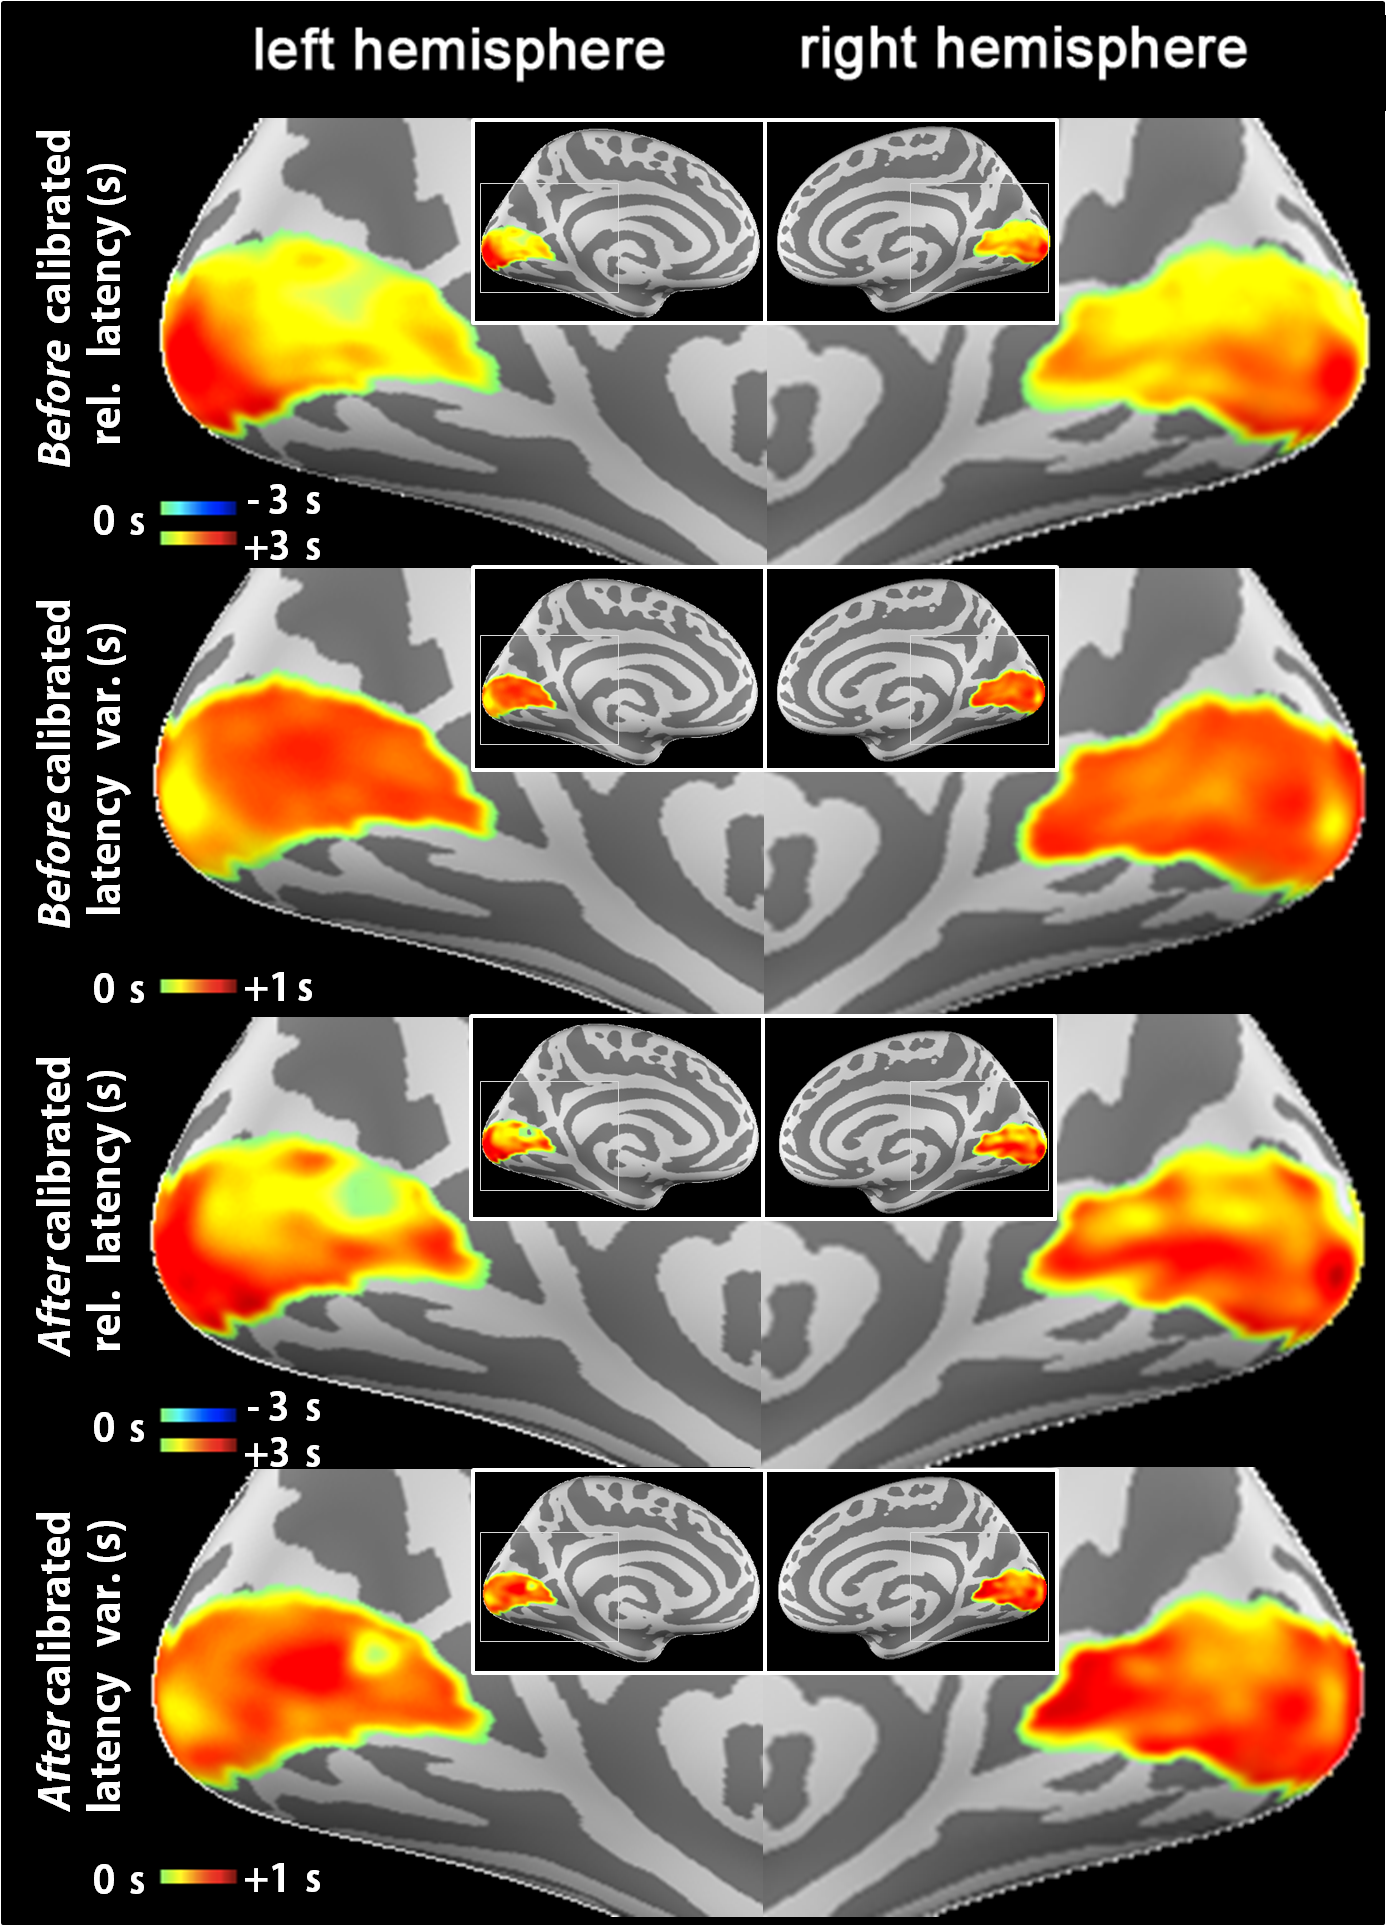
Figure 3. BOLD relative latency, and temporal variability map calculated before and after calibrated the vascular reactivity
Top row: BOLD relative latency calculated from visuomotor task before vascular reactivity calibration. Negative values indicate the local BOLD signal latency faster than the whole-brain average latency.
Second row: BOLD temporal variability calculated from visuomotor task before vascular reactivity calibration across subjects.
Third row: BOLD relative latency calculated from visuomotor task after vascular reactivity calibration. Negative values indicate the local BOLD signal latency faster than the whole-brain average latency.
Bottom row: BOLD temporal variability calculated from visuomotor task after vascular reactivity calibration across subjects.
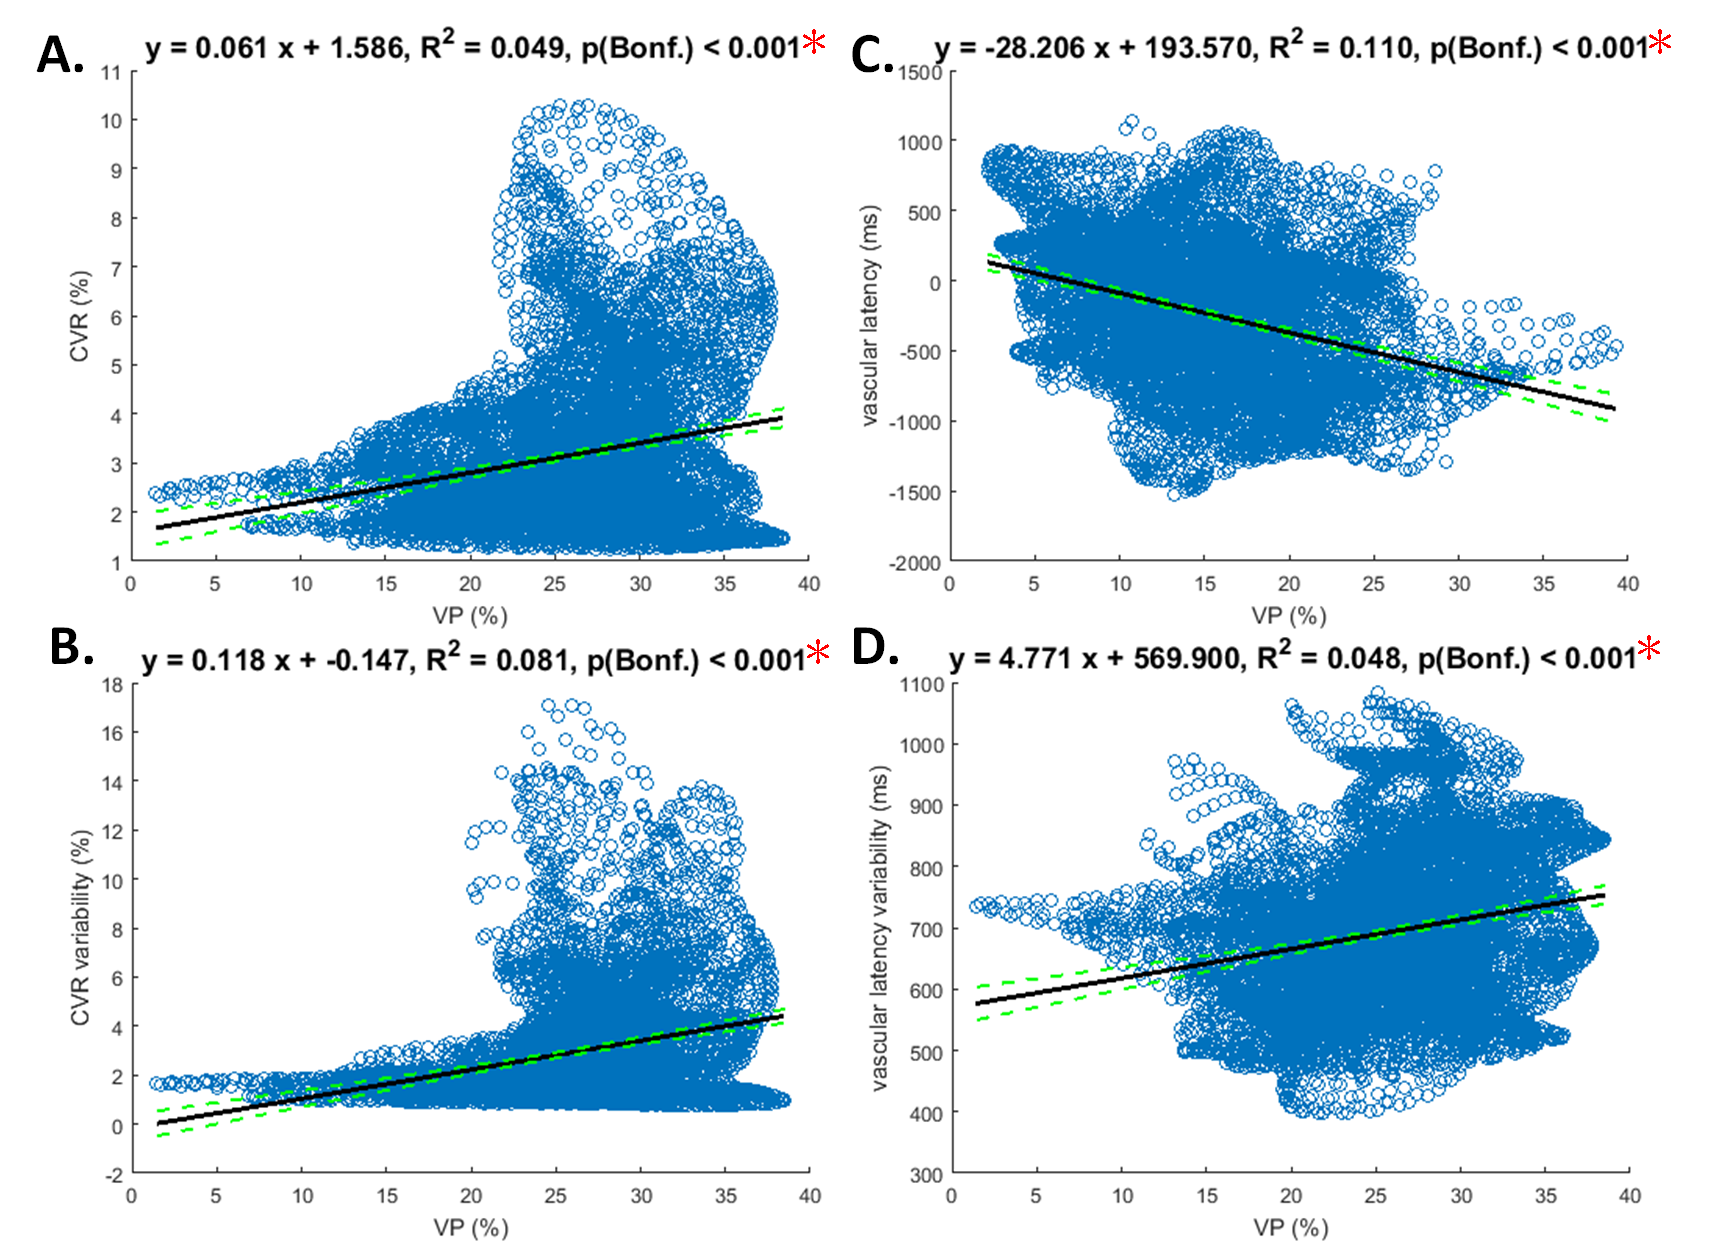
Figure 4. Linear regression relation between venule probability (VP) and cerebral vascular reactivity (CVR), relative latency as well as variability of the BOLD dynamics in the BH task
A: Significant positive correlation between VP and CVR (BH task amplitude) within V1.
B: Significant positive correlation between VP and vascular amplitude variability within V1.
C: Significant negative correlation between VP and vascular latency (BH task latency) within V1.
D: Significant positive correlation between VP and vascular temporal variability within V1.
Note that Significant correlations after Bonferroni correction for multiple testing are indicated by red asterisks.
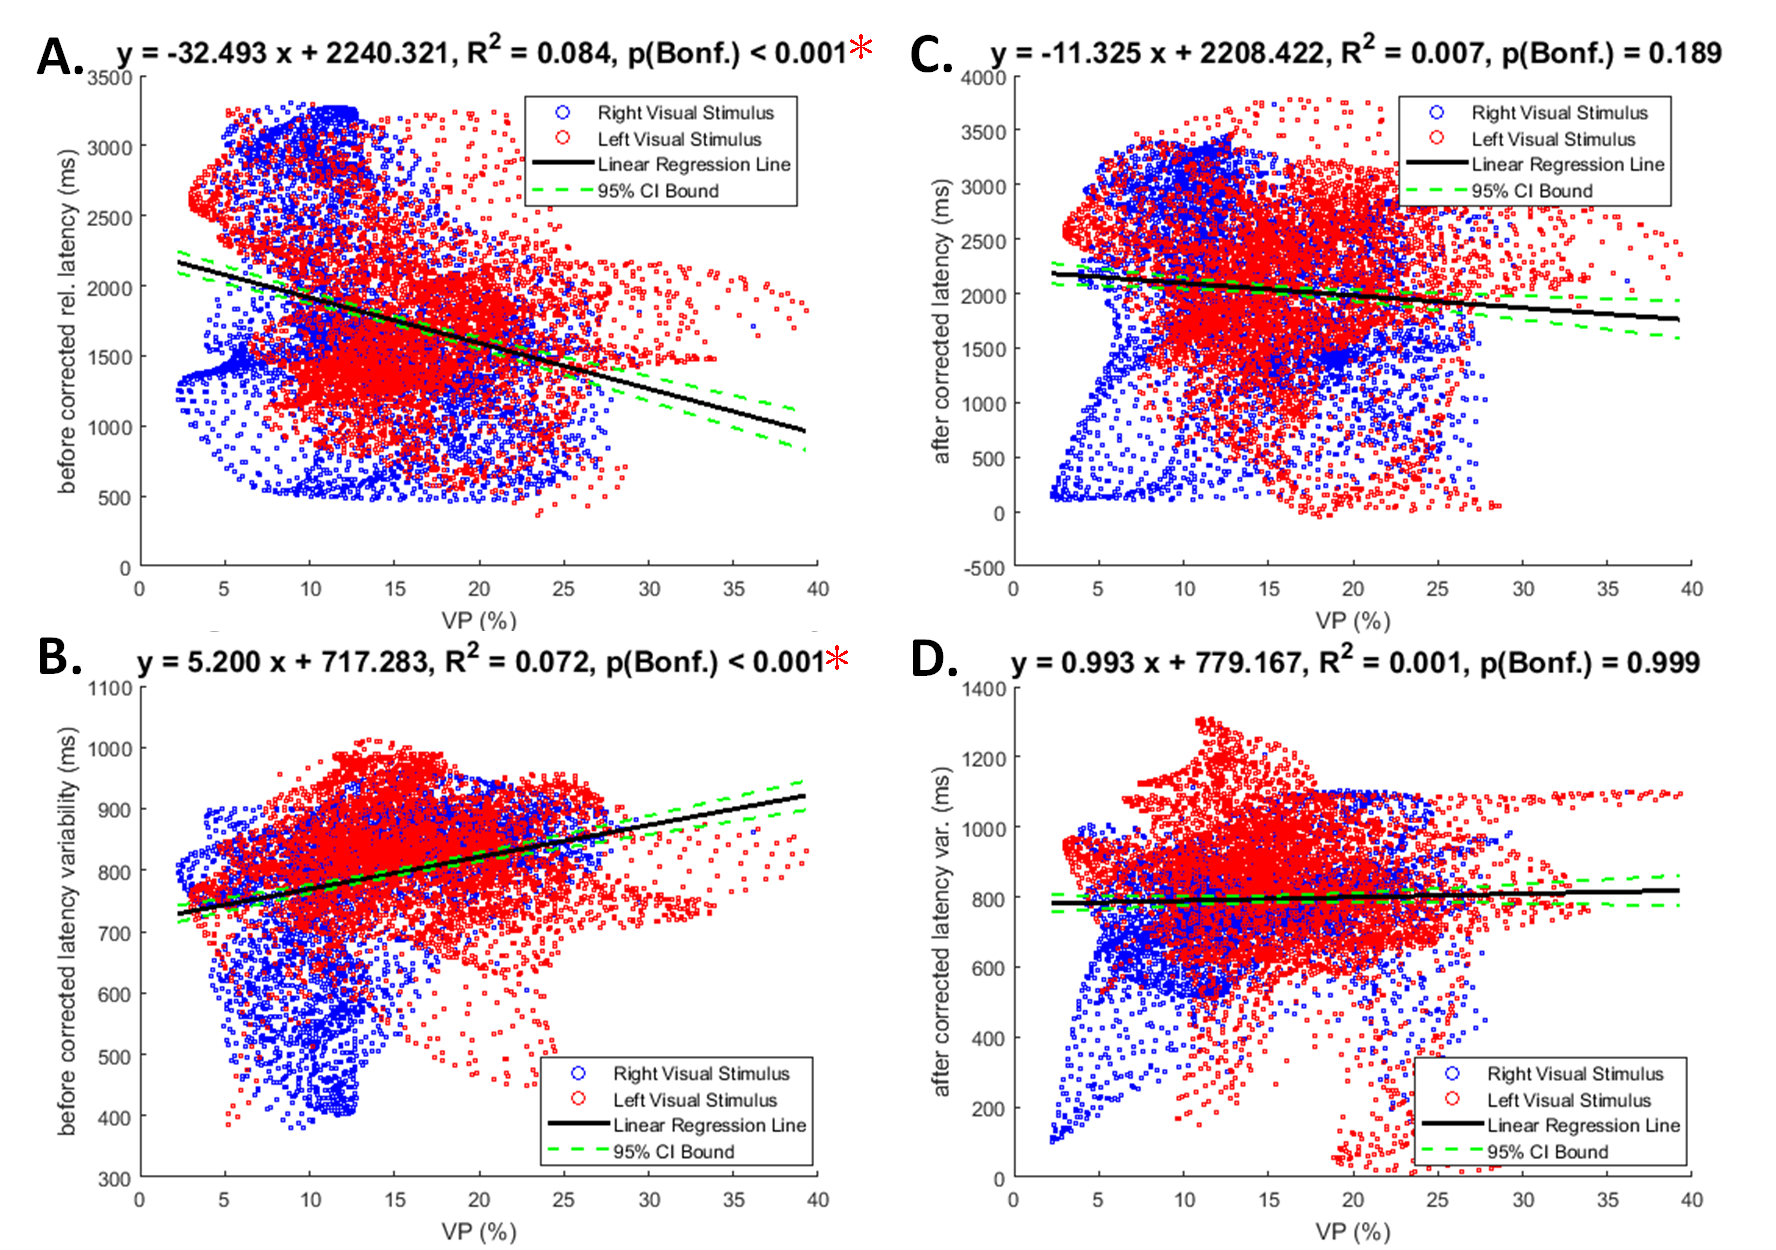
Figure 5. Linear regression relation between venule probability (VP) and relative latency as well as variability of the BOLD dynamics in the visuomotor task
A: Significant negative correlation between VP and the visuomotor latency within V1 before vascular reactivity calibration.
B: Significant positive correlation between VP and temporal variability within V1 before vascular reactivity calibration.
C: Significant negative correlation between VP and the visuomotor latency within V1 after vascular reactivity calibration.
D: Significant positive correlation between VP and temporal variability within V1 after vascular reactivity calibration.
Note that Significant correlations after Bonferroni correction for multiple testing are indicated by red asterisks.