3708
Hypercapnic Normalization to Correct for Caffeine-Induced Changes in Task-Based BOLD fMRI Responses1Radiology and Clinical Neurosciences, University of Calgary, Calgary, AB, Canada
Synopsis
This repeated-measures study sought to determine whether hypercapnic normalization can be used to address caffeine-induced vascular changes affecting BOLD responses. Visual/motor BOLD activation and cerebrovascular reactivity (CVR) under caffeine and placebo conditions were examined. CVR-correction was performed by dividing the task BOLD signal by CVR. Prior to CVR-correction, peak BOLD responses for both caffeine and placebo conditions were found in the visual cortex. After CVR-correction, peak responses were in the subcortical regions. Caffeine produced larger responses in the cerebellum compared to placebo, while subcortical activation was larger under placebo conditions. These results show that CVR-correction may benefit subcortical signal detection.
Introduction
Caffeine is a vasoconstrictor which may affect BOLD signal by decreasing cerebral blood flow (CBF)1; it is also a stimulant and has been shown to produce an overall increase in BOLD contrast2. However, this observed BOLD increase may not truly reflect increases in neural activity3, due to the induced changes in CBF. Prior research has demonstrated that changes in CBF, due to aging, can be corrected through hypercapnic normalization1, where task activation maps are corrected using CVR maps. This study aimed to assess task-induced BOLD signal and CVR following the ingestion of caffeine, and to establish how CVR-correction affects task activation maps under a CBF modulator.Methods
13 healthy adults (5 males, age = 28.0 ± 10.09 yrs) participated in this study. Imaging was performed on a 3.0 Tesla GE scanner with a 32-channel head coil. BOLD-weighted scans (including the visual-motor task and hypercapnia scans) were acquired (TR/TE = 1800/30ms, 2x2x2mm3, multiband factor = 3). A structural 3D T1-weighted BRAVO scan was collected for anatomical reference.
Participants completed two scans held 48 hours apart and were asked to abstain from caffeine for a minimum of 12 hours before both scans. Each participant consumed one of each type of pill, a caffeine (200 mg3–5) and a placebo (lactose), 30 minutes prior to scanning. Participants were blinded to the pill manipulation, and pill order was controlled and pseudo-randomized.
During the scan, participants completed a visual/motor task and hypercapnia challenge. The visual motor task consisted of fixating on a centrally located dot while tapping each finger to thumb, on both hands, simultaneously with a flashing black and white checkerboard (8Hz). This block design consisted of 21 second epochs, with the checkerboard interspersed with a uniform grey baseline. For the hypercapnia gas challenge, a gas mixture consisting of 5% CO2 and 95% medical air was delivered for two minutes, interleaved with two minutes of medical air only, through an MR-compatible breathing circuit.
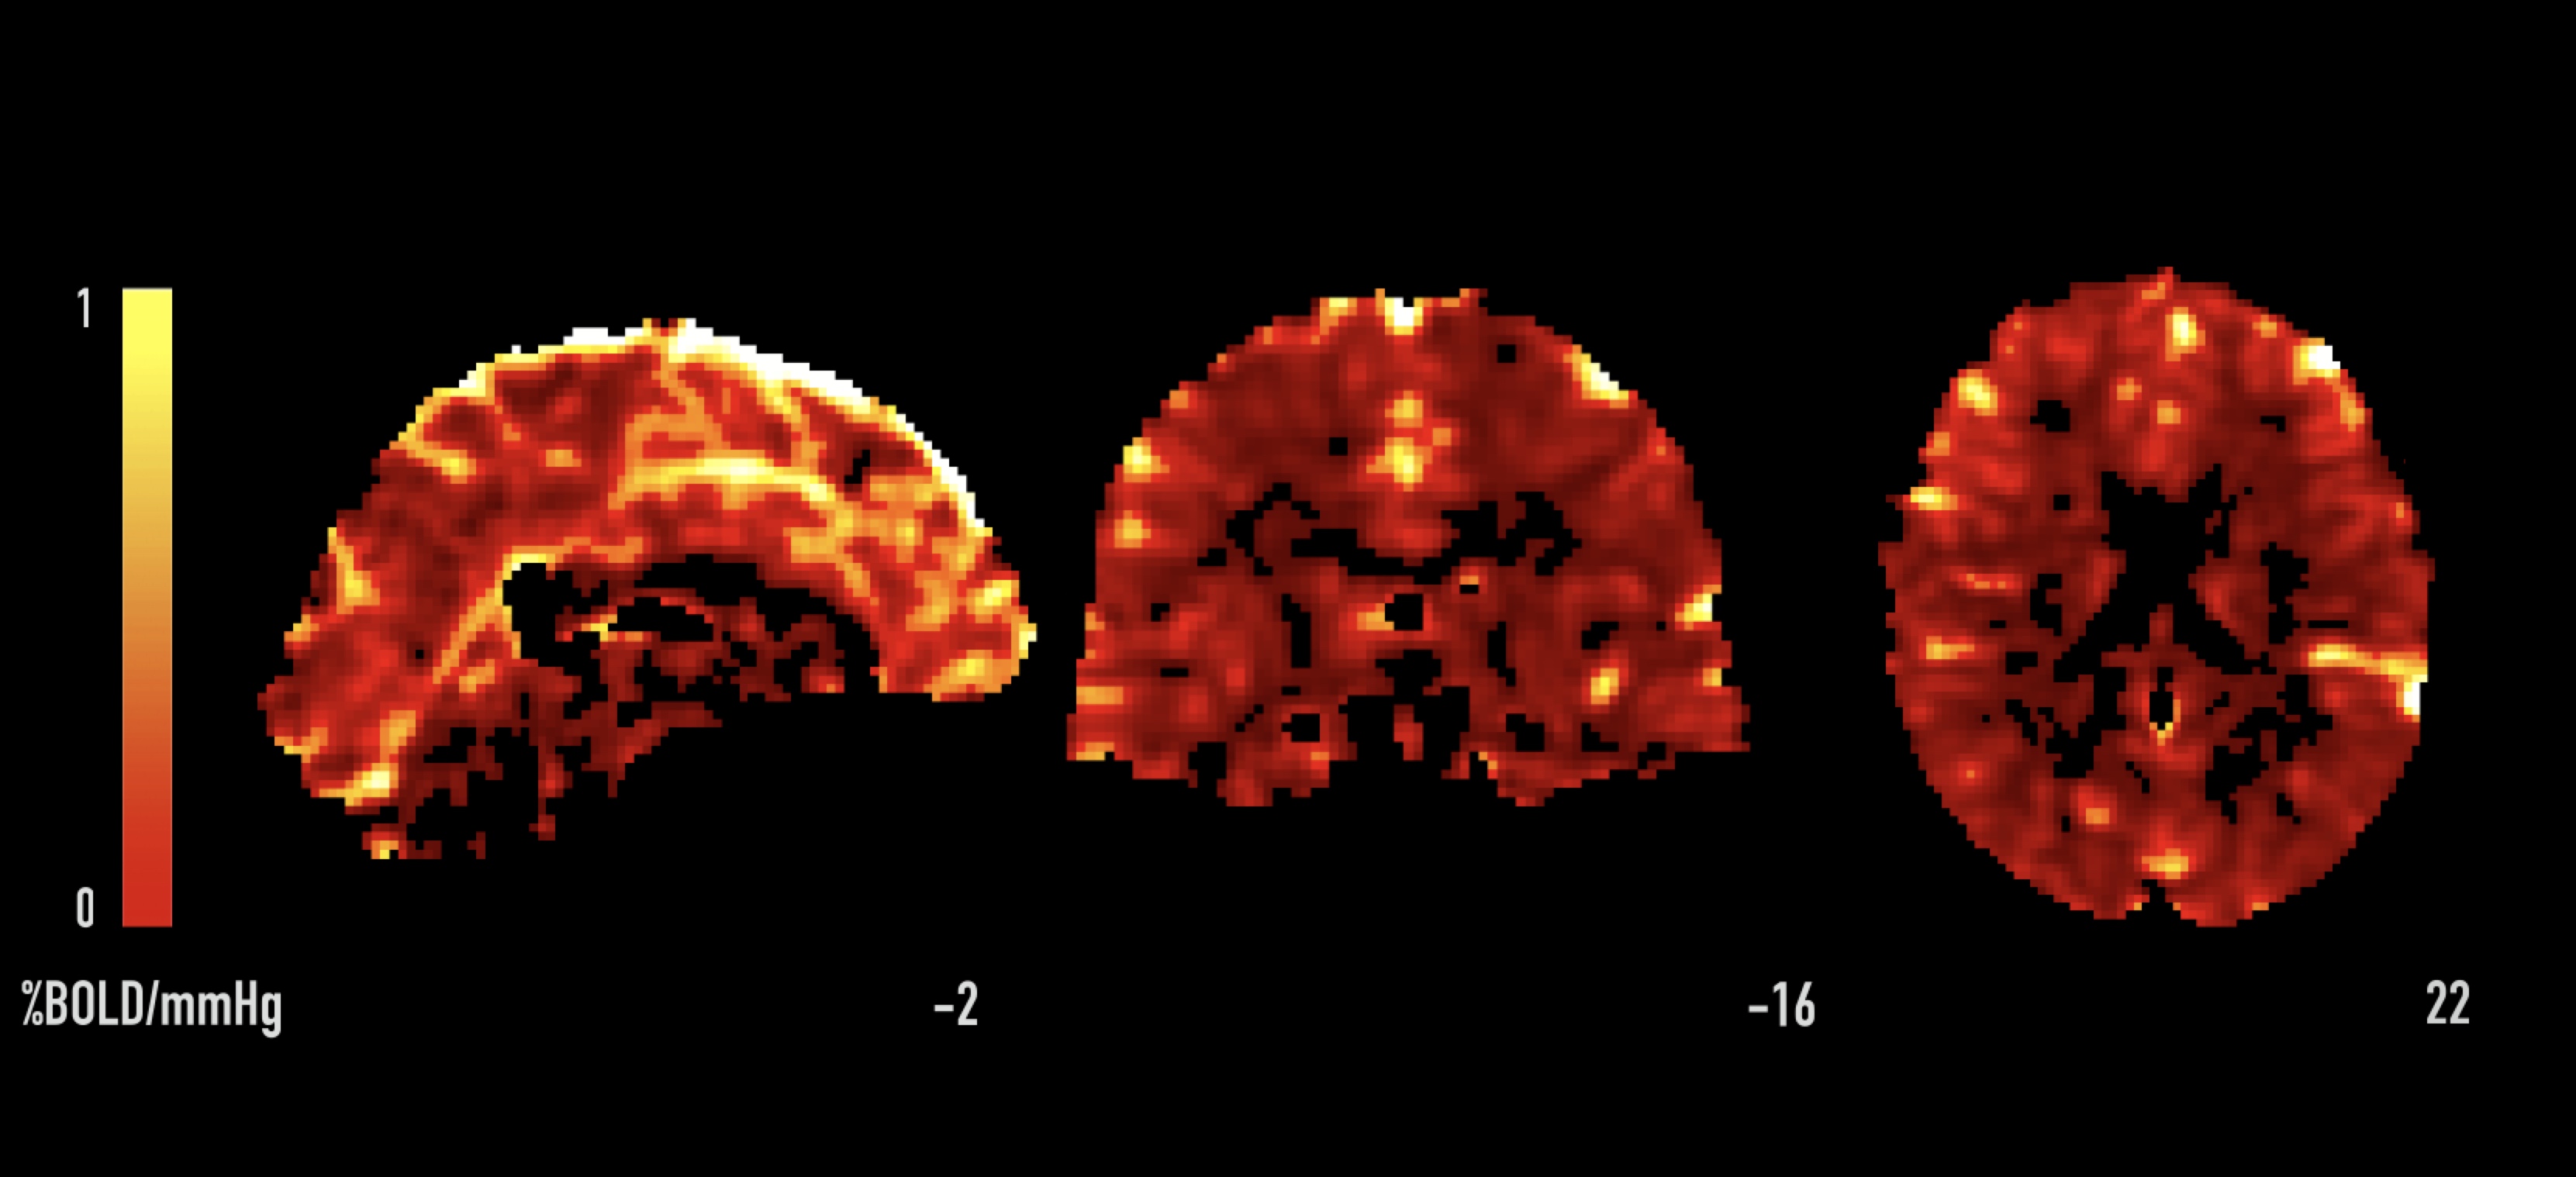
The fMRI data analysis and pre-processing were performed using Statistical Parametric Mapping 12 (SPM12) implemented in MATLAB R2017a and FMRIB Software Library v5 (FSL)6. Smoothing with a full width at half maximum (FWHM) of 4mm was applied to all fMRI images. First-level analyses modelled BOLD activation with a canonical hemodynamic response function while group-level analyses were carried out using analysis of variance (ANOVA) tests. Hypercapnic normalization was performed by dividing the task-fMRI BOLD signal by the CVR maps (Figure 1) in a voxel-wise fashion7. Mean percent signal change (PSC) of the task-induced BOLD responses (before CVR-correction) and mean CVR (%BOLD/mmHg) were calculated for the motor cortex, visual cortex and visual/motor thalamic regions, determined by FSL’s Harvard-Oxford atlas8,9.
Results
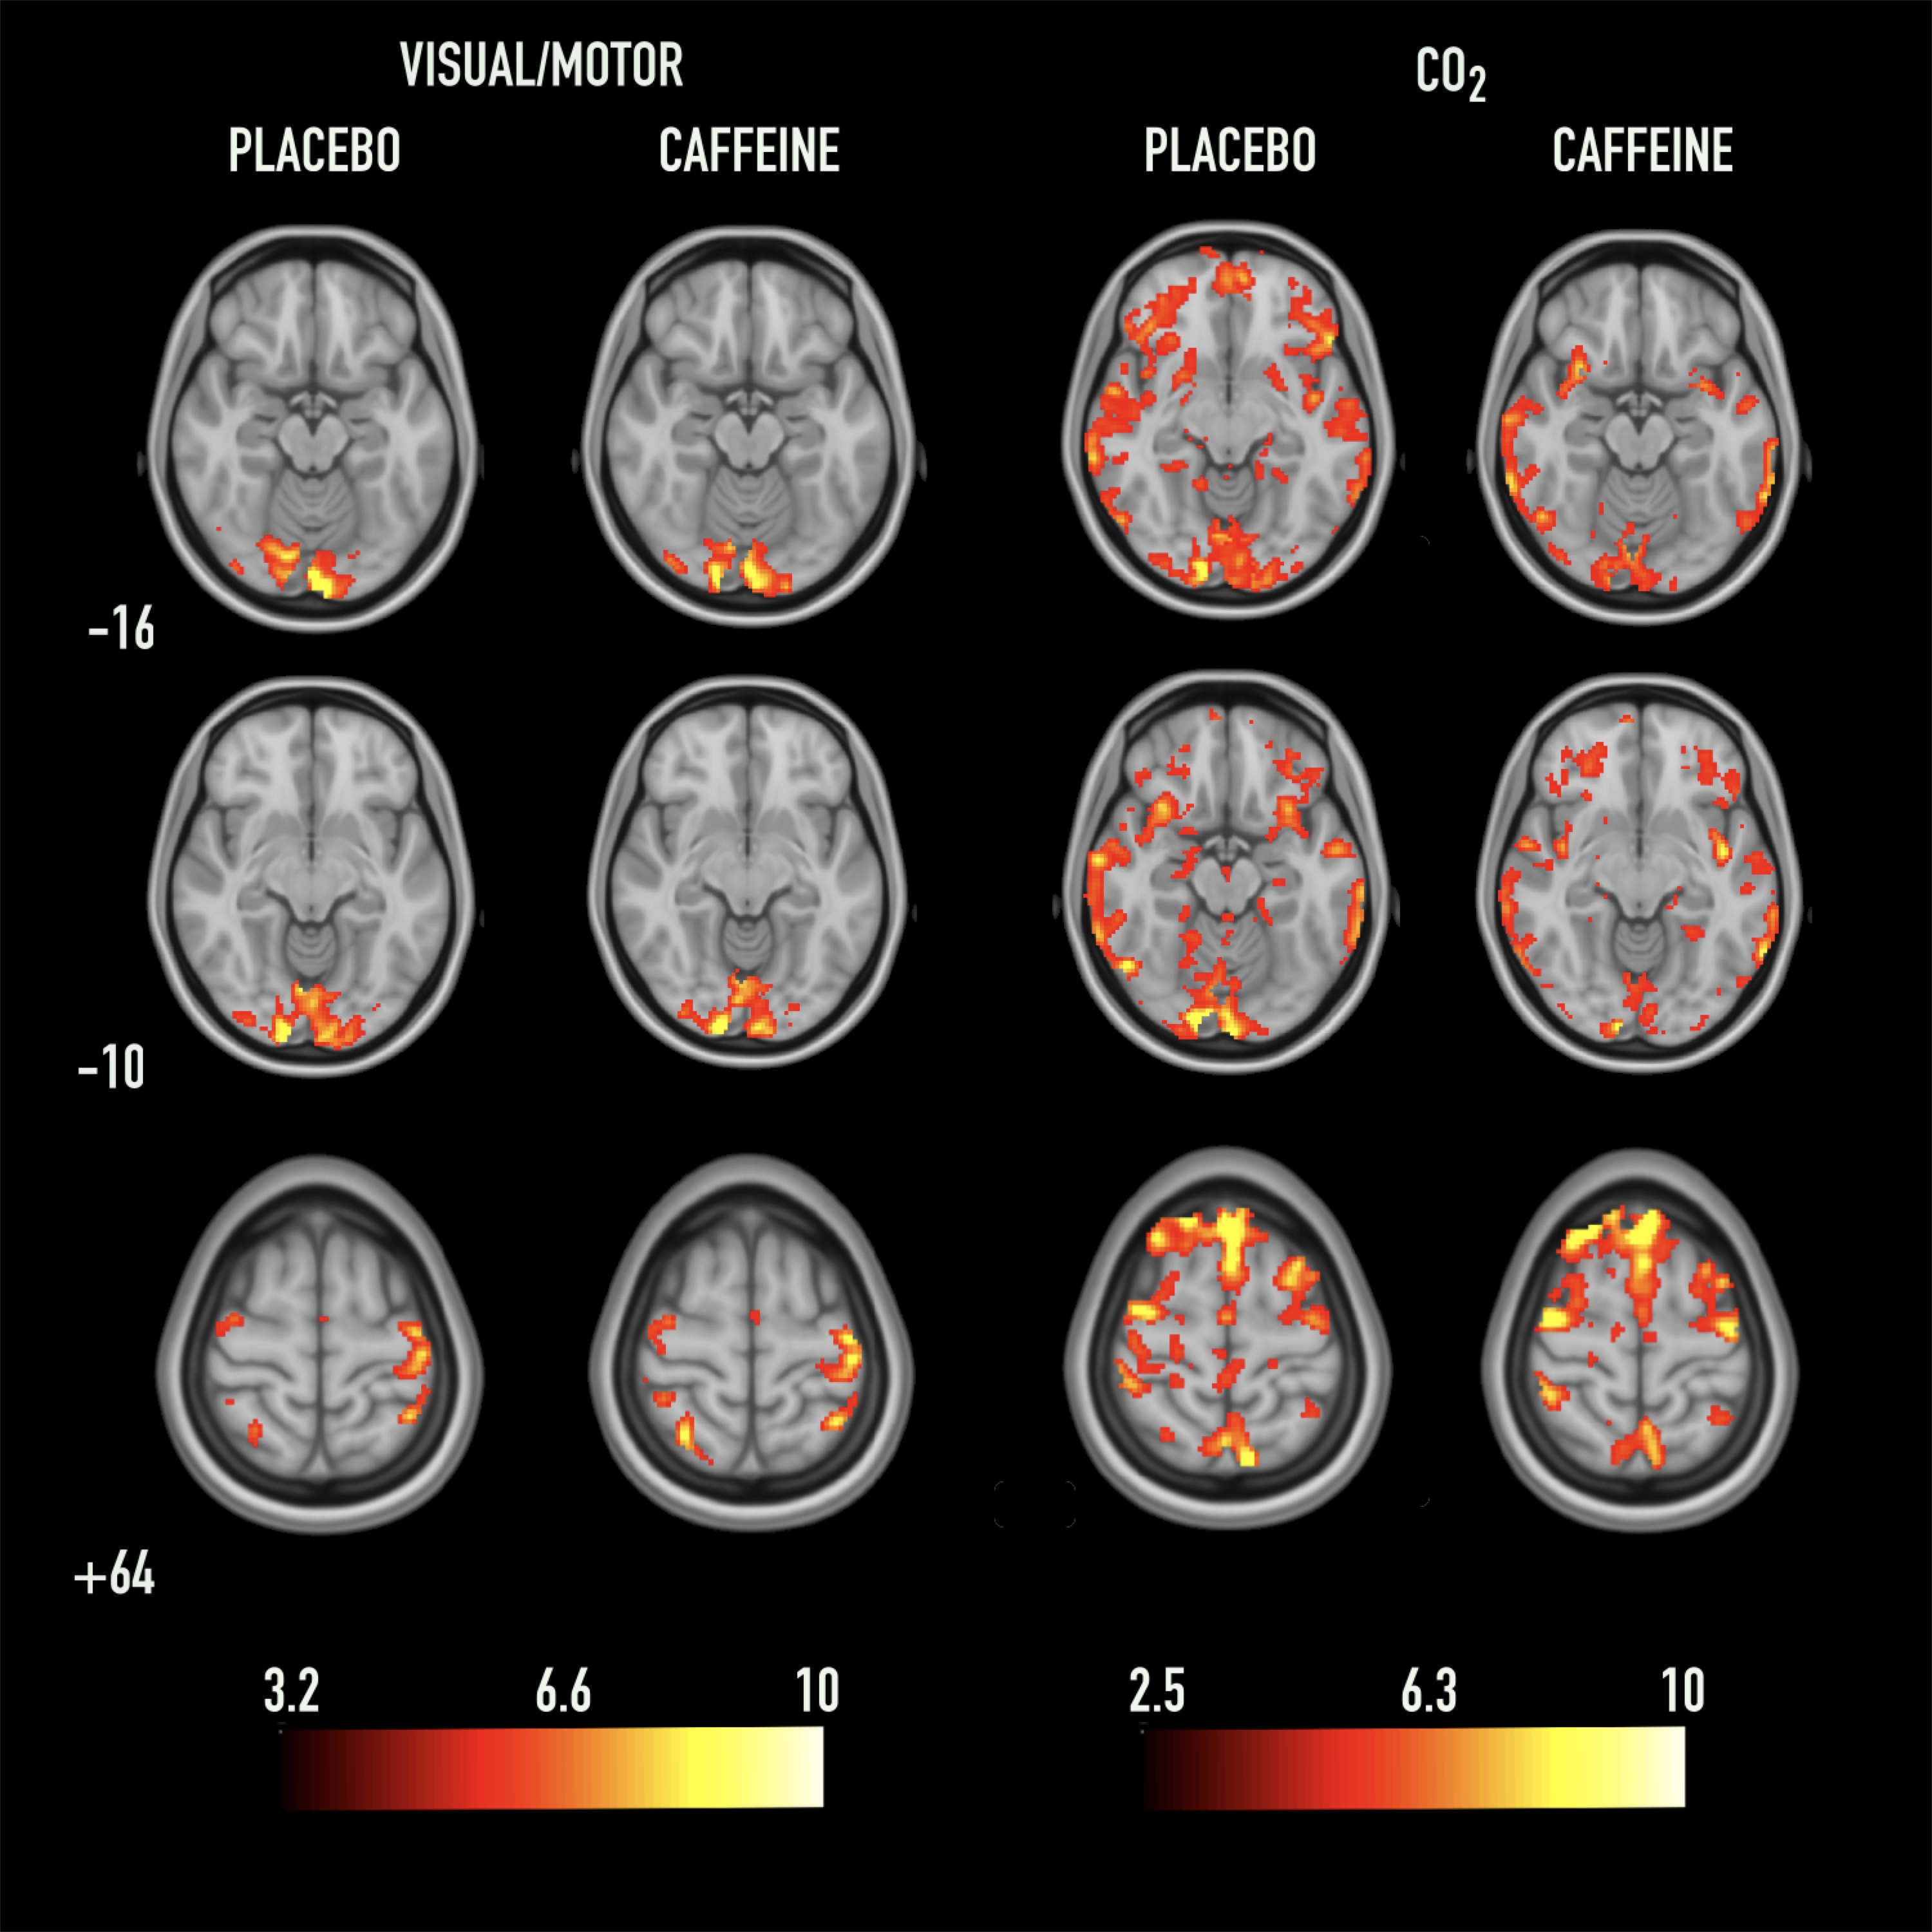
Figure 2 demonstrates an example of an individual subject’s visual/motor activation and BOLD response to CO2 under both conditions.
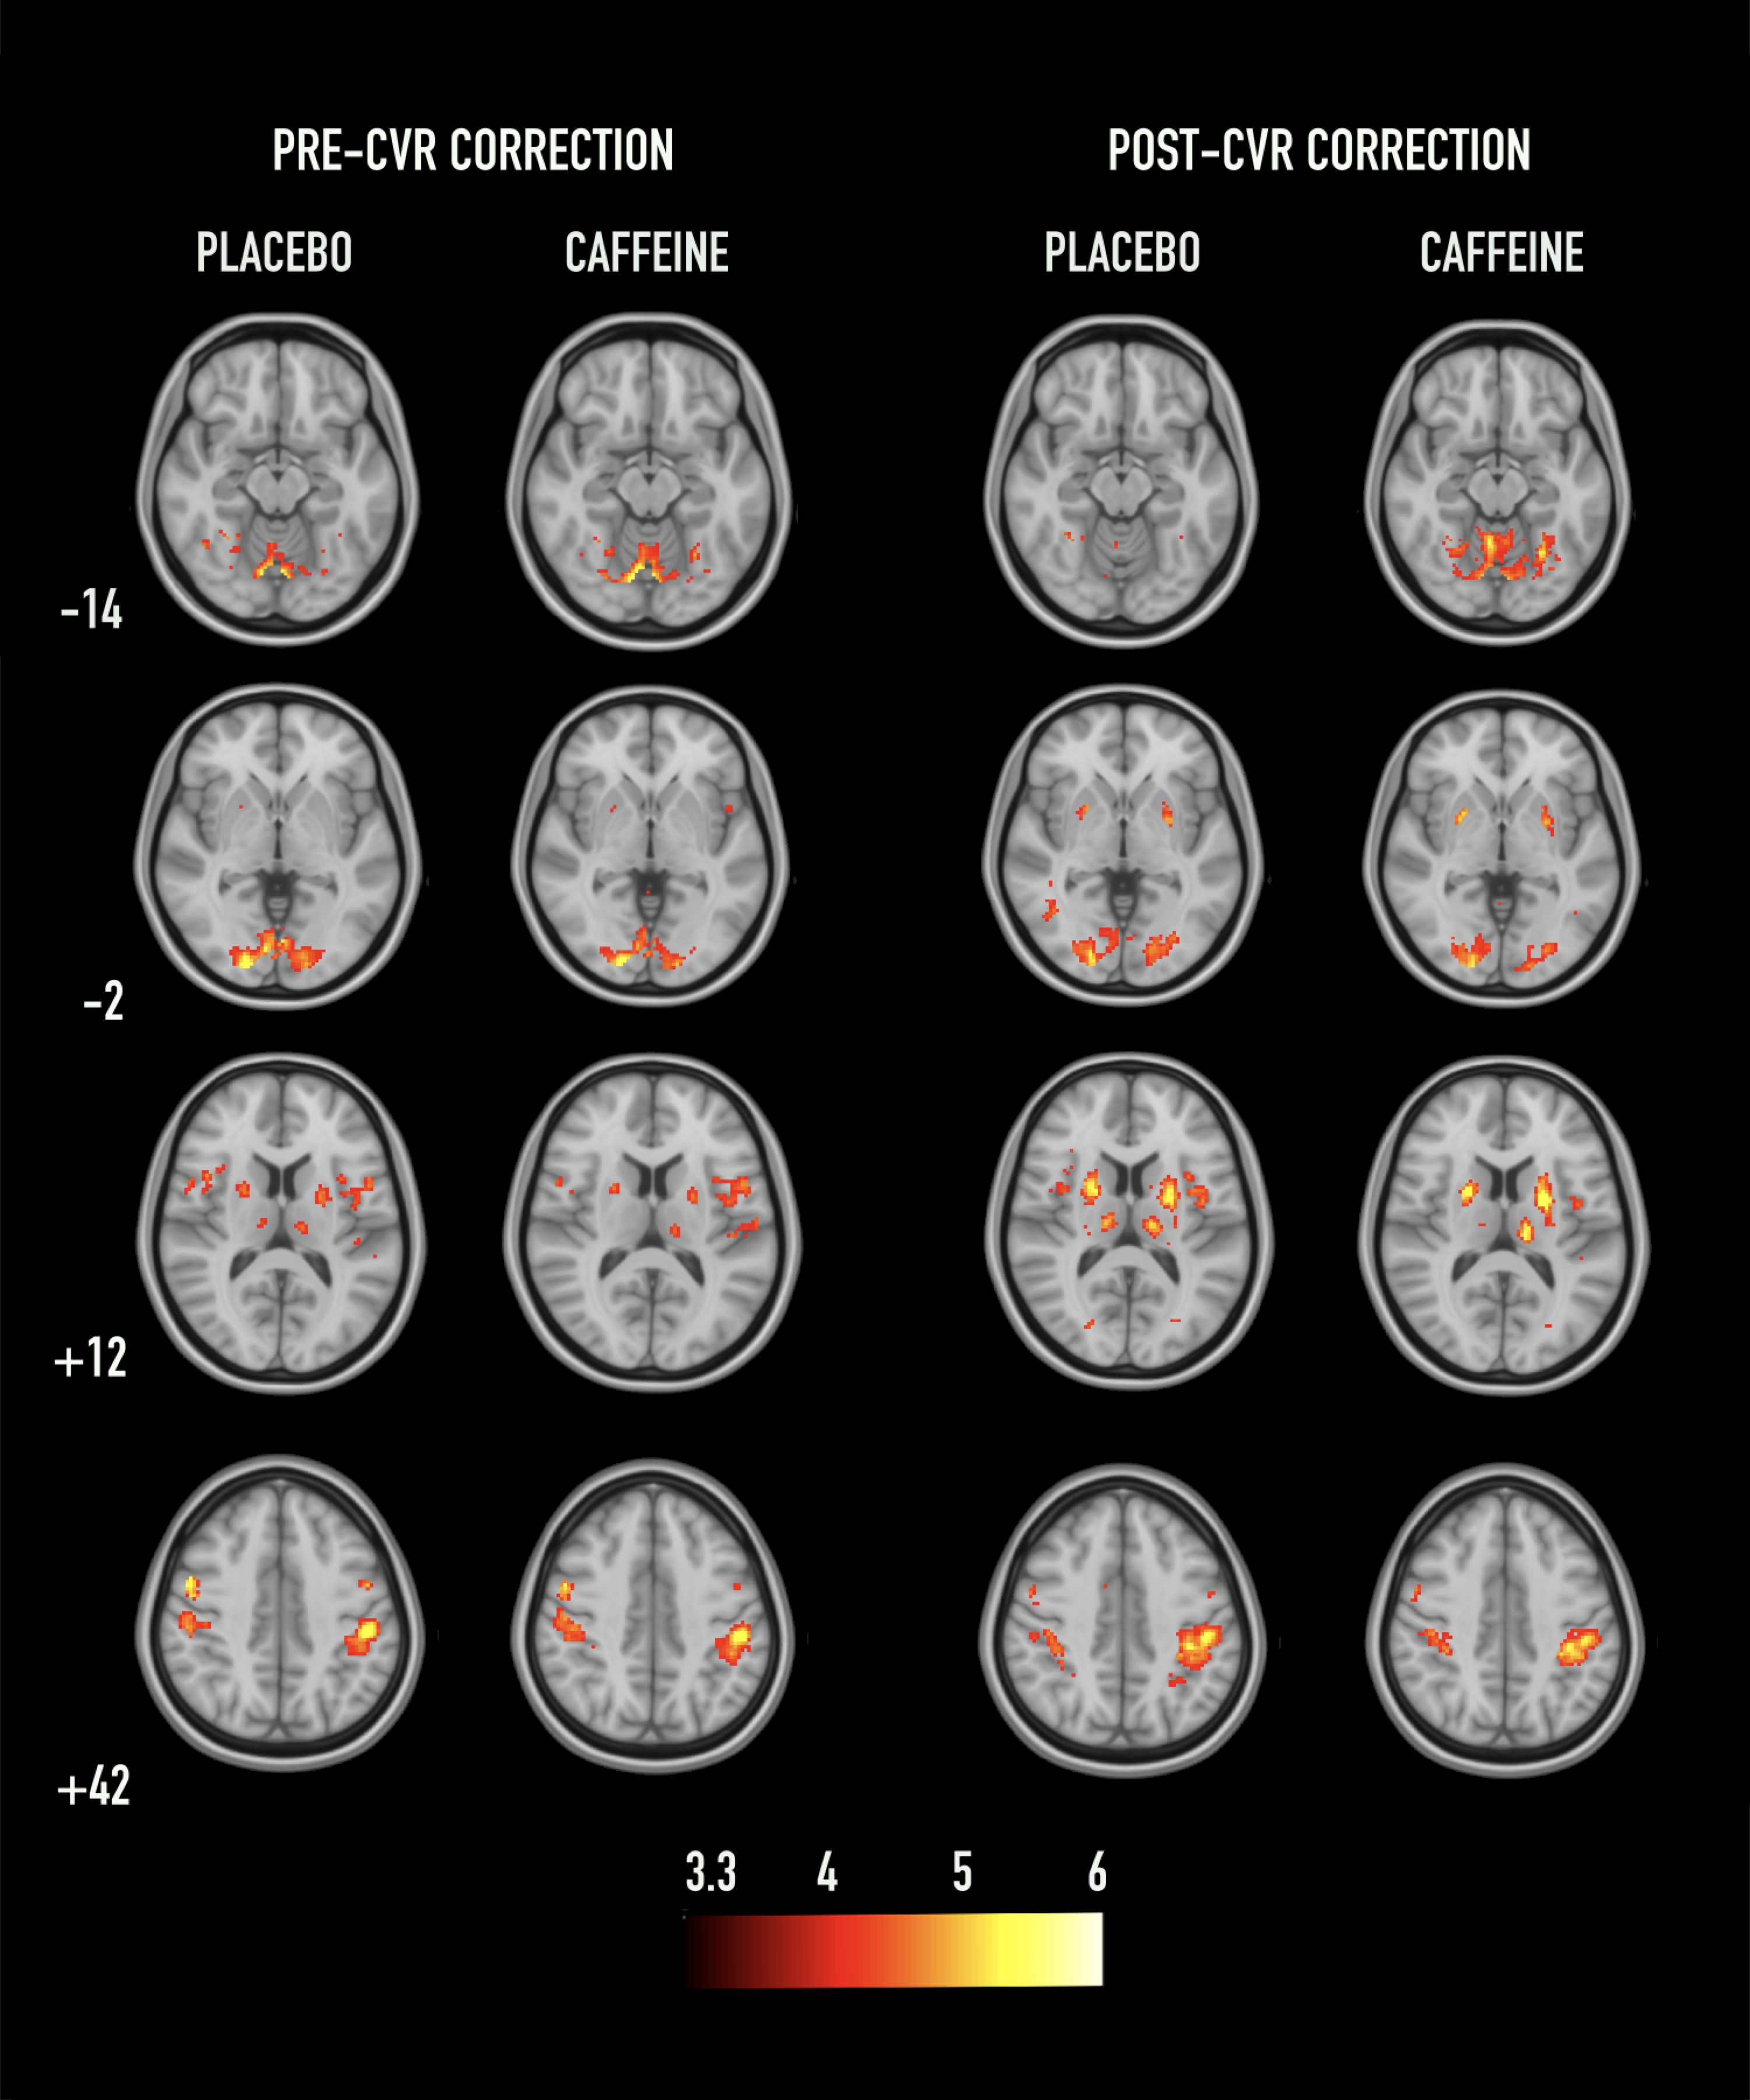
Figure 3 provides the second-level group analyses of the caffeine and placebo conditions before and after applying CVR-correction. The peak voxel in both conditions, pre CVR-correction, is in the visual areas (MNI coordinates for caffeine: [8 -78 -6], placebo = [8 -76 -6]). Post-correction, the peak voxels are found in the subcortical regions (caffeine = [-22 -2 12], placebo = [24 4 8]). The mean percent signal changes (pre CVR-correction) in the motor cortex (Caffeine ∆S = 1.15 ± 0.25%, Placebo ∆S = 1.11 ± 0.25%), visual cortex (Caffeine ∆S = 1.78 ± 0.29%, Placebo ∆S = 1.79 ± 0.30%) and thalamus (Caffeine ∆S = 0.81 ± 0.29%, Placebo ∆S = 0.90 ± 0.23%) were found. Paired t-tests revealed no significant magnitude differences between placebo and caffeine conditions.
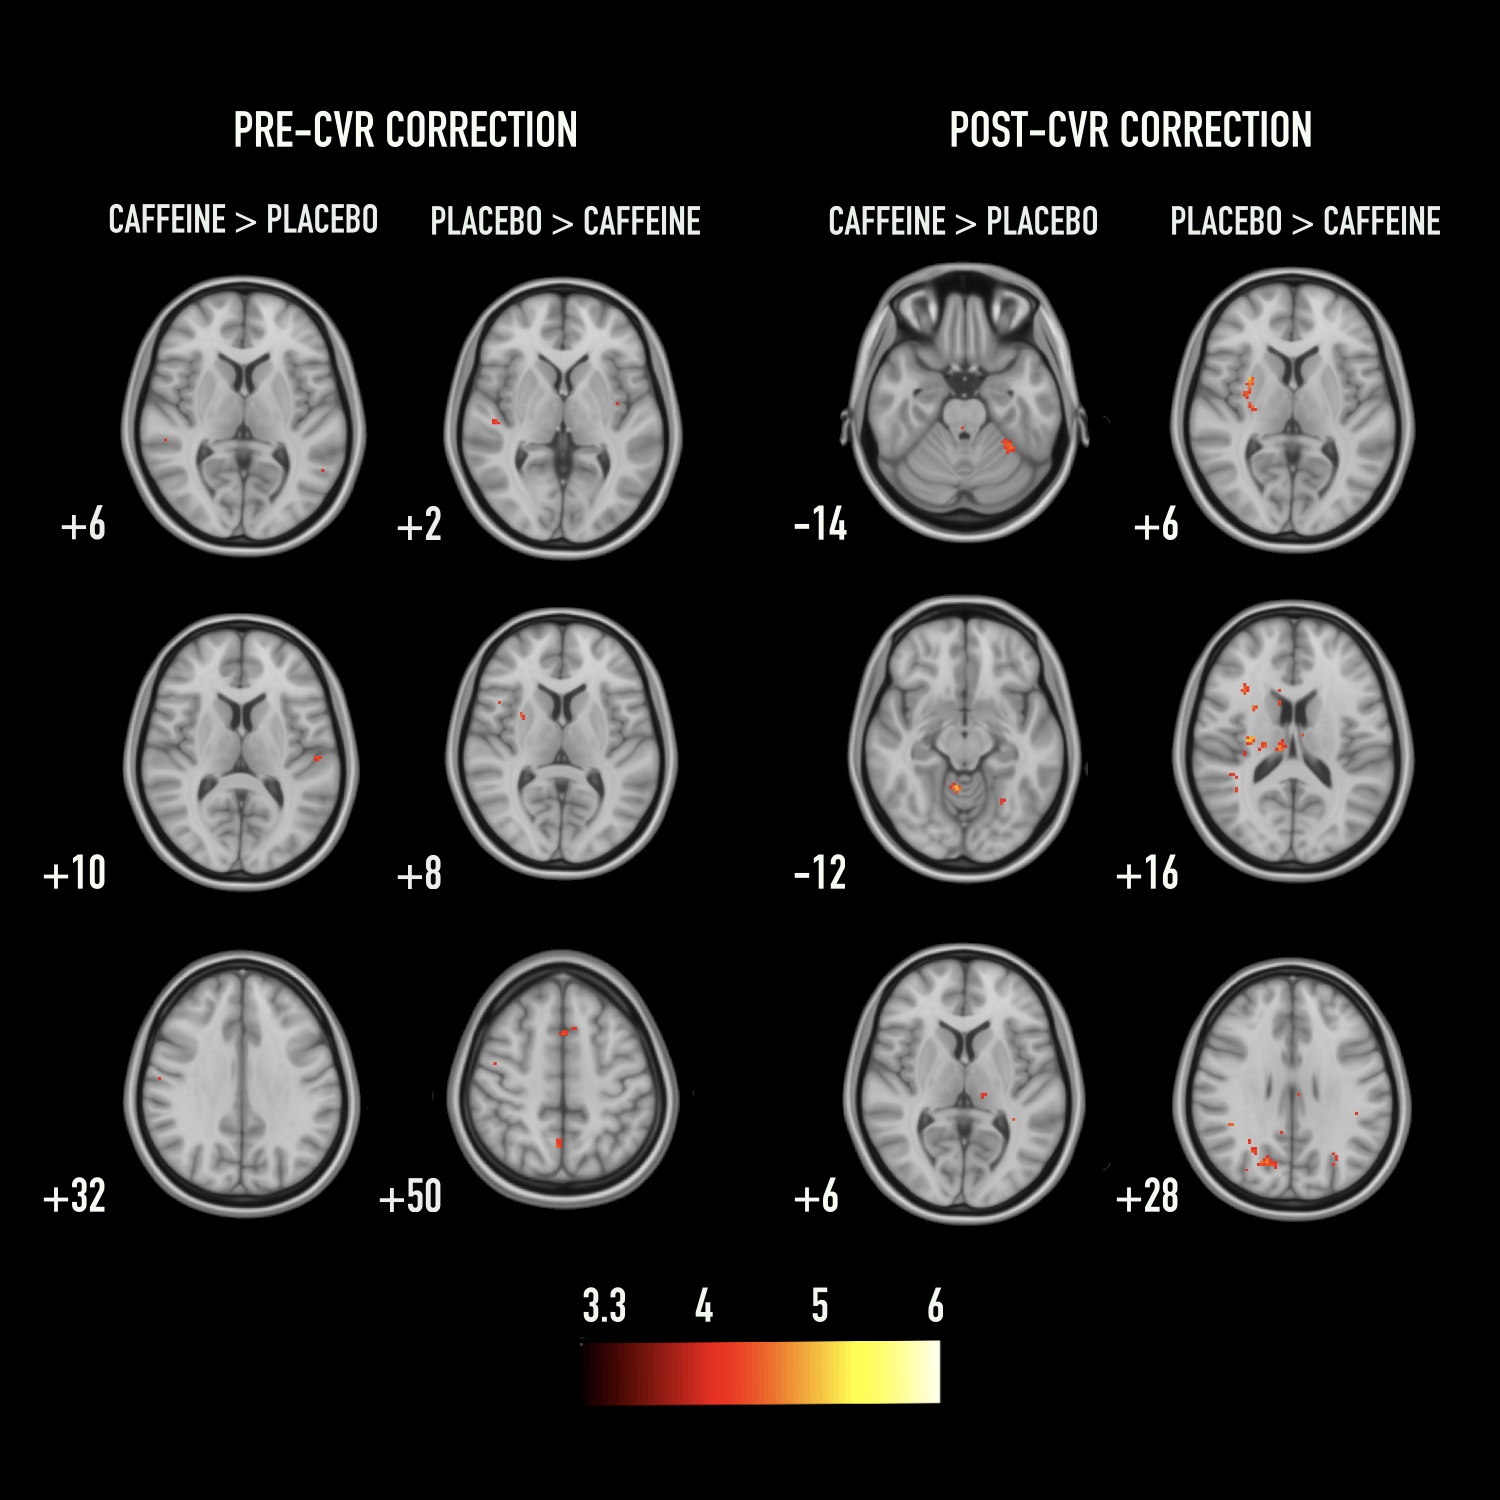
Figure 4 demonstrates the differences between placebo and caffeine conditions, before and after CVR-correction. Group comparison revealed that prior to CVR-correction the differences are minimal, however after CVR-correction, significant clusters are evident.
Discussion
Overall, these results indicate that CVR-correction improves subcortical signal detection, and may reveal larger differences between placebo and caffeine conditions. Peak activation for both conditions shifted from the visual cortex (pre CVR-correction) to the subcortical regions (post CVR-correction). This may be due to regional variations in CVR and/or receptors for caffeine, such as adenosine, between cortical and subcortical regions11. Furthermore, increased group activation for the CVR-corrected maps may reflect a reduction in inter-subject variability, consistent with prior work12. Further considerations include the influence of test-retest repeatability and how this may affect interpretation of repeated-measures designs.Conclusion
CVR-correction of task activation maps increased subcortical responses for both placebo and caffeine conditions. Furthermore, inter-subject variability induced by caffeine consumption may be reduced with CVR-correction.
Acknowledgements
No acknowledgement found.References
1. Addicott, M. A. et al. The effect of daily caffeine use on cerebral blood flow: How much caffeine can we tolerate? Hum. Brain Mapp. 30, 3102–14 (2009).
2. Mulderink, T. A., Gitelman, D. R., Mesulam, M.-M. & Parrish, T. B. On the Use of Caffeine as a Contrast Booster for BOLD fMRI Studies. Neuroimage 15, 37–44 (2002).
3. Chen, Y. & Parrish, T. B. Caffeine’s effects on cerebrovascular reactivity and coupling between cerebral blood flow and oxygen metabolism. Neuroimage 44, 647–52 (2009).
4. Perthen, J. E., Lansing, A. E., Liau, J., Liu, T. T. & Buxton, R. B. Caffeine-induced uncoupling of cerebral blood flow and oxygen metabolism: A calibrated BOLD fMRI study. Neuroimage 40, 237–247 (2008).
5. Wu, W.-C., Lien, S.-H., Chang, J.-H. & Yang, S.-C. Caffeine alters resting-state functional connectivity measured by blood oxygenation level-dependent MRI. NMR Biomed. 27, 444–52 (2014).
6. Merola, A. et al. Mapping the pharmacological modulation of brain oxygen metabolism: The effects of caffeine on absolute CMRO2 measured using dual calibrated fMRI. Neuroimage 155, 331–343 (2017).
7. Jenkinson, M., Beckmann, C. F., Behrens, T. E. J., Woolrich, M. W. & Smith, S. M. FSL. Neuroimage 62, 782–790 (2012).
8. Liu, P. et al. Age-related differences in memory-encoding fMRI responses after accounting for decline in vascular reactivity. Neuroimage 78, 415–25 (2013).
9. Makris, N. et al. Decreased volume of left and total anterior insular lobule in schizophrenia. Schizophr. Res. 83, 155–71 (2006).
10. Behrens, T. E. J. et al. Characterization and propagation of uncertainty in diffusion-weighted MR imaging. Magn. Reson. Med. 50, 1077–1088 (2003).
11. Laurienti, P. J. et al. Relationship between caffeine-induced changes in resting cerebral perfusion and blood oxygenation level-dependent signal. AJNR. Am. J. Neuroradiol. 24, 1607–11 (2003).
12. Liau, J. & Liu, T. T. Inter-subject variability in hypercapnic normalization of the BOLD fMRI response. Neuroimage 45, 420–430 (2009).
Figures