3706
Whole-brain OEF quantification: a comparison study between QSM and dual-gas calibrated BOLD1McConnell Brain Imaging Centre and Department of Biomedical Engineering, McGill University, Montreal, QC, Canada, 2Hotchkiss Brain Institute and Department of Radiology, University of Calgary, Calgary, AB, Canada, 3Department of Biomedical Engineering, Cornell University, Ithaca, NY, United States, 4Department of Radiology, Weill Cornell Medical College, New York, NY, United States
Synopsis
The microvascular QSM approach for quantifying baseline brain oxygen metabolism has great potential due to its simple set-up and high spatial resolution. In this study, we aim to investigate the feasibility of the high SNR microvascular QSM-OEF technique with a hypercapnia gas challenge and compare OEF and CMRO2 measured by QSM-OEF with those measured using the dual-gas calibrated BOLD technique (DGC-BOLD-OEF), a reference standard. Baseline OEF and CMRO2 measured by hypercapnia QSM-OEF were found within the expected normal range for healthy subjects. Statistically significant but relatively small differences (5% difference) of OEF and CMRO2 were found between QSM-OEF and DGC-BOLD-OEF techniques.
Purpose
The microvascular QSM approach for quantifying brain oxygen metabolism has great potential due to its simple set-up and high spatial resolution. Previous studies using caffeine and hyperventilation as stimuli were successful in quantifying OEF using QSM.1,2 QSM-OEF is yet to be compared with the calibrated BOLD based reference standard. Therefore, this study aims to compare QSM-OEF with the dual-gas calibrated (DGC) BOLD-OEF. We further investigate the feasibility of the microvascular QSM-OEF technique of high SNR using a quantitative hypercapnia gas challenge that overcomes the lack of quantitative control in the reported caffeine and hyperventilation induced vasoconstrictions.Methods
All experiments were performed on a Siemens Tim Trio 3 T scanner with a 32-channel RF receiver head coil. Ten healthy subjects (five female, average age 29±5 yo) were scanned. A 3D T1-weighted 1 mm3 anatomical volume was acquired using MPRAGE. A 3D multi-echo flow-compensated gradient echo (GRE) sequence was used (TR= 32 ms; 7 TEs, TE1= 4.6 ms, Echo spacing=4.06 ms; voxel size = 1 x 1 x 1 mm3; FA = 20 degrees; GRAPPA=2, Bandwidth= 977 Hz/pixel, monopolar readout, TA=5 mins 40 seconds) to generate QSM at baseline and hypercapnia. Hypercapnia was achieved using a RespirAct (Thornhill Research Inc., Toronto, ON, Canada) to target partial pressure of end-tidal CO2 (Pet CO2) to 7 mmHg above the participant’s baseline for 6 mins. Calibrated BOLD data were collected using an EPI dual-echo pseudo-continuous arterial spin labeling (pCASL) sequence (TR/TE1/TE2 = 4000/10/30 ms, label duration/post-label delay = 1665/900 ms, 3.9 mm3 isotropic voxels, GRAPPA = 2, and descending acquisition order) under a baseline condition, a hypercapnic challenge condition (Pet CO2 = +7 mmHg), and a hyperoxic condition (PetO2 = +300 mmHg) for quantifying resting CBF and OEF.
QSM was reconstructed using a novel least-norm direct dipole inversion method without the background field removal step.3 Microvascular OEF values at both baseline and hypercapnic states were calculated according to Zhang et al. 2 except that a hypercapnic challenge was used and CMRO2 was assumed to remain unchanged.4 DGC-BOLD data were analyzed using the stepwise approach for baseline OEF calculation 5: the calibration parameter M was calculated based on the deoxyhemoglobin dilution model with a hypercapnia challenge, 6,7 following which OEF can be calculated from the dHb concentration changes with a hyperoxic challenge.
Comparisons of OEF maps from the microvascular QSM and DGC-BOLD methods were performed in vascular territory grey matter (GM) ROIs. Eight vascular territories including anterior (A), middle (M1-M6), and posterior (P) vascular territories were automatically segmented using an atlas, 8 which were subsequently divided into left and right hemispheres, yielding a total of sixteen ROIs.
Results
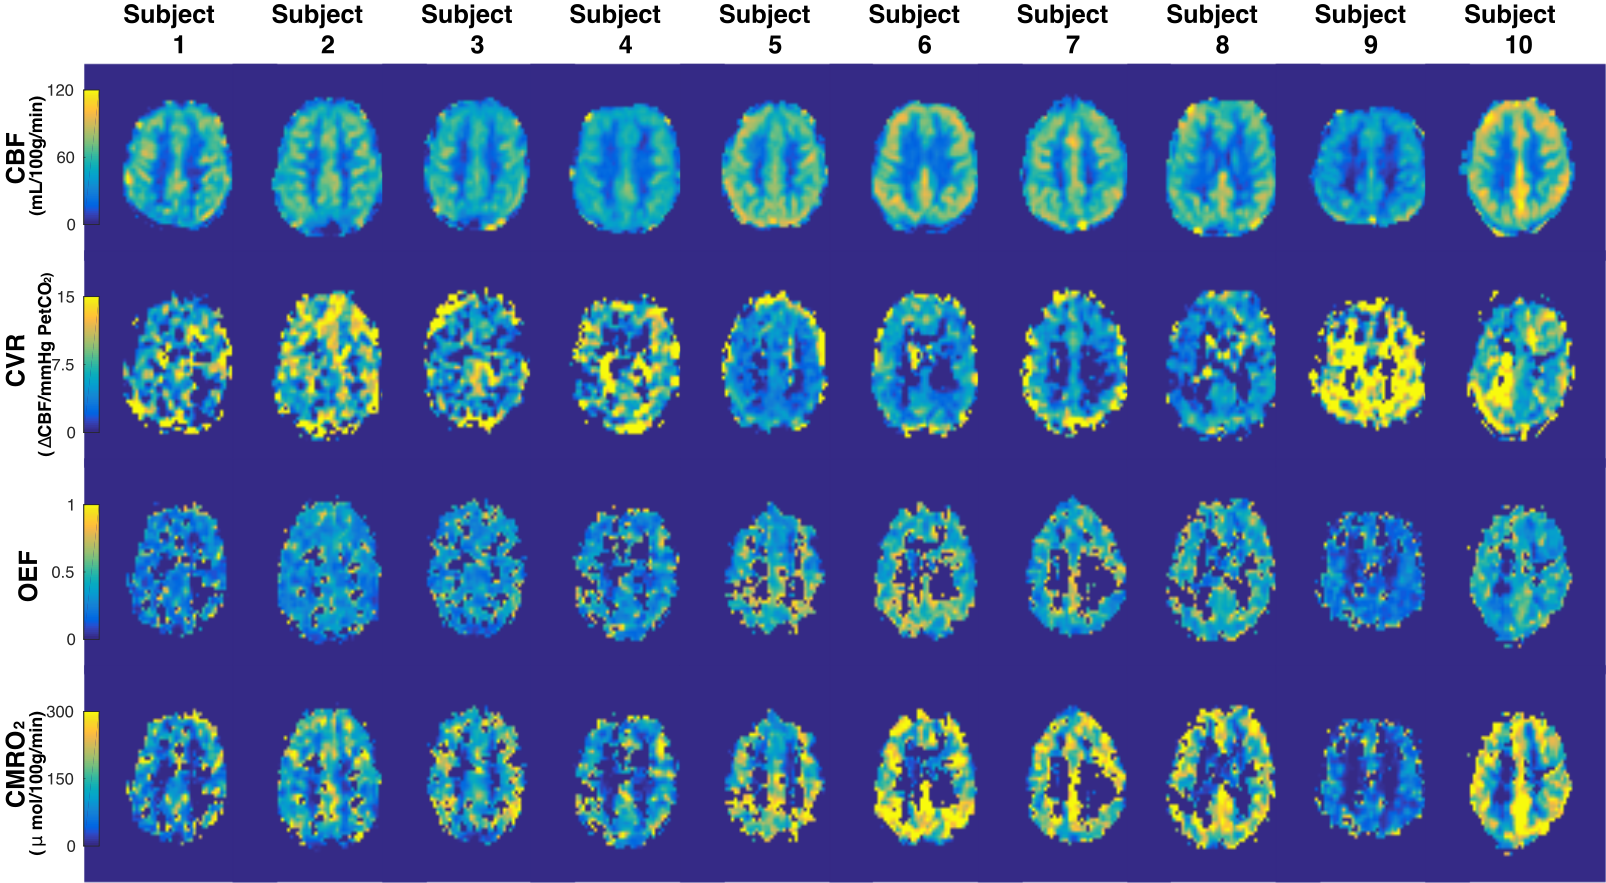
The voxel-wise maps and ROI averages of OEF and CMRO2 as quantified from the microvascular QSM technique for each subject are shown in Figure 1. The ROI average OEF and CMRO2 of all 10 subjects measured by QSM-OEF were 0.40 ± 0.04 and 176 ± 35 μmol O2/min/100g, respectively. DGC-BOLD results are shown in Figure 2. The ROI average OEF and CMRO2 of all 10 subjects measured by DGC-BOLD were 0.38 ± 0.09 and 167 ± 53 μmol O2/min/100g. The voxel-wise average DGC-OEF map from all subjects, registered to standard space shows slightly lower values than the average QSM-OEF map (Figure 3). OEF values from the sixteen vascular territories quantified in all subjects using both techniques were quantitatively assessed by Bland-Altman analysis (Figure 4). Statistically significant differences of OEF and CMRO2 values were found between QSM-OEF and DGC-BOLD-OEF mappings (P < 0.05). However, the differences between the two methods were relatively small (mean OEF difference = 0.02, mean CMRO2 difference = 9 μmol O2/min/100g).
Discussions and Conclusions
The employment of a hypercapnic challenge in combination with QSM is able to quantify baseline OEF and CMRO2 with high SNR in different brain regions within the expected normal range for healthy subjects. QSM-OEF and DGC-BOLD-OEF in cerebral vascular regions were statistically different, as revealed by the Bland-Altman analysis. However, the differences were small when all 10 subjects were considered (relative difference = 5%). In addition, compared with DGC-BOLD-OEF experiments, QSM-OEF measurements resulted in smaller variance in regional OEF values and could be more favorable in applications that are sensitive to small OEF changes. Furthermore, compared to the dual challenges required by the DGC-BOLD technique, QSM-OEF involves only one challenge, or no challenge when combined with qBOLD, 9 resulting in a shorter scan time.Acknowledgements
The authors gratefully acknowledge the assistance of Raphael Paquin (Siemens) in setting up the flow-compensated gradient-echo sequence. Thanks are extended to Isabelle Lajoie, Jingwei Zhang, Avery Berman, Rebecca Williams, Matthew Ethan MacDonald, and Ilana Leppert for their insightful discussions.References
- Zhang J, Liu T, Gupta A, Spincemaille P, Nguyen TD, Wang Y. Quantitative mapping of cerebral metabolic rate of oxygen (CMRO2 ) using quantitative susceptibility mapping (qsm). Magn Reson Med 2015;74(4):945-952.
- Zhang J, Zhou D, Nguyen TD, Spincemaille P, Gupta A, Wang Y. Cerebral metabolic rate of oxygen (CMRO2 ) mapping with hyperventilation challenge using quantitative susceptibility mapping (qsm). Magn Reson Med 2017;77(5):1762-1773.
- Sun H, Ma Y, MacDonald ME, Pike GB. Whole head quantitative susceptibility mapping using a least-norm direct dipole inversion method. Neuroimage 2018;179:166-175.
- Chen JJ, Pike GB. Global cerebral oxidative metabolism during hypercapnia and hypocapnia in humans: Implications for BOLD fmri. J Cereb Blood Flow Metab 2010;30(6):1094-1099.
- Bulte DP, Kelly M, Germuska M, Xie J, Chappell MA, Okell TW, Bright MG, Jezzard P. Quantitative measurement of cerebral physiology using respiratory-calibrated MRI. Neuroimage 2012;60(1):582-591.
- Davis TL, Kwong KK, Weisskoff RM, Rosen BR. Calibrated functional MRI: Mapping the dynamics of oxidative metabolism. Proc Natl Acad Sci U S A 1998;95(4):1834-1839.
- Hoge RD, Atkinson J, Gill B, Crelier GR, Marrett S, Pike GB. Investigation of BOLD signal dependence on cerebral blood flow and oxygen consumption: The deoxyhemoglobin dilution model. Magn Reson Med 1999;42(5):849-863.
- Kosior RK, Lauzon ML, Steffenhagen N, Kosior JC, Demchuk A, Frayne R. Atlas-based topographical scoring for magnetic resonance imaging of acute stroke. Stroke 2010;41(3):455-460.
- Cho J, Kee Y, Spincemaille P, Nguyen TD, Zhang J, Gupta A, Zhang S, Wang Y. Cerebral metabolic rate of oxygen (CMRO2 ) mapping by combining quantitative susceptibility mapping (qsm) and quantitative blood oxygenation level-dependent imaging (qbold). Magn Reson Med 2018.
Figures