3705
Normal variations in brain oxygen extraction fraction (OEF) are partly attributed to differences in end-tidal CO21Department of Biomedical Engineering, Johns Hopkins University School of Medicine, Baltimore, MD, United States, 2Department of Radiology, Johns Hopkins University School of Medicine, Baltimore, MD, United States, 3Department of Medicine, Johns Hopkins University School of Medicine, Baltimore, MD, United States, 4Department of Psychiatry and Behavioral Sciences, Johns Hopkins University School of Medicine, Baltimore, MD, United States, 5Department of Neurology, Johns Hopkins University School of Medicine, Baltimore, MD, United States
Synopsis
Quantitative assessment of brain oxygen extraction fraction (OEF) is of substantial clinical significance in many brain diseases. However, a remaining issue associated with OEF is its considerable inter-subject variations within healthy population. Therefore, it is important to investigate the physiological underpinnings of OEF variations among normal subjects. The present work used two studies, a discovery study and a verification study, to examine the extent to which end-tidal CO2 (EtCO2) can explain inter-subject variations in OEF. It was found that, across subjects, OEF is inversely correlated with EtCO2, and EtCO2 alone can account for about 50% of variances in OEF.
INTRODUCTION
Quantitative assessment of brain oxygen extraction fraction (OEF) is of substantial clinical significance, e.g. in stroke,1 arteriostenosis,2 Alzheimer’s disease,3 and sickle cell disease,4 as this physiological parameter indexes the homeostasis of oxygen demand and supply. While measurement of OEF is traditionally a “niche market” of 15O-PET,5 recent advances in MRI techniques have enabled routine assessment of OEF without any exogenous agent.6 However, a remaining issue associated with OEF is that there have been reports of considerable inter-subject variations within healthy population,7 which may obscure the interpretation of OEF data and weaken the power of OEF as a disease biomarker. Therefore, it is important to investigate the physiological underpinnings of OEF variations among normal subjects. The present work used two studies, a discovery study and a verification study, to examine the extent to which end-tidal CO2 (EtCO2) can explain inter-subject variations in brain OEF. In addition, we investigated the potential role of other physiological parameters, including systolic blood pressure (SBP), diastolic blood pressure (DBP), and heart rate (HR), on OEF.METHODS
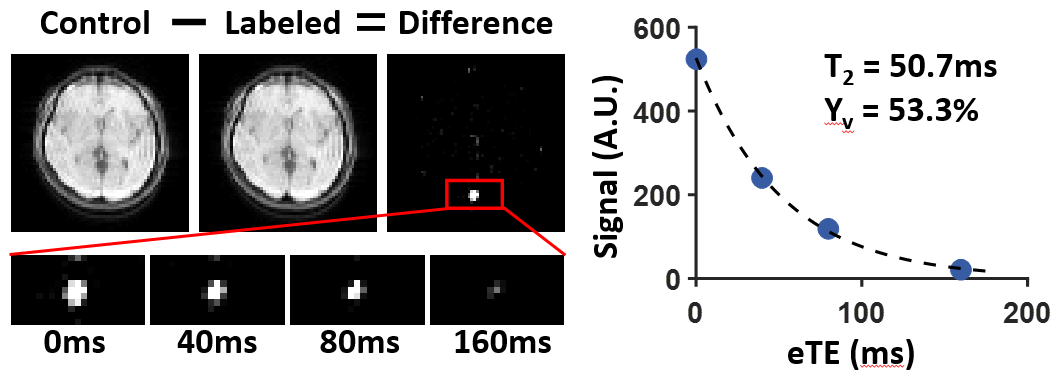
Experiments: We conducted two studies. Study 1 was a discovery study performed on young healthy subjects. Study 2 was a verification study performed on a larger cohort of elderly subjects with normal cognitive function. In both studies, global OEF was measured using an MRI technique, T2-relaxation-under-spin-tagging (TRUST),6 with the following sequence parameters: FOV=220×220mm2, voxel-size=3.4×3.4×5.0mm3, TR=3000ms, TI=1020ms, 4 effective TEs (eTEs): 0,40,80,160ms, duration 1.2min. Importantly, during the TRUST scans, a nasal canula was used to sample the exhaled gas and EtCO2 was recorded using capnograph device.
Study 1: Ten young healthy subjects (age 24.0±3.2y) were scanned on a Siemens Prisma 3T scanner. Each subject underwent 3 TRUST scans. To improve data stability, the OEF and EtCO2 were averaged across the 3 scans.
Study 2: Twenty-four elderly cognitively normal subjects (age 69.9±6.4y, ranging from 60 to 83y) were scanned on a Philips Achieva 3T scanner. Each subject underwent 1 TRUST scan. Other physiological parameters measured included SBP, DBP, and HR.
Data processing: The TRUST processing followed procedures established previously.6 Briefly, venous blood T2 was estimated by monoexponential fitting of the pure blood signal as a function of eTEs. Blood T2 was then converted to venous blood oxygenation (Yv) using a well-established calibration plot.8 OEF was calculated as (Ya−Yv)/Ya×100%, where Ya is the arterial blood oxygenation and was assumed to be 98%.
Statistical analysis: We used a step-wise linear regression analysis in which OEF was the dependent variable and there were a number of independent variables. These independent variables were added to the model in a step-wise manner, starting from the most significant one until there were no more variables that reached a P<0.05. For Study 1, the candidate independent variables were age, gender, and EtCO2. For Study 2, the candidate independent variables were age, gender, EtCO2, SBP, DBP, and HR.
RESULTS
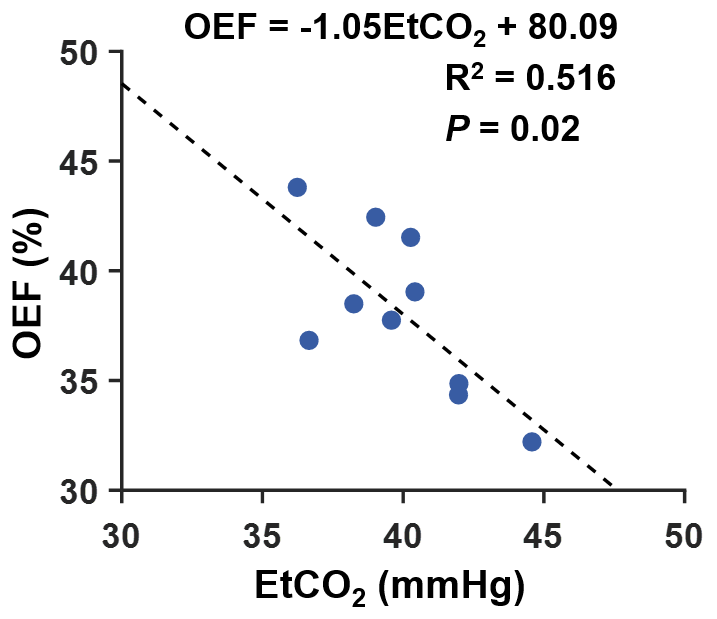
Figure 1 shows a representative dataset from TRUST MRI. For data from Study 1, EtCO2 and OEF in young subjects were 39.9±2.5mmHg and 38.1±3.7%, respectively. Figure 2 shows a scatter plot of OEF and EtCO2 in healthy young subjects. It was found that OEF was inversely dependent on EtCO2 (P=0.02). Age (P=0.32) and gender (P=0.16) were not associated with OEF.
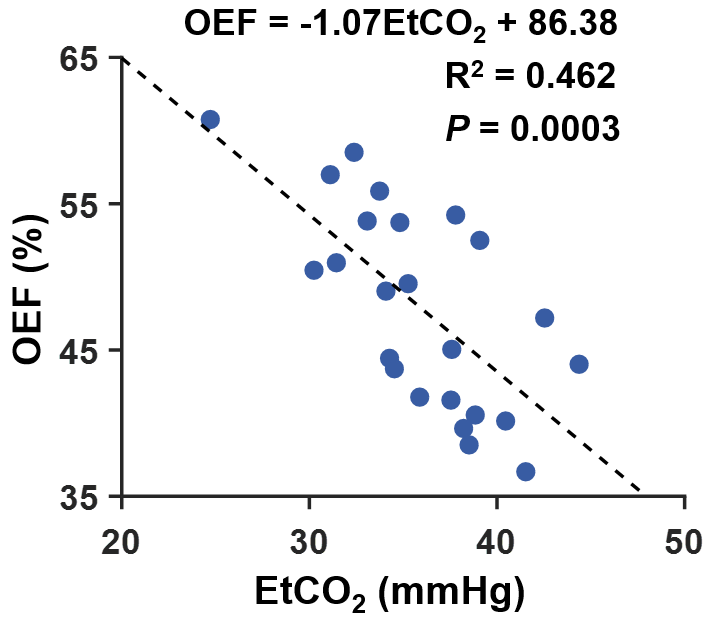
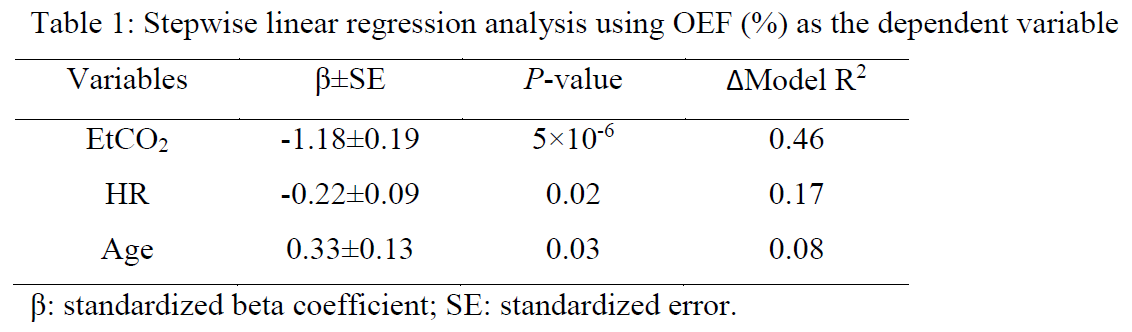
For data from Study 2, EtCO2 and OEF in elderly subjects were 36.0±4.4mmHg and 47.9±6.9%, respectively. Figure 3 shows a scatter plot of OEF and EtCO2. Step-wise linear regression analysis revealed that OEF was inversely correlated with EtCO2 (P=5×10⁻⁶) and HR (P=0.02), but positively correlated with age (P=0.03). Importantly, EtCO2 itself can explain 46% of the inter-subject variations in OEF and, together with HR and age, these variables can explain a total of 71% of the normal variations in OEF. Table 1 summarizes the step-wise regression results.
DISCUSSION AND CONCLUSION
This work demonstrated that, across subjects, OEF is inversely correlated with EtCO2. From the slope of the regression model, it appears that, for each unit increase in EtCO2, the OEF decreases by one unit. Moreover, EtCO2 alone can account for about 50% of inter-subject variances in OEF. These findings were reproducible in two different populations (young and elderly subjects) and on two different MR systems (Siemens and Philips). In addition, age and HR can also account for some variations in OEF. If one can obtain age, EtCO2, and HR information from the subjects, then we can reduce the OEF data variance by 71%, which is expected to substantially enhance the utility of OEF in predicting disease conditions on an individual-level.Acknowledgements
No acknowledgement found.References
1. Derdeyn CP, Videen TO, Yundt KD, Fritsch SM, Carpenter DA, Grubb RL, Powers WJ. Variability of cerebral blood volume and oxygen extraction: stages of cerebral haemodynamic impairment revisited. Brain 2002;125:595-607.
2. Watchmaker JM, Juttukonda MR, Davis LT et al. Hemodynamic mechanisms underlying elevated oxygen extraction fraction (OEF) in moyamoya and sickle cell anemia patients. J Cereb Blood Flow Metab 2018;38:1618-1630.
3. Thomas BP, Sheng M, Tseng BY, Tarumi T, Martin-Cook K, Womack KB, Cullum MC, Levine BD, Zhang R, Lu H. Reduced global brain metabolism but maintained vascular function in amnestic mild cognitive impairment. J Cereb Blood Flow Metab 2017;37:1508-1516.
4. Bush AM, Coates TD, Wood JC. Diminished cerebral oxygen extraction and metabolic rate in sickle cell disease using T2 relaxation under spin tagging MRI. Magn Reson Med 2018;80:294-303.
5. Mintun MA, Raichle ME, Martin WR, Herscovitch P. Brain oxygen utilization measured with O-15 radiotracers and positron emission tomography. J Nucl Med 1984;25:177-187.
6. Lu H, Ge Y. Quantitative evaluation of oxygenation in venous vessels using T2-Relaxation-Under-Spin-Tagging MRI. Magn Reson Med 2008;60:357-363.
7. Liu P, Dimitrov I, Andrews T et al. Multisite evaluations of a T2 -relaxation-under-spin-tagging (TRUST) MRI technique to measure brain oxygenation. Magn Reson Med 2016;75:680-687.
8. Lu H, Xu F, Grgac K, Liu P, Qin Q, van Zijl P. Calibration and validation of TRUST MRI for the estimation of cerebral blood oxygenation. Magn Reson Med 2012;67:42-49.
Figures