3702
The Effect of IC Number Selection in Group ICA for Rat Functional Connectivity1School of Medicine, College of Medicine, Taipei Medical University, Taipei, Taiwan, 2Translational Imaging Research Center, Taipei Medical University Hospital, Taipei, Taiwan, 3Department of Biomedical Imaging and Radiological Sciences, National Yang-Ming University, Taipei, Taiwan, 4Department of Biomedical Imaging and Radiological Science, China Medical University, Taichung, Taiwan, 5Department of Medical Imaging, Taipei Medical University Hospital, Taipei, Taiwan, 6Department of Radiology, School of Medicine, College of Medicine, Taipei Medical University, Taipei, Taiwan, 7Neuroscience Research Center, Taipei Medical University, Taipei, Taiwan
Synopsis
Optimal IC number used in the ICA has been a kernel issue for functional MRI (fMRI) analysis. Nevertheless,
Introduction
Independent component analysis (ICA) approach is one major data-driven analysis for functional MRI (fMRI). The question on the optimal amount of model order, so called independent components (ICs), has been discussed for years.1 In human brains, Abou-Elseoud et al. suggested the optimized selection from 70±10 for fMRI, which offers detailed regions but not yet introduces the split of functionally connected components.2 In rodents, fMRI studies with ICA proposed the IC number from 15 to 40.3-6 Nevertheless, the IC number varies among different research groups. In addition, IC number up to 100 was lately applied to rodent brains for connectome-based models.7 We, thus, aim to explore the effect of IC numbers in rsfMRI analysis in rats and further compare the difference using two echo-planar images (EPI) with commonly used in-plane resolution for rodent brains. EPI protocol at the resolution around 200 micrometers is in general performed in the diffusion and perfusion MRI.8,9 In contrast, Lu et al.,6 proposed a reliable protocol to map default-mode-network in rats using a relatively low-resolution EPI. In this study, EPI at both in-plane resolutions was acquired in animals with the stable and similar physiological status. We demonstrated the change of detected functional regions along with varied IC numbers with different EPI acquisition protocols.
Materials and methods
Male Sprague–Dawley rats (n=22) were anesthetized with isoflurane (1.5-2%) for preparation. Animal MRI was performed on a Bruker 7 T PharmaScan with a volume coil as the transmitter and a rat surface coil as the receiver. The cocktail of dexmedetomidine and isoflurane was used for anesthesia during MRI.6 Resting state fMRI (rsfMRI) was acquired using the single-shot EPI with TR/TE= 1000/15 ms, 16 slices, slice thickness of 1 mm and number of repetition= 300 for total scan time= 5 min. The spatial resolution of 546 µm and 208 µm was used for low-res and high-res image batch, respectively, and was sequentially performed in each animal. T2-weighted images with the same geometry were also acquired. Slice timing and spatial smoothing were performed on SPM8 after pre-processing. rsfMRI data were analyzed using gICA with the following IC numbers, 10, 20, 25, 30, 40, 50 and 100 by GIFT software package. The connectivity strength and the volume of each component in the somatosensory cortex (SSCx) and thalamus (Table 1) were analyzed.Results & Discussion
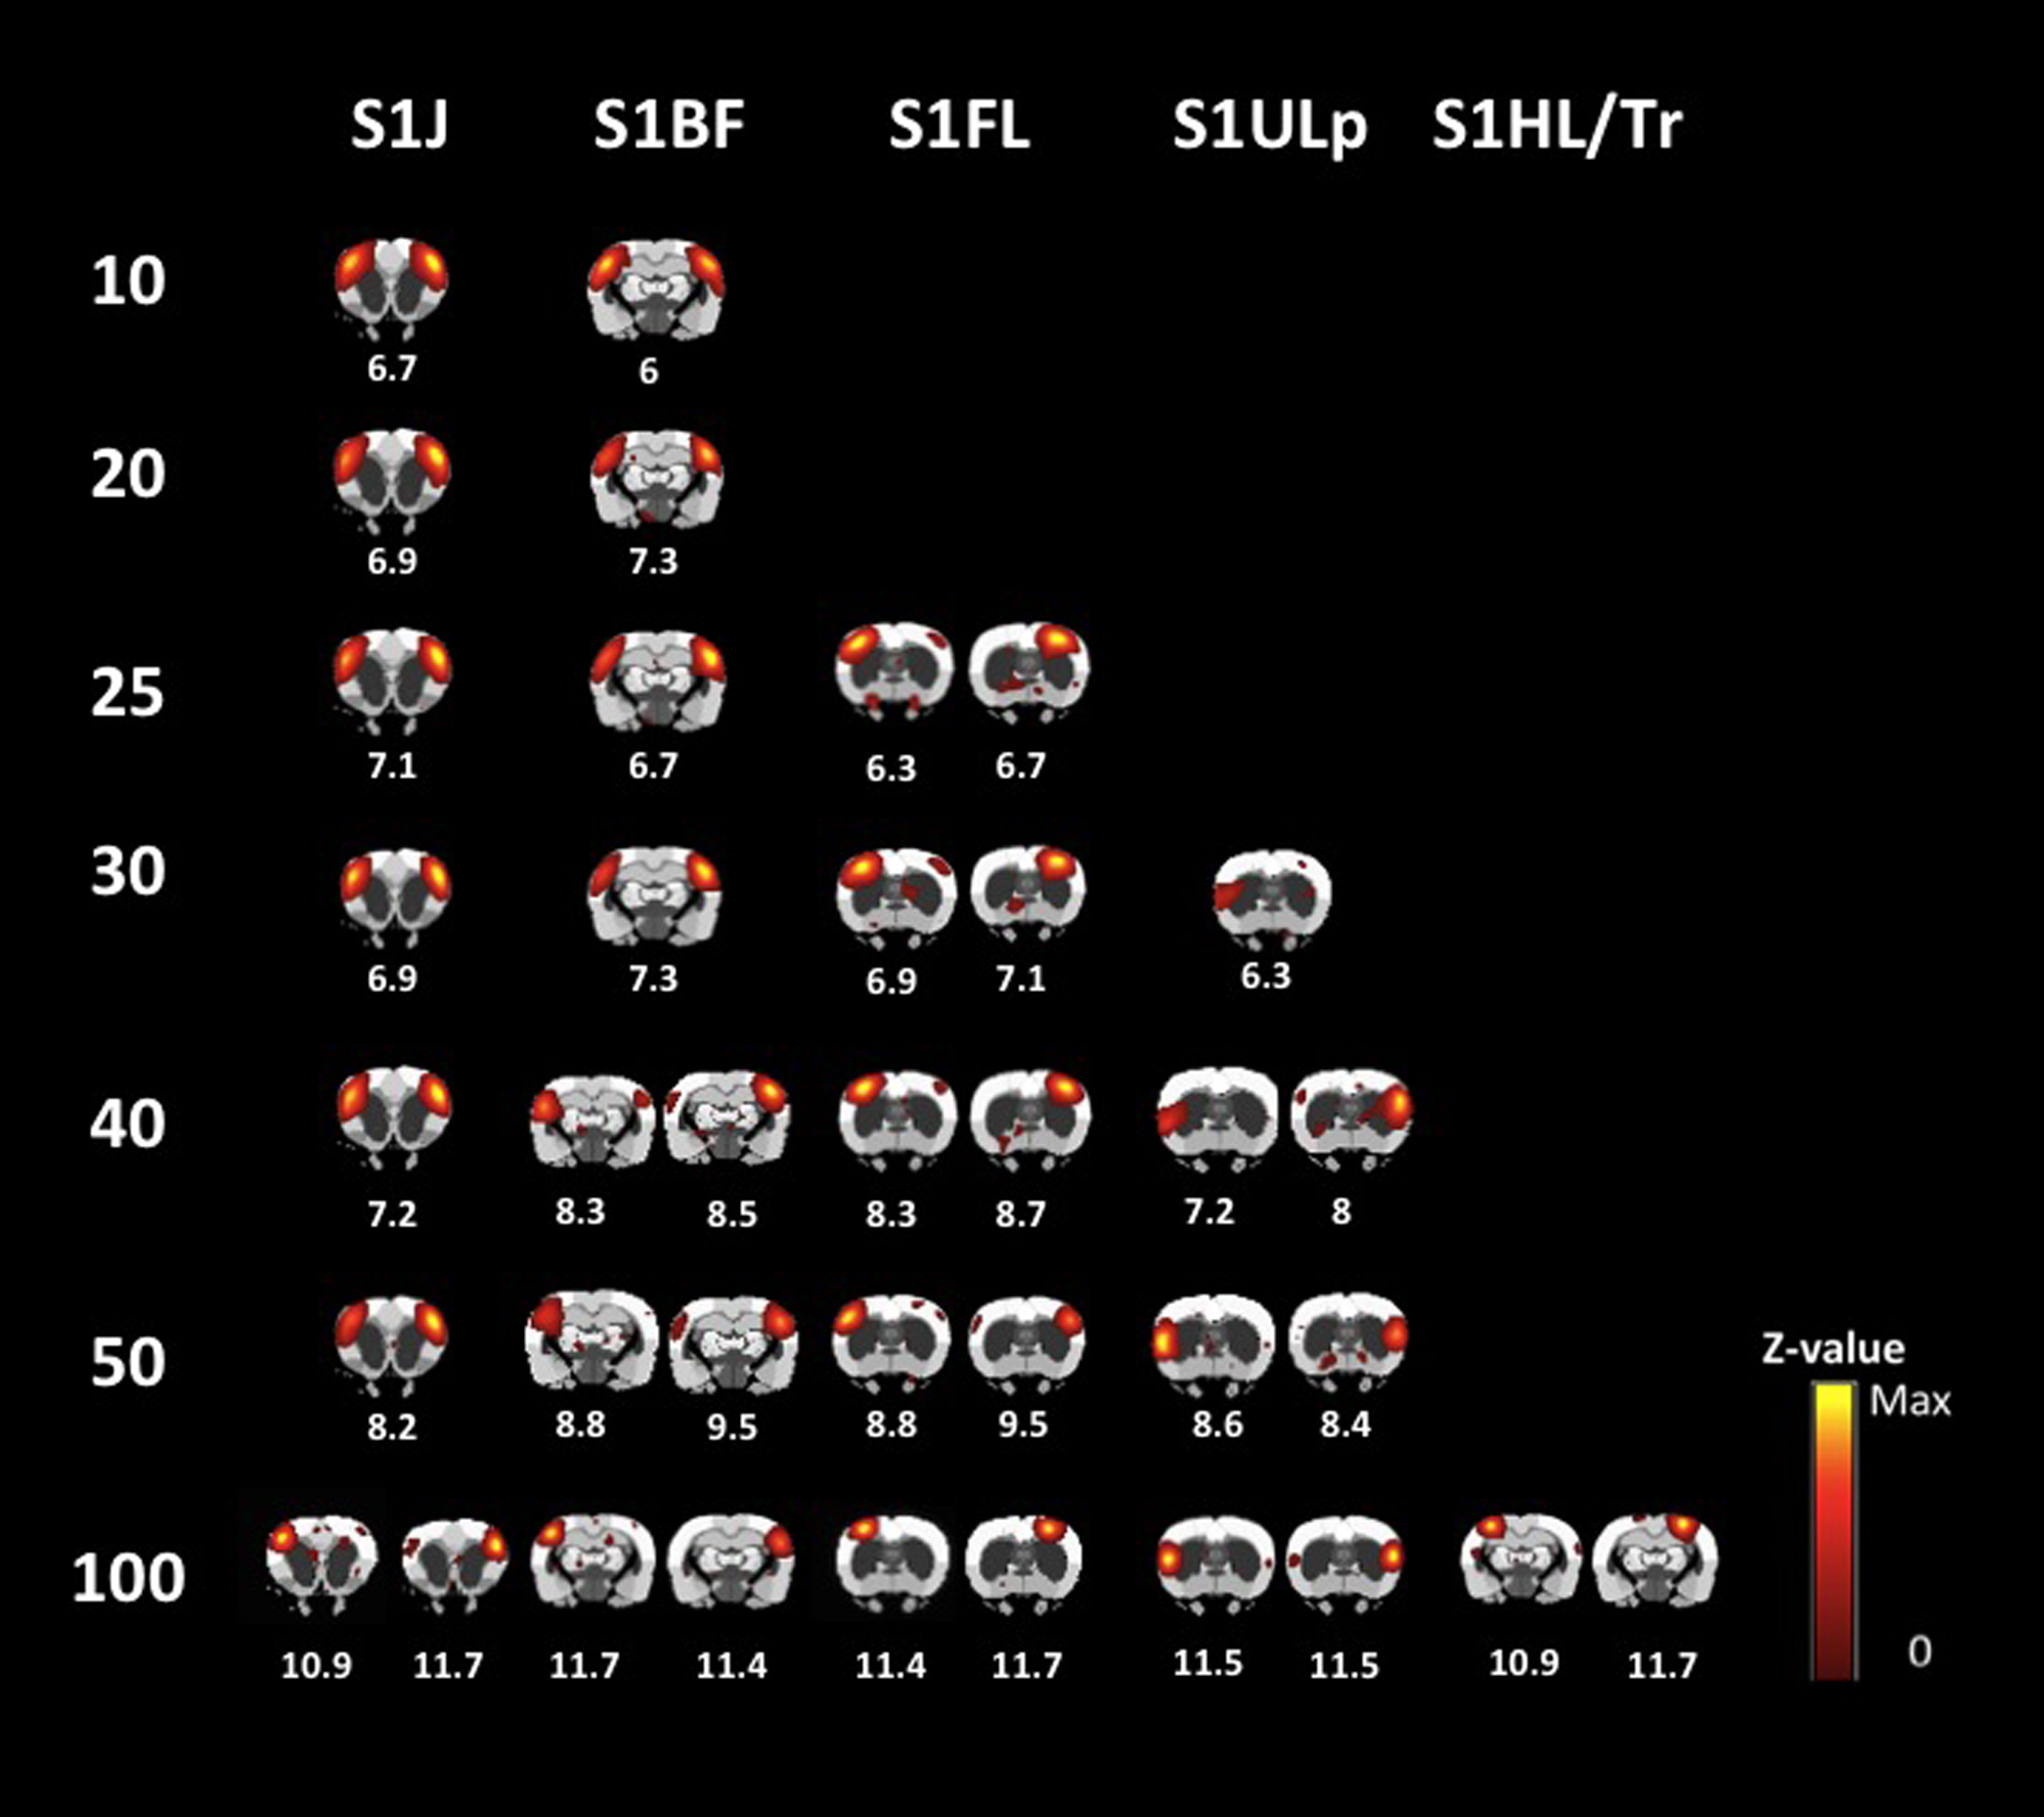
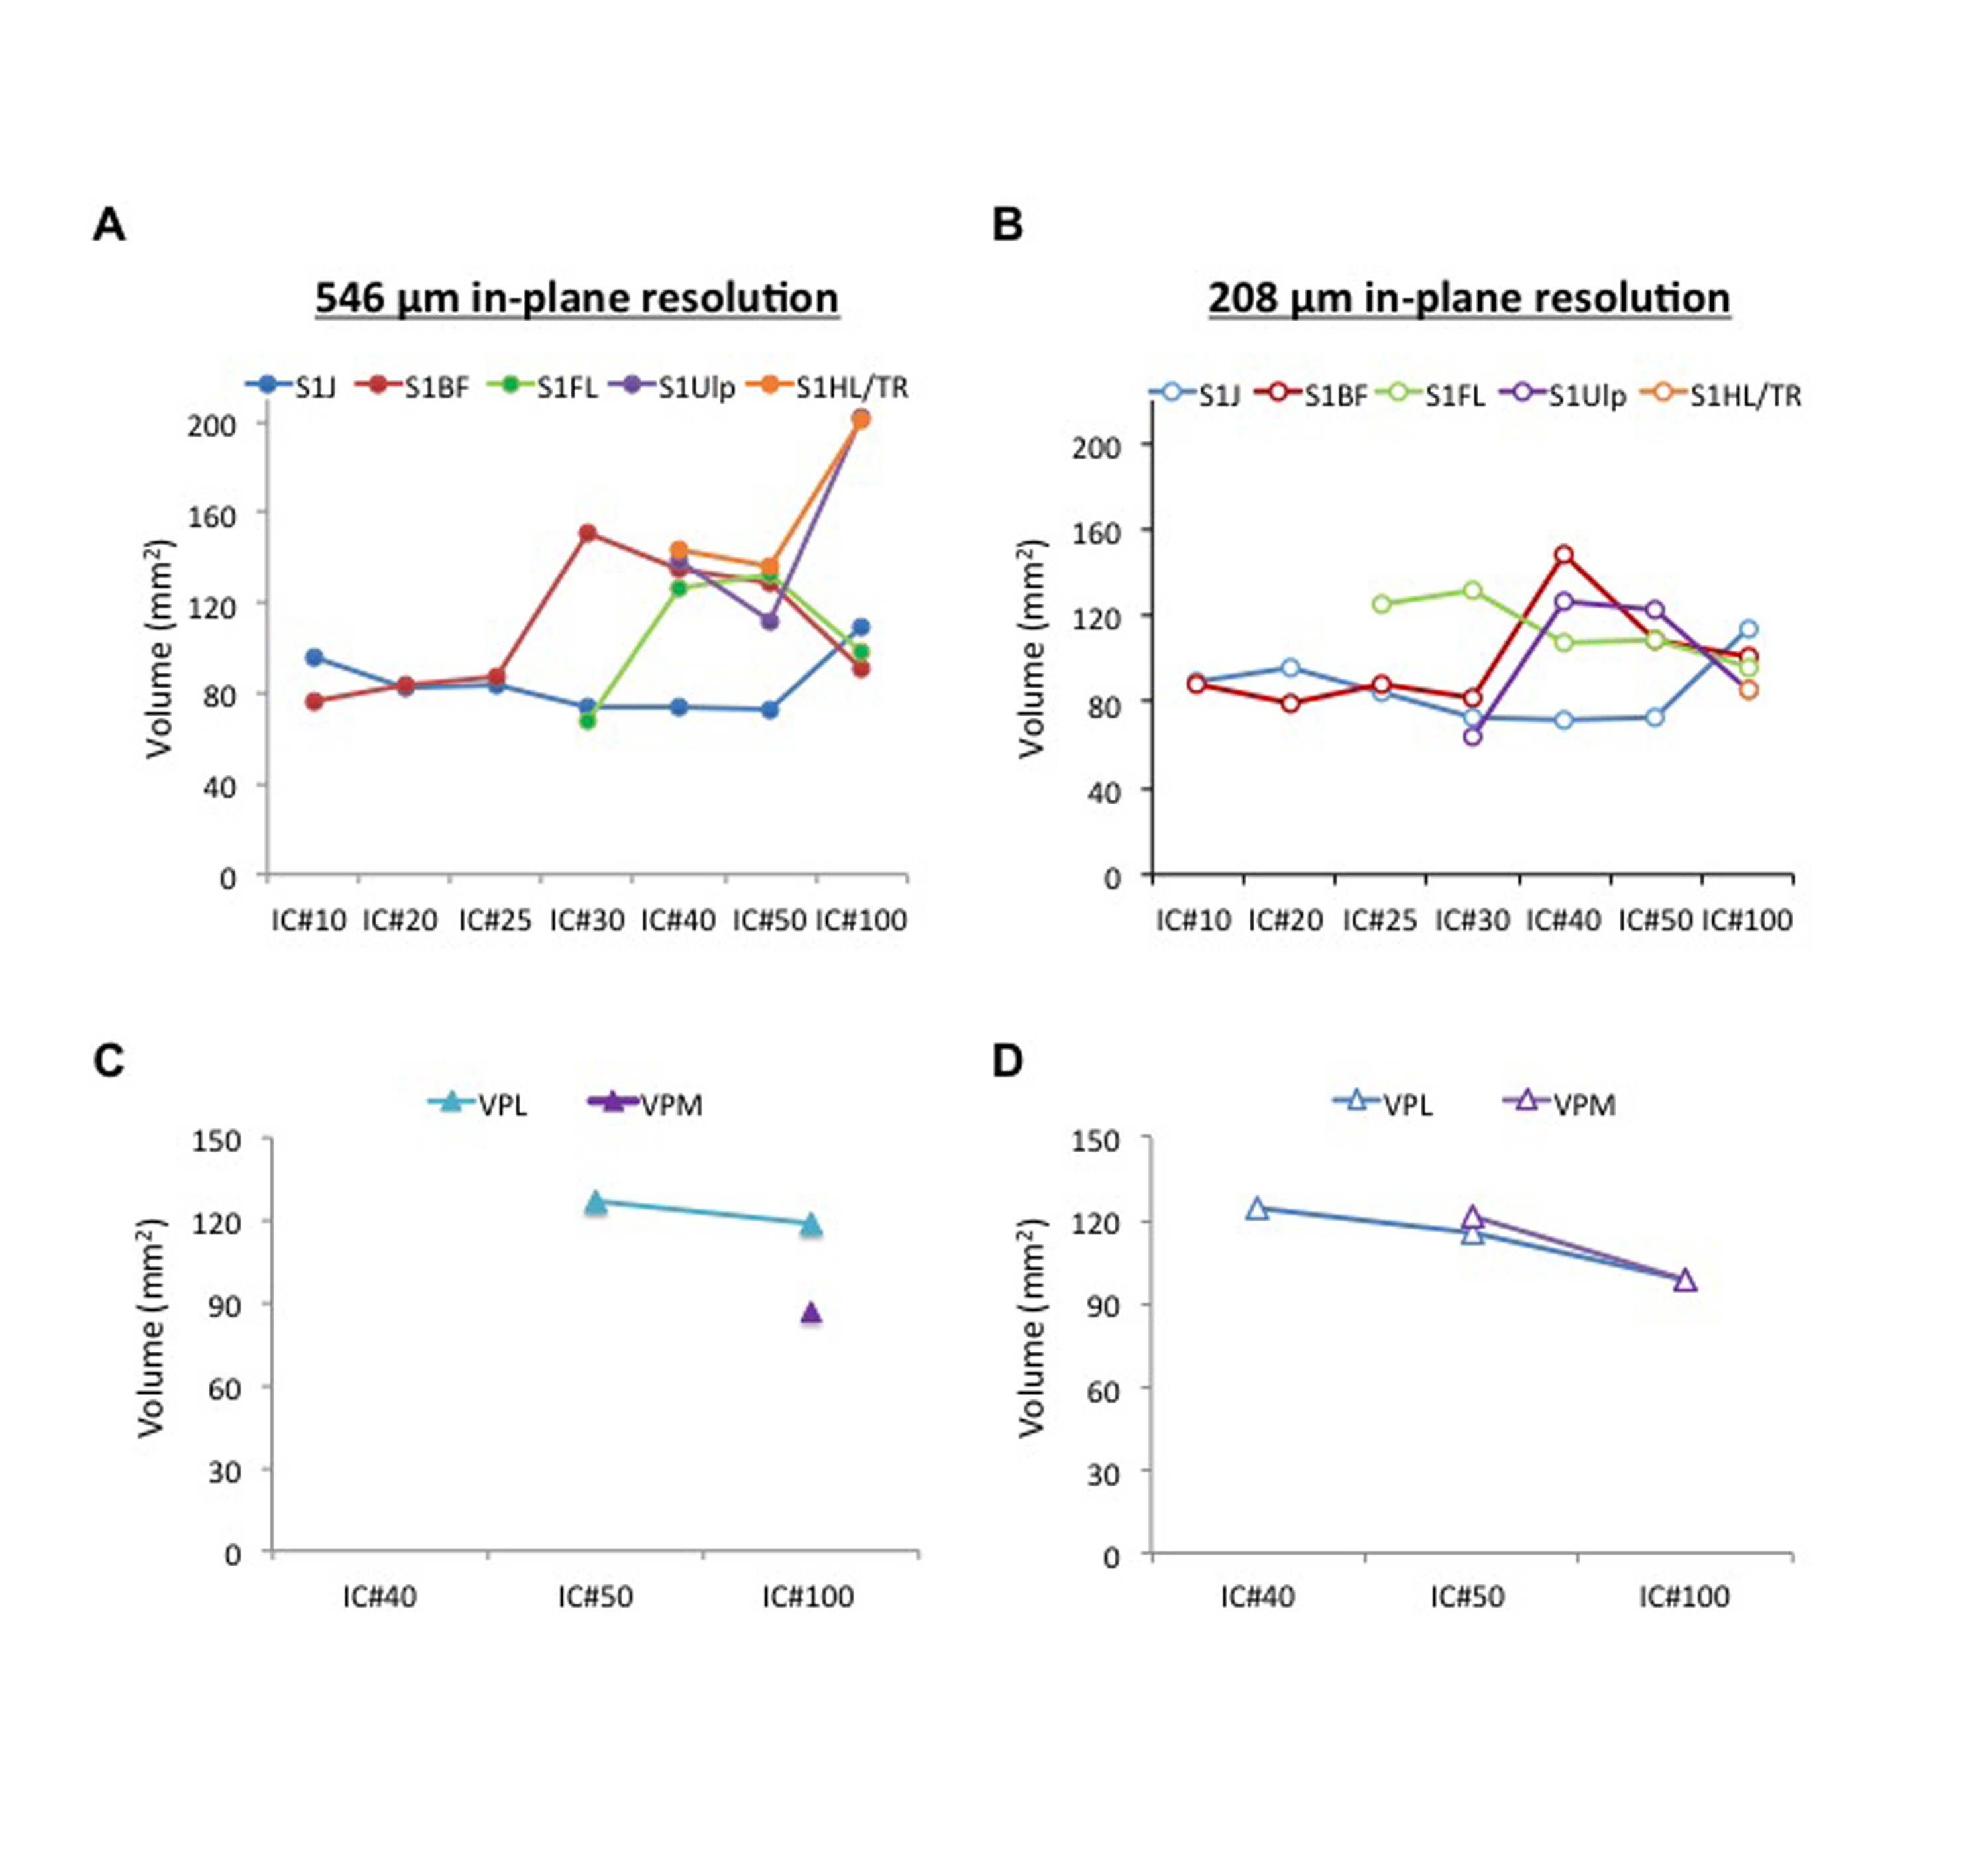
Regardless of the spatial resolution of EPI images, we observed the similar trend in region detection in the SSCx (Fig 1&2). The S1BF and S1J were identified at lowest IC number (IC number=10); the S1FL and S1Ulp were detected subsequently, and eventually the S1HL/Tr appeared. Compared with the high-res data showing the S1HL/Tr at IC number= 100, the S1HL/Tr regions were detected as early at IC number= 40 in the low-res data. Most of regions in the left and right SSCx were assigned separately to different ICs at IC number= 40. Additional components of S1ULp and S1HL/Tr located majorly in the anterior part of the brain were detected at IC number= 100 solely in the low-res batch, supported by the increased region volume (Fig 4A). Similar trend in region detection was also observed in the thalamus; VPL was detected earlier than VPM (Fig 3). Increase of Z-value was shown in each detected regions as IC number increased. For quantitative volume calculation, we observed no significant difference in most SSCx regions detected between high- and low-res EPI (Fig 4). The increase of volume in the functional region was majorly due to the split of regions into hemispheres. Of note, both two protocols detected default mode network at IC number 20. so-called, our results suggested that EPI protocol in the resolution for regular diffusion and perfusion MRI is also feasible to detect the similar functional regions to the proposed rsfMRI protocol showing reliable brain connectivity.Acknowledgements
This study was funded in part by Ministry of Science and Technology (107-2813-C-038-098-B, MOST 106-2218-E-039-001-MY3 and MOST 107-2314-B-038-005), Taipei, Taiwan.References
1. Iraji, A., et al., The connectivity domain: Analyzing resting state fMRI data using feature-based data-driven and model-based methods. Neuroimage, 2016. 134: p. 494-507.
2. Abou-Elseoud, A., et al., The effect of model order selection in group PICA. Hum Brain Mapp, 2010. 31(8): p. 1207-16.
3. Grandjean, J., et al., Dynamic reorganization of intrinsic functional networks in the mouse brain. Neuroimage, 2017. 152: p. 497-508.
4. Hsu, L.M., et al., Constituents and functional implications of the rat default mode network. Proc Natl Acad Sci U S A, 2016. 113(31): p. E4541-7.
5. Hutchison, R.M., et al., Functional networks in the anesthetized rat brain revealed by independent component analysis of resting-state FMRI. J Neurophysiol, 2010. 103(6): p. 3398-406.
6. Lu, H., et al., Rat brains also have a default mode network. Proc Natl Acad Sci U S A, 2012. 109(10): p. 3979-84.
7. Mechling, A.E., et al., Deletion of the mu opioid receptor gene in mice reshapes the reward-aversion connectome. Proc Natl Acad Sci U S A, 2016. 113(41): p. 11603-11608.
8. Kao, Y.C., et al., Dynamic perfusion and diffusion MRI of cortical spreading depolarization in photothrombotic ischemia. Neurobiol Dis, 2014. 71: p. 131-9. 9. Kao, Y.J., et al., Role of Genetic Variation in Collateral Circulation in the Evolution of Acute Stroke: A Multimodal Magnetic Resonance Imaging Study. Stroke, 2017. 48(3): p. 754-761.
Figures