3701
Creation and evaluation of a generic rat hemodynamic response function for analysis of BOLD fMRI measurements1Translational Research Imaging Center (TRIC), University Hospital Muenster, Muenster, Germany
Synopsis
For a reliable analysis of BOLD fMRI data, a suitable model of the hemodynamic response is essential. Therefore, an accurate model of the BOLD response of small animals is required in preclinical studies. Commonly used analysis tools like SPM or BrainVoyager have implemented HRFs optimized for humans by default. Since the BOLD responses of rats proceed faster than those of humans, we have determined a generic rat HRF based on 98 BOLD measurements of 35 rats which can be used for statistical parametric mapping. Statistical analysis of rat data showed a significantly improved detection performance using this rat HRF.
Purpose
To improve statistical analysis of rodent data by creating a generic rat hemodynamic response function (HRF).Introduction
Since fMRI is frequently performed on small animals, it is important to have a realistic model of their BOLD response. According to the linear model, the BOLD response is often modeled as a convolution of neuronal activity and a HRF. The HRF is often represented by two gamma functions and then named canonical HRF. A commonly applied method for statistical analysis is the general linear model (GLM) with the canonical basis set, where the convolution of the HRF with the stimulation is used as a model. To avoid false positive and negative voxels it is crucial that this model fits well to the measured BOLD responses. The software package Statistical Parametric Mapping (SPM)1 has implemented a canonical HRF by default, which is based on human data (human HRF). Application of this human HRF may not be appropriate for small animal data.Methods
Experiments were performed on SD and Fischer rats under medetomidine or isoflurane anesthesia at 9.4 T with single-shot GE-EPI (TR/TE 100/18ms, 350x325μm² or 375x375μm², 8-14 1.2mm thick slices) upon electrical paw, mechanical paw or optogenetic stimulation using block design paradigms. Measurements were assigned to 13 different groups according to their experimental conditions (e.g. strain, anesthesia, stimulation) (Table 1). Positive BOLD responses of realigned (SPM8) datasets were extracted and examined using MATLAB: A U-test determined voxelwise whether the signal during stimulation and rest period differed significantly for the S1 region on the activated side of the brain. Time courses of the BOLD responses were calculated by summing up the signal of all voxels, which showed a significant and positive signal change, and subsequently averaging over all stimulation cycles. The convolution of the stimulation paradigm and the canonical HRF was fitted to the time course of the BOLD responses. The canonical HRF was defined as in SPM1, expanded by an amplitude parameter A: $$ A \cdot e^{-bt}\left( \frac{b^{p_1}}{\Gamma \left( p_1\right) } \cdot t^{p_1-1} - \frac{b^{p_2}}{V \cdot \Gamma \left( p_2\right) } \cdot t^{p_2-1}\right)$$ A least squares fit of this equation to the measured BOLD response was performed. Time courses of the normalized HRFs for the different groups were compared pairwise, using a customized functional t-test2. Resulting p-values were Bonferroni corrected. All HRFs were normalized and averaged across all groups that showed no substantial differences. The canonical HRF (without amplitude A) was fitted to the resulting time course of the rat HRF. The resulting parameters (b, p1, p2, V) characterize a generic rat HRF and can be implemented in SPM. To test the detection performance of the GLM framework after implementation of the generic rat HRF, statistical analysis was performed on 20 datasets (electrical paw stimulation of Fischer rats: 5s ON, 25s OFF or 10s ON, 20s OFF), which had not been used to derive the HRF. Datasets were realigned and smoothed using a 0.5-mm Gaussian kernel. Analysis was performed with the 1st order canonical basis set using the generic rat or, for comparison, the human HRF. Cluster sizes and the maximal t-values were investigated using a U-test in SPSS.
Results
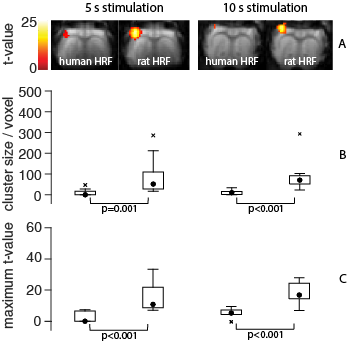
BOLD responses of 146 fMRI measurements were extracted and 71 % were fitted successfully. A total of 15 comparisons between different stimulation conditions (Table 1) were made. The functional t-tests did not show significant differences for any of the pairs. However, the HRFs of 1s and 5s stimulation duration tended to show differences in timing of maximum and undershoot (p=0.06, Figure 1). Due to these differences HRFs obtained from 1s stimulation were excluded from the determination of a generic rat HRF. Averaging of the remaining HRFs delivered a generic rat HRF based on 98 BOLD measurements of 35 animals. This HRF deviated substantially from the human HRF (Figure 2): The maximum occurred after (2.8±0.8)s and the undershoot after (6.7±3.9)s, as compared to 5s and 15s for the human HRF1, respectively. The generic rat HRF was characterized by the parameters b=1.7, p1=6.4, p2 V=1.6. Analyzing the data with the first order canonical model using the generic rat HRF instead of the human HRF BOLD clusters and t-values were significantly larger (Figure 3).Conclusion
With exception of the stimulation length, the HRF of rats is independent of the experimental conditions examined. The determined generic rat HRF proceeds faster than the human HRF. Due to these differences, the GLM analysis of rodent data showed a significantly higher detection performance after implementation of the generic rat HRF in SPM. We therefore advise using this generic rat HRF for analysis of rat BOLD fMRI measurements.Acknowledgements
No acknowledgement found.References
1. Friston, K.J., 2017. SPM12. Wellcome Trust Centre for Neuroimaging.
2. Ramsay, J., Hooker, G., Spencer, G., 2009. Functional Data Analysis with R and MATLAB, 1st ed. Springer, Dordrecht, Heidelberg, London, New York.
Figures