3698
Signal changes in functional diffusion measurements in rats are not caused by tissue heating, but have a vascular contribution1Translational Research Imaging Center (TRIC), University Hospital Muenster, Muenster, Germany
Synopsis
Functional diffusion MRI has been proposed as an alternative to BOLD fMRI, to offer a more direct read-out of neuronal activation. One aspect of the controversial discussion around functional diffusion is whether these signals follow the neuronal activation more closely. We performed BOLD and diffusion measurements with 250 ms temporal resolution upon sensory stimulation and found similar temporal evolutions for BOLD and diffusion signals. Specifically, both signals slowly returned to baseline after the stimulus. However, diffusion measurements with b=500 showed an earlier onset. We performed heat application to rule out tissue heating as a contribution to functional diffusion signals.
Introduction
BOLD fMRI is a non-invasive neuroimaging method that offers brain-wide coverage and good spatial resolution. However, the BOLD signal is not a direct measure of neuronal activity but mainly arises from the changed proportion of deoxyhemoglobin in veins and is related to neuronal activity through neurovascular coupling. Diffusion fMRI (DfMRI) has been proposed to be more directly related to neuronal activity than BOLD fMRI 1. The possible signal sources of DfMRI have been controversially discussed and include cell swelling (of neurons and/or glia cells) and vascular contributions 2,3. In rodents the local rise in brain temperature due to inflowing blood from the body core has also been discussed as a contribution to functional signals 4. We performed GE-BOLD and SE diffusion measurements with high temporal resolution of 250 ms to compare temporal evolutions of the two modalities that may point to a more direct neuronal impact on DfMRI.Methods
We acquired GE-BOLD (n=14 electric stimulation, n=14 heat application) and SE diffusion measurements with b=500 and b=1000 (each n=14 electric stimulation, n=14 heat application) in 5 naïve female Fischer rats using a 9.4 T small animal MRI and a 1 cm surface coil as receiver coil. All measurements were performed under medetomidine sedation in ventilated rats.
First, standard GE-BOLD measurements with TR 1 s and brain-wide coverage were acquired to verify activated brain regions. In those regions measurements with TR of 250 ms were performed with electric forepaw stimulation (5 s stimulation, 25 s rest, 9 Hz, 1.5 mA, 1-ms pulses) or heat application by laser light 5,6 (200-µm optic fiber implanted in S1Fl, 5 s stimulation, 25 s rest, 180-200 mW/mm², 9 Hz, 100-ms pulses). Scan parameters for the GE-BOLD measurements were: TR= 250 ms, TE=18 ms, FA=30°. Scan parameters for SE diffusion measurements were: TR=250 ms, TE=35.85 ms, δ=2 ms, Δ=15 ms, b-values=500 and 1000, FA=150° 7, single SE preparation. All scans were acquired with an 80 x 80 matrix and a FOV of 26 mm x 28 mm, 2 or 3 slices, 1.2 mm slice thickness.
The data were preprocessed (realigned) and then analyzed with a custom-written MATLAB script. First, a ROI covering S1Fl was drawn in slices with activation. A U-test (Bonferroni corrected) was performed to determine activated voxels. Voxels with negative and positive signal changes were averaged separately, each across slices and stimulation trials. Time courses based on less than 3 active voxels were discarded. In addition to these averaged time courses, summed time courses weighted by the number of active voxels in each measurement were calculated.
Results and Discussion
Electric stimulation
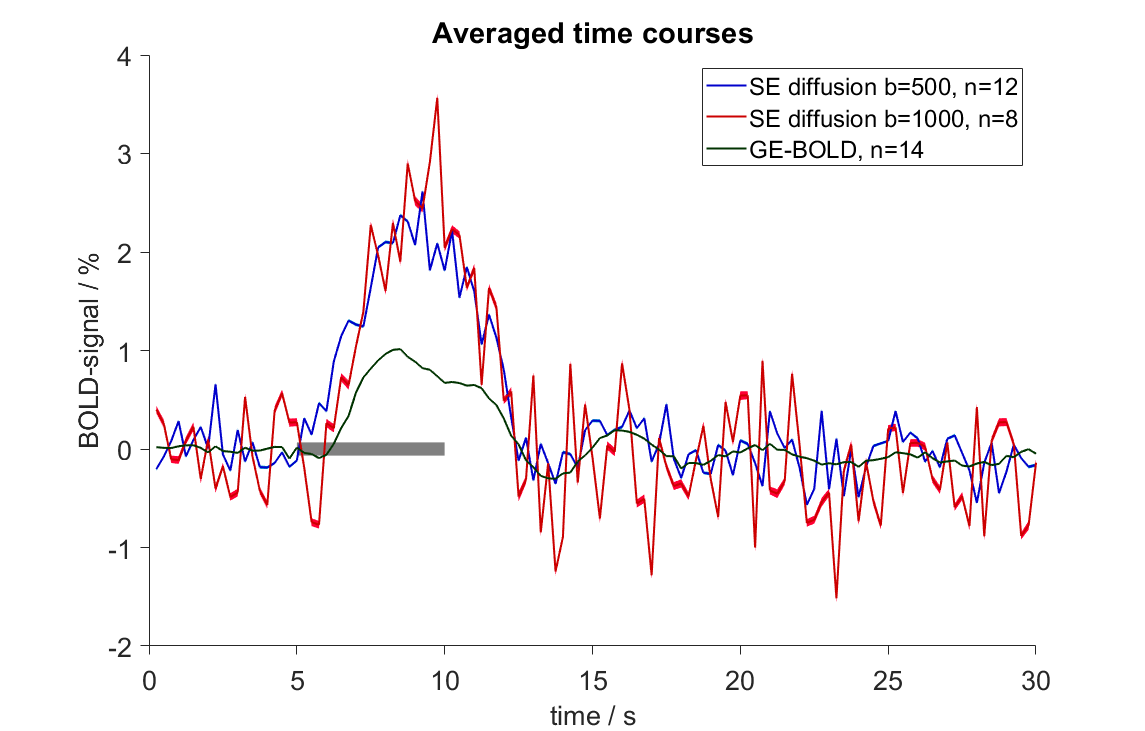
We found a positive signal change upon forepaw stimulation in SE diffusion measurements with b=500 (n=12 of 14 measurements) and b=1000 (n=8 of 14 measurements). Diffusion signal amplitudes increased with increasing b-value (b=500 2.6 % and b=1000 3.6%) (Fig. 1), as observed previously by Tsurugizawa et al. 8.
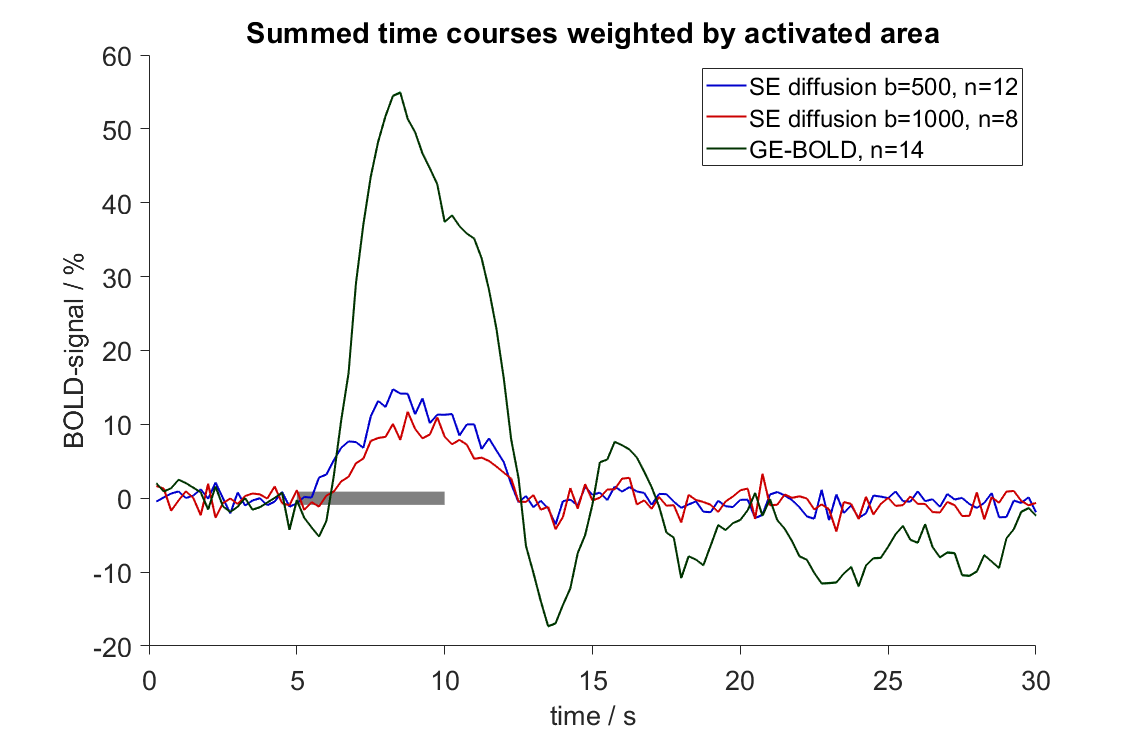
The onset (defined by the first value above baseline after start of the stimulation) for SE diffusion measurements with b=500 was observed immediately after stimulation. Onset for SE diffusion measurement with b=1000 was observed 1000 ms after stimulation and for GE-BOLD 1250 ms after stimulation (Fig. 1 and Fig. 2). Diffusion signal amplitudes for both b-values did not return faster to baseline than the BOLD signal. This was in contrast to a study conducted in isoflurane-anesthetized rats where the diffusion signal returned to baseline directly after the stimulus had ended 8. The prolonged signal observed in our study suggests a slow vascular contribution to the DfMRI signal and is in line with another recent study conducted in medetomidine-sedated rats, which also found prolonged DfMRI signals upon stimulation 9.
Heat application
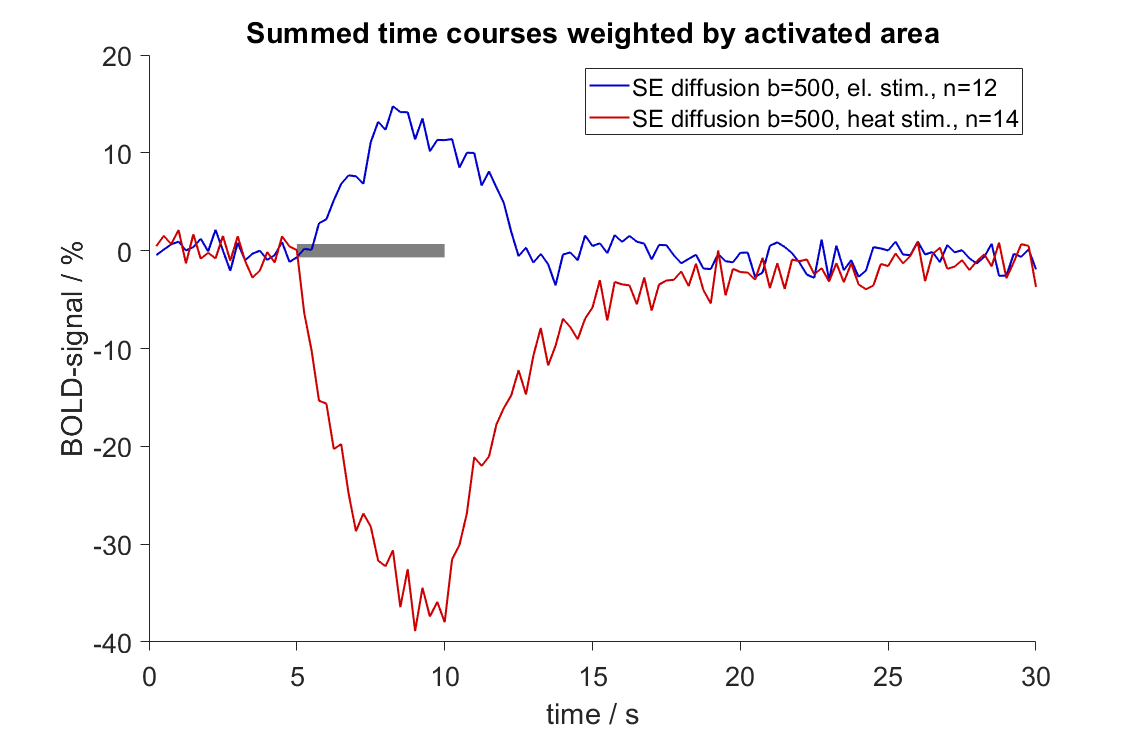
Heat application led to a pronounced negative signal change in the SE diffusion measurement. Since electric stimulation only led to positive signal change in the SE diffusion measurement, heat could be ruled out as a signal source for DfMRI (Fig. 3). However, it cannot be ruled out that heat production leads to a reduction of the observed signal.
Conclusion
Measurements with high temporal resolution revealed similar temporal evolutions for BOLD and DfMRI signals. Heat production due to increased metabolism or inflow of warmer blood, could be ruled out as a positive contributor to the DfMRI signal. The temporal evolution of our diffusion measurements upon electric forepaw stimulation are in line with another recent study conducted in medetomidine-sedated rats, but less well with one conducted in isoflurane-anesthetized rats. Future research is needed to separate the effects of anesthesia and acquisition protocols (GE-BOLD, SE diffusion) on the temporal evolution of functional measurements.Acknowledgements
No acknowledgement found.References
1 Darquié A, Poline JB, Poupon C, et al. Transient decrease in water diffusion observed in human occipital cortex during visual stimulation. PNAS 2001;98(16):9391-9395.
2 Le Bihan D, Urayama S-I, Aso T, et al. Direct and fast detection of neuronal activation in the human brain with diffusion MRI. PNAS 2006;103(21):8263-8268.
3 Miller KL, Bulte DP, Devlin H, et al. Evidence for a vascular contribution to diffusion FMRI at high b value. PNAS 2007;104(52):20967-20972.
4 Harris SS, Boorman LW, Das D, et al. Physiological and Pathological Brain Activation in the Anesthetized Rat Produces Hemodynamic-Dependent Cortical Temperature Increases That Can Confound the BOLD fMRI Signal. Frontiers in Neuroscience 2018;12:550.
5 Christie IN, Wells JA, Southern P, et al. fMRI response to blue light delivery in the naive brain: Implications for combined optogenetic fMRI studies. NeuroImage 2012;66:634-641.
6 Schmid F, Wachsmuth L, Albers F, et al. True and Apparent Optogentic BOLD fMRI Signals. MRM 2017;77(1):126-36.
7 Elster AD and Provost TJ. Large-Tip-Angle Spin-Echo Imaging. Investigative Radiology 1993;28(10):944-953.
8 Tsurugizawa T, Ciobanu L and Le Bihan D. Water diffusion in brain cortex closely tracks underlying neuronal activity. PNAS 2013;110(28):11636-11641.
9 Nunes D, Ianus A and Shemesh N. Layer-specific connectivity revealed by diffusion-weighted functional MRI in the rat thalamocortical pathway. NeuroImage 2018; doi:10.1016/j.neuroimage.2018.09.050.
Figures