3697
Comparisons of resting-state networks obtained at 3 and 7 Tesla MRI in anesthetized rhesus monkey1Center for Neuroscience Imaging Research, Institute for Basic Science, Suwon, Korea, Republic of, 2Department of Electrical and Computer Engineering, Sungkyunkwan University, Suwon, Korea, Republic of, 3School of Electronic and Electrical Engineering, Sungkyunkwan University, Suwon, Korea, Republic of, 4Department of Biomedical Engineering, Sungkyunkwan University, Suwon, Korea, Republic of
Synopsis
Understanding resting-state fMRI (rsfMRI) is an important issue to identify the functional principles of the normal and pathological brain networks. Despite the importance in comprehending network as a whole, a deeper understanding of the resting-state networks is limited due to the lack of a proper animal model. Here, we used anesthetized non-human primate (NHP) for understanding rsfMRI networks commonly detected in humans. BOLD and MION-enhanced CBV rsfMRI networks were obtained at 3T and 7T. Stable eight cortical networks were observed from MION experiments at 3T and 7T, and similar networks were also detected from 7T BOLD due to enhanced sensitivity.
Introduction
The rsfMRI connectivity has contributed considerably to our understanding of the normal networks and disease-induced modified networks. However, its underlying physiological relevance is not well-understood (1, 2). To investigate sources of rsfMRI networks, a non-human primate (NHP) model is preferable due to its biological affinity to humans (3, 4). Here, resting state networks were obtained in anesthetized NHP to examine whether commonly-observed rsfMRI networks in humans also exist in NHP. Two different imaging approaches (BOLD and MION-enhanced CBV) at two fields of 3 T and 7T were used and compared.Methods
Animals and experimental procedure
Male rhesus macaques (5~7 yrs, 5-8 kg, n=6) were used in accordance with IACUC guidelines. For 3T rsfMRI imaging, the anesthetic condition was maintained with continuous medetomidine infusion (0.03 mg/kg/hr) through the saphenous vein and 0.3% of isoflurane (Datex-Ohmeda, GE Healthcare, WI), while isoflurane (1%) was used for 7T. End-tidal CO2, arterial oxygen saturation, and body temperature were maintained within a normal range throughout the experiments. MION (8~10 mg/kg) was injected after obtaining BOLD fMRI.
MRI
BOLD and MION enhanced CBV fMRI data were collected by a gradient-echo echoplanar whole-brain pulse sequence using 3T Siemens Prisma (TR=1.2s, TE=21ms, slice thickness = 1.29mm, and 42 slices for BOLD and MION fMRI) and 7T Terra (TR=1.2s, TE=22ms for BOLD and TE=20ms for MION, slice thickness=1.3mm and 42 slices). Each scan consisted of 590 volumes and lasted ~12min. T1-weighted brain anatomical images were acquired at 3T (MPRAGE; TR=2.3s, TE=3.47ms, slice thickness=0.5mm) and at 7T (MP2RAGE; TR=4.3s, TE=2.12ms, inversion times T11/T12=840/2370 ms, slice thickness=0.5mm).
Data analysis
Preprocessing was conducted using FSL software (5) and Matlab. Skull removal and magnetic field inhomogeneity correction were conducted on T1-weighted images (6). For rsfMRI, head motion and slice timing were corrected. Intensity normalization of 4D data was applied with a value of 10,000. The functional images were co-registered to a high-resolution T1-weighted anatomical image of the monkey’s own brain and was then normalized to the D99 template (7). Cerebrospinal fluid, white and gray matter, and head motion-related contributions were regressed out. High-pass filtering using a cut-off period of 100 sec was applied. Spatial smoothing with a full width at half maximum of 3 mm was applied. A group independent component analysis (ICA) approach was performed using temporally concatenated preprocessed rsfMRI data. Among the independent components (ICs) generated through ICA, eight known cortical networks of monkey were isolated and used for further analysis.
Result
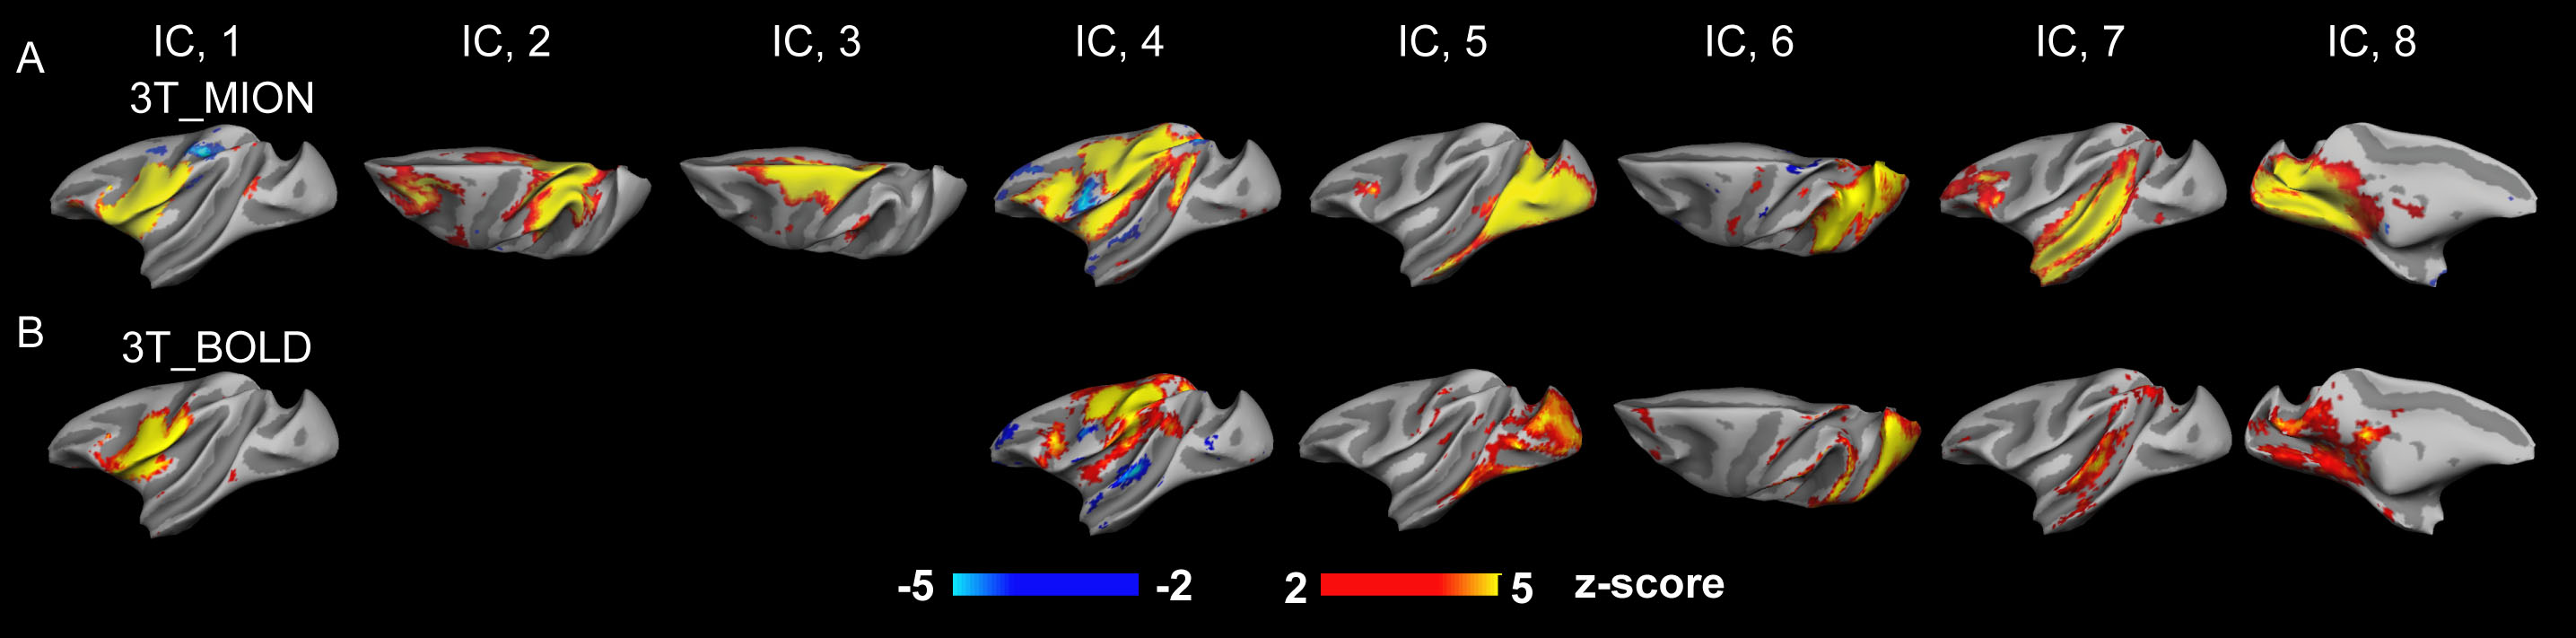
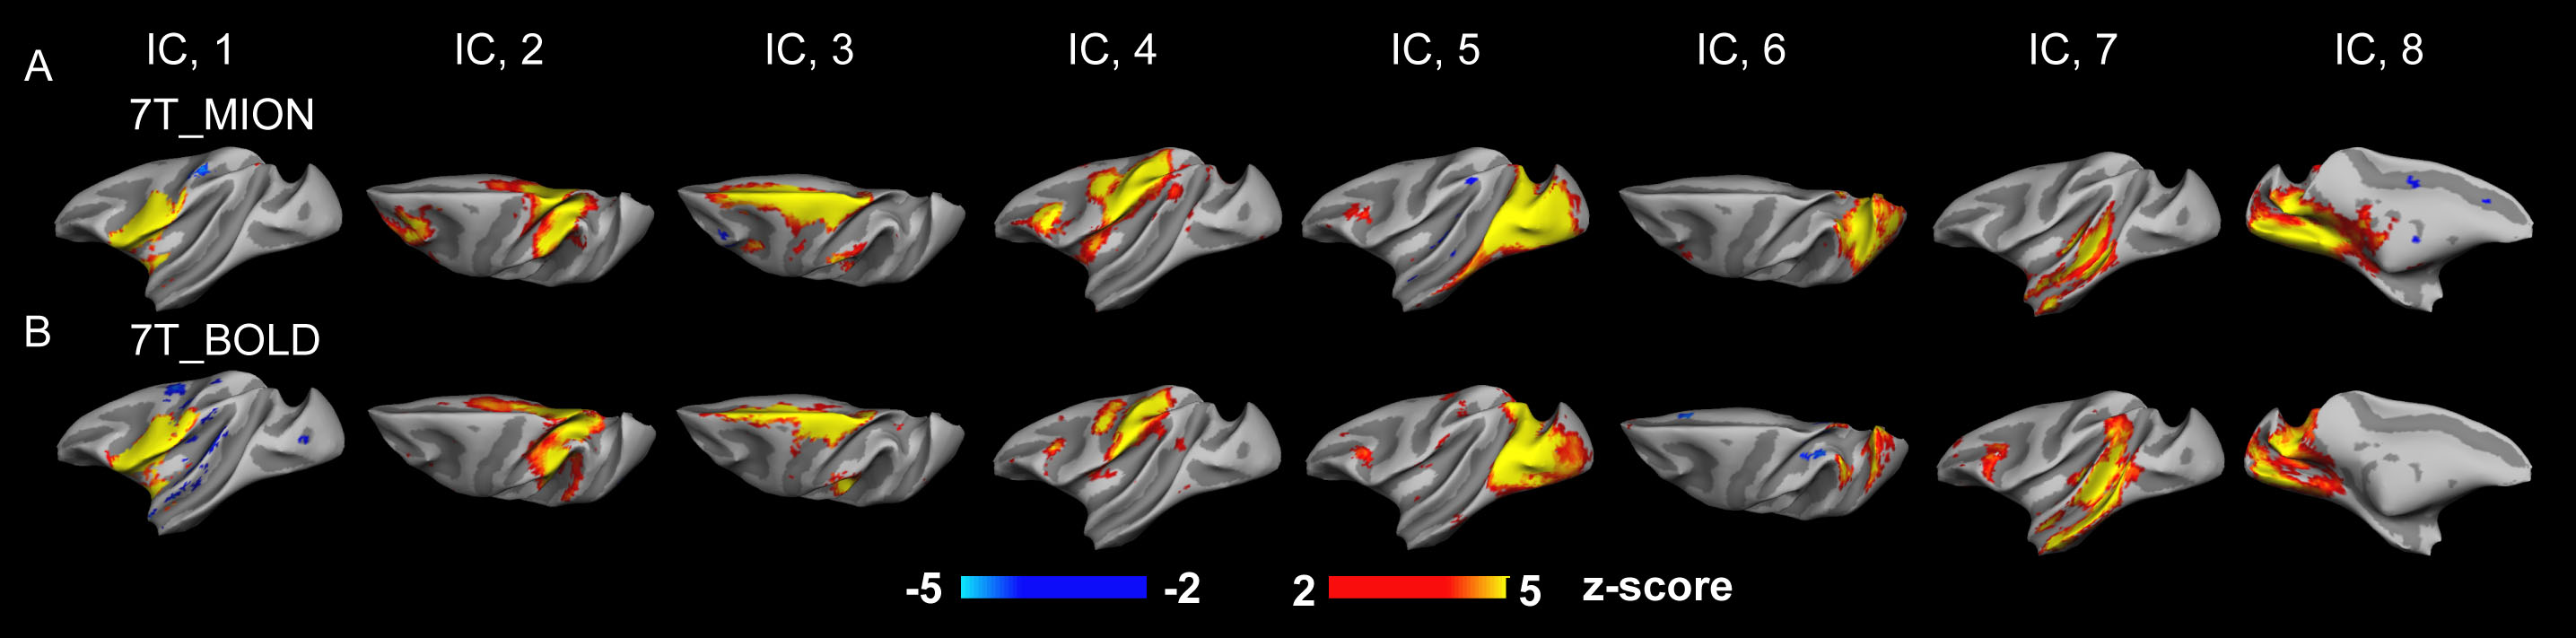
The group ICA on 3T MION data (animal n=4, session n=36) identified eight cortical ICs (Fig 1A), which were ventral premotor, default-mode-like, somatomotor, attentional/oculomotor, higher visual, parieto-occipital, auditory and visual networks. These cortical ICs of medetomidine anesthetized monkeys were relevant to rsfMRI networks observed in human and monkey (3, 8, 9). In contrast, default mode and somatomotor networks among 8 networks were not reliably identified from 3T BOLD data (Fig 1B, animal n=4, session n=23) due to a low BOLD sensitivity. At 7 T, similar eight networks were successfully identified in both BOLD and MION data of isoflurane anesthetized monkeys (Fig 2A, B, animal n=5, session n=6 for MION, animal n=5, session n=8 for BOLD).Discussion
We obtained consistent and reliable resting state networks from 3T MION, 7T BOLD and 7T MION due to enhanced sensitivity with MION or with ultrahigh field MR. Although we used different anesthesia between 3T and 7T experiments, similar results from both MION experiments imply our result was not dependent on anesthetics. Other than the anesthetic, we matched experimental and physiological parameters similar. Nonetheless, based on the previous studies that reported the human brain preserve the same basic patterns observed in NHP, anatomically and functionally (10, 11), the solid networks isolated in this experiments will be used to better understand resting state functional connectivity in the brain.
Since human fMRI uses the BOLD contrast for rsfMRI, it is essential to use the BOLD contrast for investigating the source of rsfMRI. In anesthetized NHP, only 7T rsfMRI networks are reproducible and similar to awake human rsfMRI due to an increased BOLD sensitivity. Thus, with the optimized BOLD rsfMRI imaging parameters at 7T, the source of rsfMRI will be systematically investigated with the combination with conventional electrophysiology.
Acknowledgements
This work was supported by IBS-R015-D1References
1. Hutchison RM & Everling S (2012) Monkey in the middle: why non-human primates are needed to bridge the gap in resting-state investigations. Front Neuroanat 6:29.
2. Gorges M, et al. (2017) Functional Connectivity Mapping in the Animal Model: Principles and Applications of Resting-State fMRI. Front Neurol 8:200.
3. Hutchison RM, et al. (2011) Resting-state networks in the macaque at 7 T. Neuroimage 56(3):1546-1555.
4. Roelfsema PR & Treue S (2014) Basic neuroscience research with nonhuman primates: a small but indispensable component of biomedical research. Neuron 82(6):1200-1204.
5. Jenkinson M, Beckmann CF, Behrens TE, Woolrich MW, & Smith SM (2012) Fsl. Neuroimage 62(2):782-790.
6. Park BY, Seo J, & Park H (2016) Functional brain networks associated with eating behaviors in obesity. Sci Rep 6:23891.
7. Reveley C, et al. (2017) Three-Dimensional Digital Template Atlas of the Macaque Brain. Cereb Cortex 27(9):4463-4477.
8. Hutchison RM, et al. (2012) Functional connectivity of the frontal eye fields in humans and macaque monkeys investigated with resting-state fMRI. J Neurophysiol 107(9):2463-2474.
9. Iraji A, et al. (2016) The connectivity domain: Analyzing resting state fMRI data using feature-based data-driven and model-based methods. Neuroimage 134:494-507.
10. Petrides M & Pandya DN (1999) Dorsolateral prefrontal cortex: comparative cytoarchitectonic analysis in the human and the macaque brain and corticocortical connection patterns. Eur J Neurosci 11(3):1011-1036.
11. Margulies DS, et al. (2009) Precuneus shares intrinsic functional architecture in humans and monkeys. Proc Natl Acad Sci U S A 106(47):20069-20074.
Figures