3693
Examining fMRI time-series Multi-Scale Entropy as a Biomarker for Excitation/Inhibition Balance in the Brain1Department of Radiology & Imaging Sciences, Emory University, Atlanta, GA, United States, 2Yerkes National Primate Center, Emory University, Atlanta, GA, United States
Synopsis
The maintenance of a dynamic balance between excitatory and inhibitory synapses in the neocortex is critical for brain function. Many psychiatric disorders are characterized by disturbance of E/I balance. In this study we examined the potential of the fMRI time-series complexity metric multi-scale entropy (MSE) to act as a biomarker for E/I balance, using a non-human primate (NHP) model. We disturbed the E/I balance with the sub-anesthetic ketamine, which induces disinhibition of projection neurons, especially in prefrontal cortex (PFC) during fMRI of conscious NHPs. Our results confirmed that fMRI MSE is a sensitive marker for E/I balance in the brain.
INTRODUCTION
Brain function takes place through a highly inter-connected local and large scale neuronal networks in the brain which dynamically modulate their functional connectivity (FC) to respond to cognitive and behavioral demands function1. This operation is maintained through a constant barrage of excitatory and inhibitory synapses, and this excitation/inhibition (E/I) balance is critical to brain function1. Many psychiatric disorders are characterized by disturbance of E/I balance in these neuronal assemblies2,3. Recently an fMRI time-series signal complexity metric, multi-scale entropy (MSE) has been proposed as a potential biomarker of this E/I balance and neural activity4-6. In this project we examined the sensitivity of MSE to assess pharmacologically induced changes in E/I balance and neural activity through non-human primate (NHP) models in two separate experiments. In Experiment-1, we probed the effects of sub-anesthetic doses of ketamine on MSE. Sub-anesthetic ketamine acts as a selective NMDAR antagonist blocking the action of inhibitory interneurons7,8, with maximal effects observed in the prefrontal cortex (PFC)9-11 that subserves sub-anesthetic ketamine’s psychotomimetic and antidepressant effects12-14. This leads to the disinhibition of projection neurons in PFC leading to downstream (e.g. in striatum) activation of glutamergic and dopaminergic neurons15-17. In Experiment-2, we examined effects of acute cocaine administration which has been shown previous studies18 to lead to brain-wide decreases in coherent neural firing.METHODS
Studies were carried out in accordance with the NIH Guide for Care and Use of Laboratory animals and approved by the Animal Care and Use Committee at Emory University. Experiment-1: MRI data was acquired from 4 conscious unanesthetized adult female rhesus monkeys with a Tx/Rx NHP head coil in a Siemens 3T Tim Trio MRI scanner. Whole-brain 2D gradient-echo EPI: TR/TE/FA = 3sec/32ms/90°; 1.5mm X 1.5mm X 1.5mm resolution. Details of animal habituation and MRI-compatible setup have been reported elsewhere19-21. Drug infusion (DI) protocol: 8-min baseline, followed by 1 minute bolus infusion of 0.345 mg/kg of ketamine, followed by 41 minute continuous infusion of 0.256 mg/kg/hr ketamine. FMRI data analysis pipeline20-22 included distortion correction, image-registration, and spatial normalization to INIA19 NHP template atlas23. MSE (5-scales, window size = 2)4,5 was estimated on preprocessed fMRI time-series. Since the ketamine induced fMRI signal changes plateaued and remained stable across the brain after 10 minutes20,21, Ketamine vs Baseline effects were assessed with Wilcoxon Signed Rank Test (WSRT) on MSE (summed across the 5 scales) maps derived using the 16-24 min portion of the post-infusion fMRI time-series.
Experiment-2 Three conscious adult female rhesus monkeys were administered the following DI protocol in the MRI scanner: 8-min baseline, followed by intravenous infusion of 0.3 mg/kg of cocaine (and saline control in different scan sessions) and followed by 40-minutes of continued scanning. MRI acquisition and preprocessing pipeline are similar to Experiment-1. Due to the availability of the saline control, and to also examine the time-evolution of drug effects, Cocaine vs Saline WSRTs were performed on MSE maps obtained on 5 separate and consecutive 8-min time segments after Cocaine/Saline infusion.
RESULTS & DISCUSSION
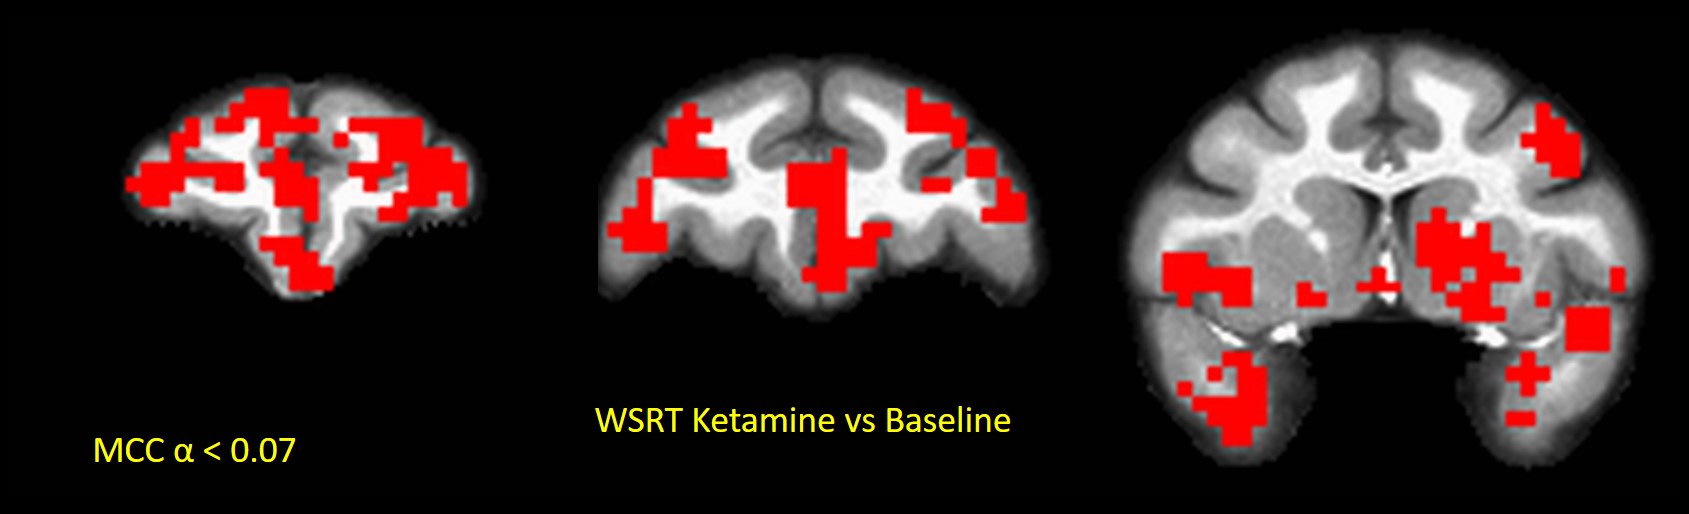
In Experiment-1, sub-anesthetic Ketamine engendered increased (multiple-comparisons corrected (MCC)24 p < 0.07) MSE compared to Baseline in PFC, striatum, anterior temporal lobe, amygdala and hippocampus in all four NHPs (Fig. 1). Region-of-interest (ROI)-averaged analyses showed strongest MSE increases (~8%; WSRT p < 0.07, max significance possible for 4 NHPs) compared to baseline in PFC consistent with alteration of E/I balance there through disinhibition of PFC. Striatum, which receives downstream dopaminergic projections from PFC exhibited weaker (~ 3%; WSRT p < 0.07) increases in MSE. This is consistent prior fMRI studies of brain FC network alterations engendered by sub-anesthetic ketamine20,22. The results show that MSE can act as biomarker for E/I balance in the brain.
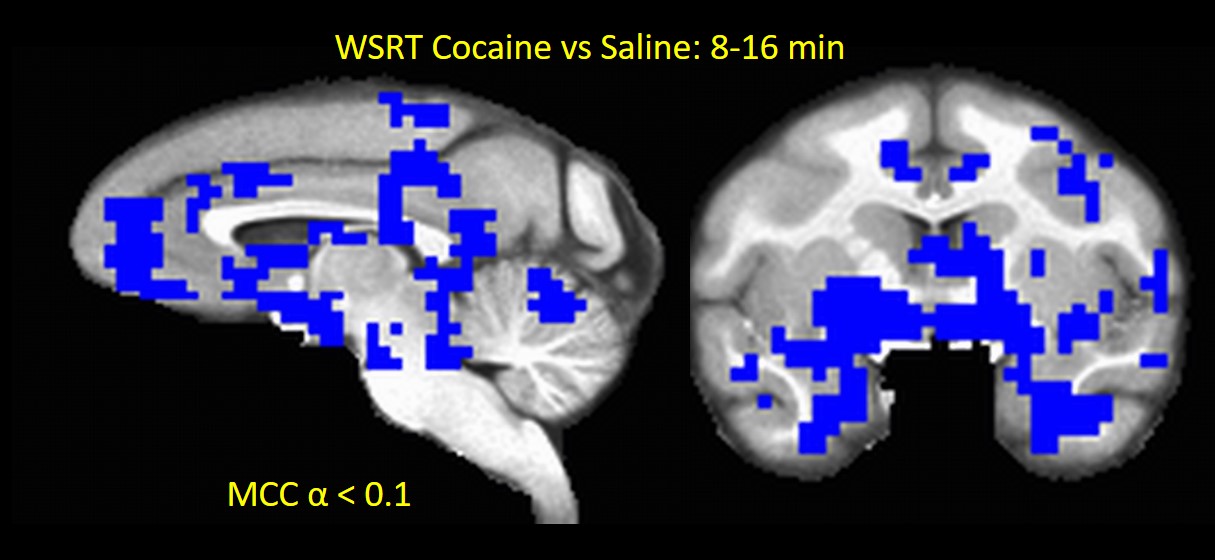
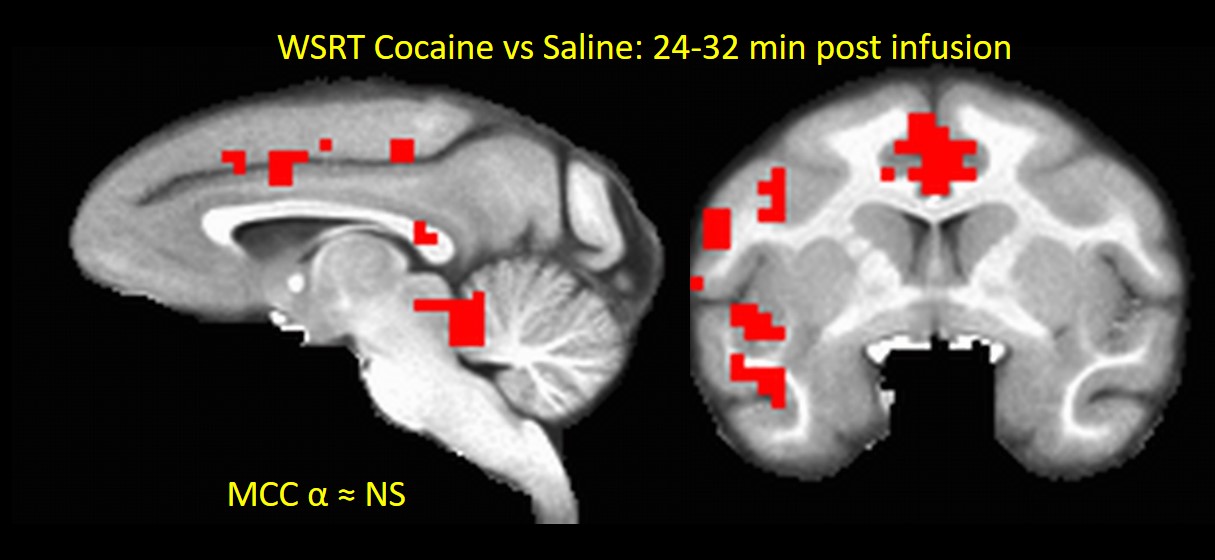
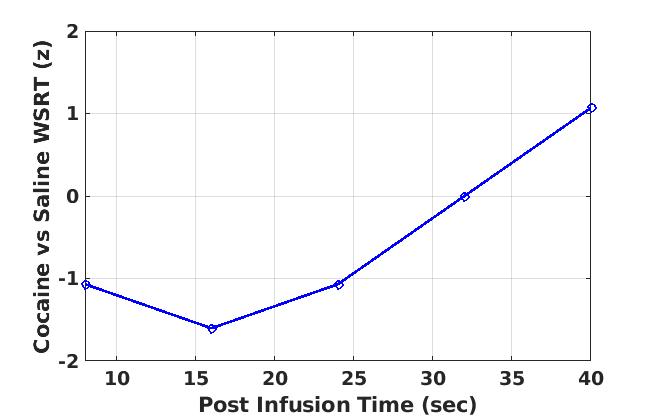
In Experment-2, acute Cocaine administration exhibited very interesting effects on brain activity. All 3 NHPs showed brain-wide decreases (MCC p < 0.1) in MSE-assessed neural activity (compared to saline control) in the first 16 minutes post-infusion (Fig. 2) consistent with the results of previous FC studies18. The cocaine effects seemed to vanish about 32 min after infusion (Fig. 3) and subsequently showed an increase in brain activity compared to saline after 40 minutes (Fig. 4), which may reflect a post-cocaine recovery. Thus MSE also acts as a sensitive marker for effects of drugs on brain activity.
CONCLUSION
The results of the two experiments indicate that MSE of fMRI time-series can be used a biomarker for E/I balance and neural activity in the brain, and thus can play a major role in diagnosis of psychiatric disorders. In future, we will increase our sample size, and examine more sophisticated models of altering the E/I balance.Acknowledgements
No acknowledgement found.References
1. Haider B, McCormick DA. Rapid neocortical dynamics: cellular and network mechanisms. Neuron 2009;62:171-89.
2. Yizhar O, Fenno LE, Prigge M, et al. Neocortical excitation/inhibition balance in information processing and social dysfunction. Nature 2011;477:171-8.
3. Marin O. Interneuron dysfunction in psychiatric disorders. Nat Rev Neurosci 2012;13:107-20. 4. Wang DJJ, Jann K, Fan C, et al. Neurophysiological Basis of Multi-Scale Entropy of Brain Complexity and Its Relationship With Functional Connectivity. Front Neurosci 2018;12:352.
5. Smith RX, Yan L, Wang DJ. Multiple time scale complexity analysis of resting state FMRI. Brain Imaging Behav 2014;8:284-91.
6. McDonough IM, Nashiro K. Network complexity as a measure of information processing across resting-state networks: evidence from the Human Connectome Project. Front Hum Neurosci 2014;8:409. 7. Wang HX, Gao WJ. Cell type-specific development of NMDA receptors in the interneurons of rat prefrontal cortex. Neuropsychopharmacology 2009;34:2028-40.
8. Wang HX, Gao WJ. Prolonged exposure to NMDAR antagonist induces cell-type specific changes of glutamatergic receptors in rat prefrontal cortex. Neuropharmacology 2012;62:1808-22.
9. Lorrain DS, Baccei CS, Bristow LJ, Anderson JJ, Varney MA. Effects of ketamine and N-methyl-D-aspartate on glutamate and dopamine release in the rat prefrontal cortex: modulation by a group II selective metabotropic glutamate receptor agonist LY379268. Neuroscience 2003;117:697-706.
10. Moghaddam B, Adams B, Verma A, Daly D. Activation of glutamatergic neurotransmission by ketamine: a novel step in the pathway from NMDA receptor blockade to dopaminergic and cognitive disruptions associated with the prefrontal cortex. J Neurosci 1997;17:2921-7.
11. Vollenweider FX, Vontobel P, Oye I, Hell D, Leenders KL. Effects of (S)-ketamine on striatal dopamine: a [11C]raclopride PET study of a model psychosis in humans. J Psychiatr Res 2000;34:35-43. 12. Arnsten AF, Wang MJ, Paspalas CD. Neuromodulation of thought: flexibilities and vulnerabilities in prefrontal cortical network synapses. Neuron 2012;76:223-39.
13. Opler LA, Opler MG, Arnsten AF. Ameliorating treatment-refractory depression with intranasal ketamine: potential NMDA receptor actions in the pain circuitry representing mental anguish. CNS Spectr 2016;21:12-22.
14. Del Arco A, Mora F. Neurotransmitters and prefrontal cortex-limbic system interactions: implications for plasticity and psychiatric disorders. J Neural Transm (Vienna) 2009;116:941-52.
15. Del Arco A, Segovia G, Mora F. Blockade of NMDA receptors in the prefrontal cortex increases dopamine and acetylcholine release in the nucleus accumbens and motor activity. Psychopharmacology (Berl) 2008;201:325-38.
16. Takahata R, Moghaddam B. Activation of glutamate neurotransmission in the prefrontal cortex sustains the motoric and dopaminergic effects of phencyclidine. Neuropsychopharmacology 2003;28:1117-24.
17. Carr DB, Sesack SR. Dopamine terminals synapse on callosal projection neurons in the rat prefrontal cortex. J Comp Neurol 2000;425:275-83.
18. Murnane KS, Gopinath KS, Maltbie E, Daunais JB, Telesford QK, Howell LL. Functional connectivity in frontal-striatal brain networks and cocaine self-administration in female rhesus monkeys. Psychopharmacology (Berl) 2015;232:745-54.
19. Murnane KS, Howell LL. Development of an apparatus and methodology for conducting functional magnetic resonance imaging (fMRI) with pharmacological stimuli in conscious rhesus monkeys. J Neurosci Methods 2010;191:11-20.
20. Gopinath K, Maltbie E, Urushino N, Kempf D, Howell L. Ketamine-induced changes in connectivity of functional brain networks in awake female nonhuman primates: a translational functional imaging model. Psychopharmacology (Berl) 2016;233:3673-84.
21. Maltbie E, Gopinath K, Urushino N, Kempf D, Howell L. Ketamine-induced brain activation in awake female nonhuman primates: a translational functional imaging model. Psychopharmacology (Berl) 2016;233:961-72.
22. Maltbie EA, Kaundinya GS, Howell LL. Ketamine and pharmacological imaging: use of functional magnetic resonance imaging to evaluate mechanisms of action. Behav Pharmacol 2017;28:610-22.
23. Rohlfing T, Kroenke CD, Sullivan EV, et al. The INIA19 Template and NeuroMaps Atlas for Primate Brain Image Parcellation and Spatial Normalization. Front Neuroinform 2012;6:27.
24. Gopinath K, Krishnamurthy V, Sathian K. Accounting for Non-Gaussian Sources of Spatial Correlation in Parametric Functional Magnetic Resonance Imaging Paradigms I: Revisiting Cluster-Based Inferences. Brain Connect 2018;8:1-9.
Figures