3691
Are fMRI measurements in medetomidine-anesthetized rats temporally stable?Nikoloz Sirmpilatze1,2, Jürgen Baudewig1, and Susann Boretius1,2
1Functional Imaging Laboratory, German Primate Center, Göttingen, Germany, 2Georg-August University of Göttingen, Göttingen, Germany
Synopsis
Medetomidine is often used to anesthetize rats during BOLD fMRI, yet the exact protocols for its administration differ across studies, compromising comparability and raising questions regarding the stability of fMRI measurements over several hours of anesthesia. We performed multiple repeated measurements of somatosensory and resting-state fMRI in medetomidine-anesthetized rats for up to six hours. Four different protocols of medetomidine administration were tested for their capacity to sustain stable measures of stimulus-evoked response and functional connectivity. The reported results are expected to help researchers in choosing the administration regime best suited for their needs.
Introduction
Functional Magnetic Resonance Imaging (fMRI) in rats is often performed under anesthesia to prevent motion and minimize stress. The agent of choice is medetomidine, an α2-adrenergic agonist that achieves long-lasting sedation while maintaining sufficient neurovascular coupling. In most studies anesthesia is induced with isoflurane and then switched to a continuous infusion of medetomidine, sometimes preceded by its bolus injection1–4. The exact timing, dose, and route of administration vary across studies, impairing their comparability. We examined whether fMRI measures of neural activity, namely stimulus-evoked responses and resting-state functional connectivity (FC), remain stable over several hours of medetomidine anesthesia. Four different protocols of medetomidine administration were used, to determine the dosing practices that lead to more temporally stable fMRI measures.Methods
We split 24 female adult Wistar rats into four equal groups, each receiving a different protocol of medetomidine: 1) subcutaneous (SC) with bolus; 2) intravenous (IV) with bolus; 3) IV no bolus; 4) IV lower dose (for the detailed protocols, see Fig. 1). Each rat was anesthetized for up to six hours on two separate sessions - first on the laboratory bench and then inside a 9.4 Tesla MR system (Bruker Biospin). During the latter session, we repeatedly acquired multiple 5.5-minute-long gradient-echo EPI sequences starting every 10 minutes (TR 1500ms, TE 15ms, flip angle 90°, in-plane resolution 0.2mm, slice thickness 0.5mm, 30 coronal slices). We alternated between somatosensory fMRI (three blocks of 30s electrical forepaw stimulation, 9Hz, 3mA, 0.2ms pulse width) and resting-state fMRI. For somatosensory fMRI scans, the peak % signal change (peak ΔBOLD) of the contralateral primary somatosensory cortex served as a measure of stimulus-evoked response strength (Fig 2). For resting-state scans, we extracted the time courses from 14 regions of interest, quantified their pair-wise Pearson’s correlations, transformed those into Fisher’s z scores, and averaged across all region pairs to get a measure of global FC (Fig 3). For each medetomidine protocol we designed a linear mixed effects model with the fMRI measures (peak ΔBOLD or global FC) as response variables, time as a fixed effect and the individual rat intercepts as random effects. The effect of time on each of the response variables was tested with a Likelihood Ratio Test, considering p<0.05 as significant time-dependency.Results
Most anesthesia sessions (35/48) lasted longer than 5 hours, with the remainder of sessions ending with spontaneous earlier wake-ups. Electrical forepaw stimulation consistently led to the activation of the contralateral somatosensory areas, across time and regardless of the medetomidine protocol. The temporal evolution of fMRI measures is shown in Fig. 4, separately for each protocol. Both peak ΔBOLD and global FC remained temporally stable with protocol 2 (p=0.36 and p=0.24 respectively). Global FC was also stable with protocol 1 (p=0.65), while peak ΔBOLD exhibited weak time-dependency (p=0.018, slope=-0.18% per hour), mainly driven by a few outliers near the start of anesthesia. Skipping the bolus dose (protocol 3) resulted in stronger fMRI responses at the beginning, but both peak ΔBOLD and global FC followed a decreasing trend over time (p<0.001 for both). Likewise, lowering the dose by 30% (protocol 4) also resulted in a time-dependent reduction of peak ΔBOLD and global FC (p<0.001 and p=0.04 respectively).Discussion
We found that conventional medetomidine protocols (0.05 mg/kg bolus and 0.1 mg/kg/h infusion) lead to consistent and reproducible fMRI measurements from 1 to 6 hours after the bolus administration: both stimulus-evoked responses and functional connectivity remained stable within the above time-window. The SC route (protocol 1) resulted in higher variance compared to IV (protocol 2), but is still suitable for long-lasting experiments, especially considering the easier application. Deviating from the above protocols, either by skipping the bolus or by decreasing the overall dose, results in fMRI measures that are initially strong but weaken over time. This effect, considered together with the slow pharmacokinetics of medetomidine5, implies that the drug may dose-dependently suppress stimulus-evoked BOLD responses and functional connectivity. We hope that this work will help researchers make better decisions regarding the anesthetic protocol that best suits their needs.Acknowledgements
We wish to thank Kristin Kötz and Luzia Hintz for technical assistance. This project was partly funded through the DFG Research Center for Nanoscale Molecular Physiology of the Brain (CNMPB). Nikoloz Sirmpilatze was a recipient of a scholarship by the German Academic Exchange Services (DAAD) for part of the project duration .References
- Weber R, Ramos-Cabrer P, Wiedermann D, Van Camp N, Hoehn M. A fully noninvasive and robust experimental protocol for longitudinal fMRI studies in the rat. Neuroimage. 2006;29(4):1303-1310.
- Pawela CP, Biswal BB, Hudetz AG, et al. A protocol for use of medetomidine anesthesia in rats for extended studies using task-induced BOLD contrast and resting-state functional connectivity. Neuroimage. 2009;46(4):1137-1147.
- Zhao F, Zhao T, Zhou L, Wu Q, Hu X. BOLD study of stimulation-induced neural activity and resting-state connectivity in medetomidine-sedated rat. Neuroimage. 2008;39(1):248-260.
- Nasrallah FA, Lew SK, Low AS-M, Chuang K-H. Neural correlate of resting-state functional connectivity under α2 adrenergic receptor agonist, medetomidine. Neuroimage. 2014;84:27-34.
- Bol CJJG, Danhof M, Stanski DR, Mandema JW. Pharmacokinetic-Pharmacodynamic Characterization of the Cardiovascular, Hypnotic, EEG and Ventilatory Responses to Dexmedetomidine in the Rat. J Pharmacol Exp Ther. 1997;283(3):1051-1058.
Figures
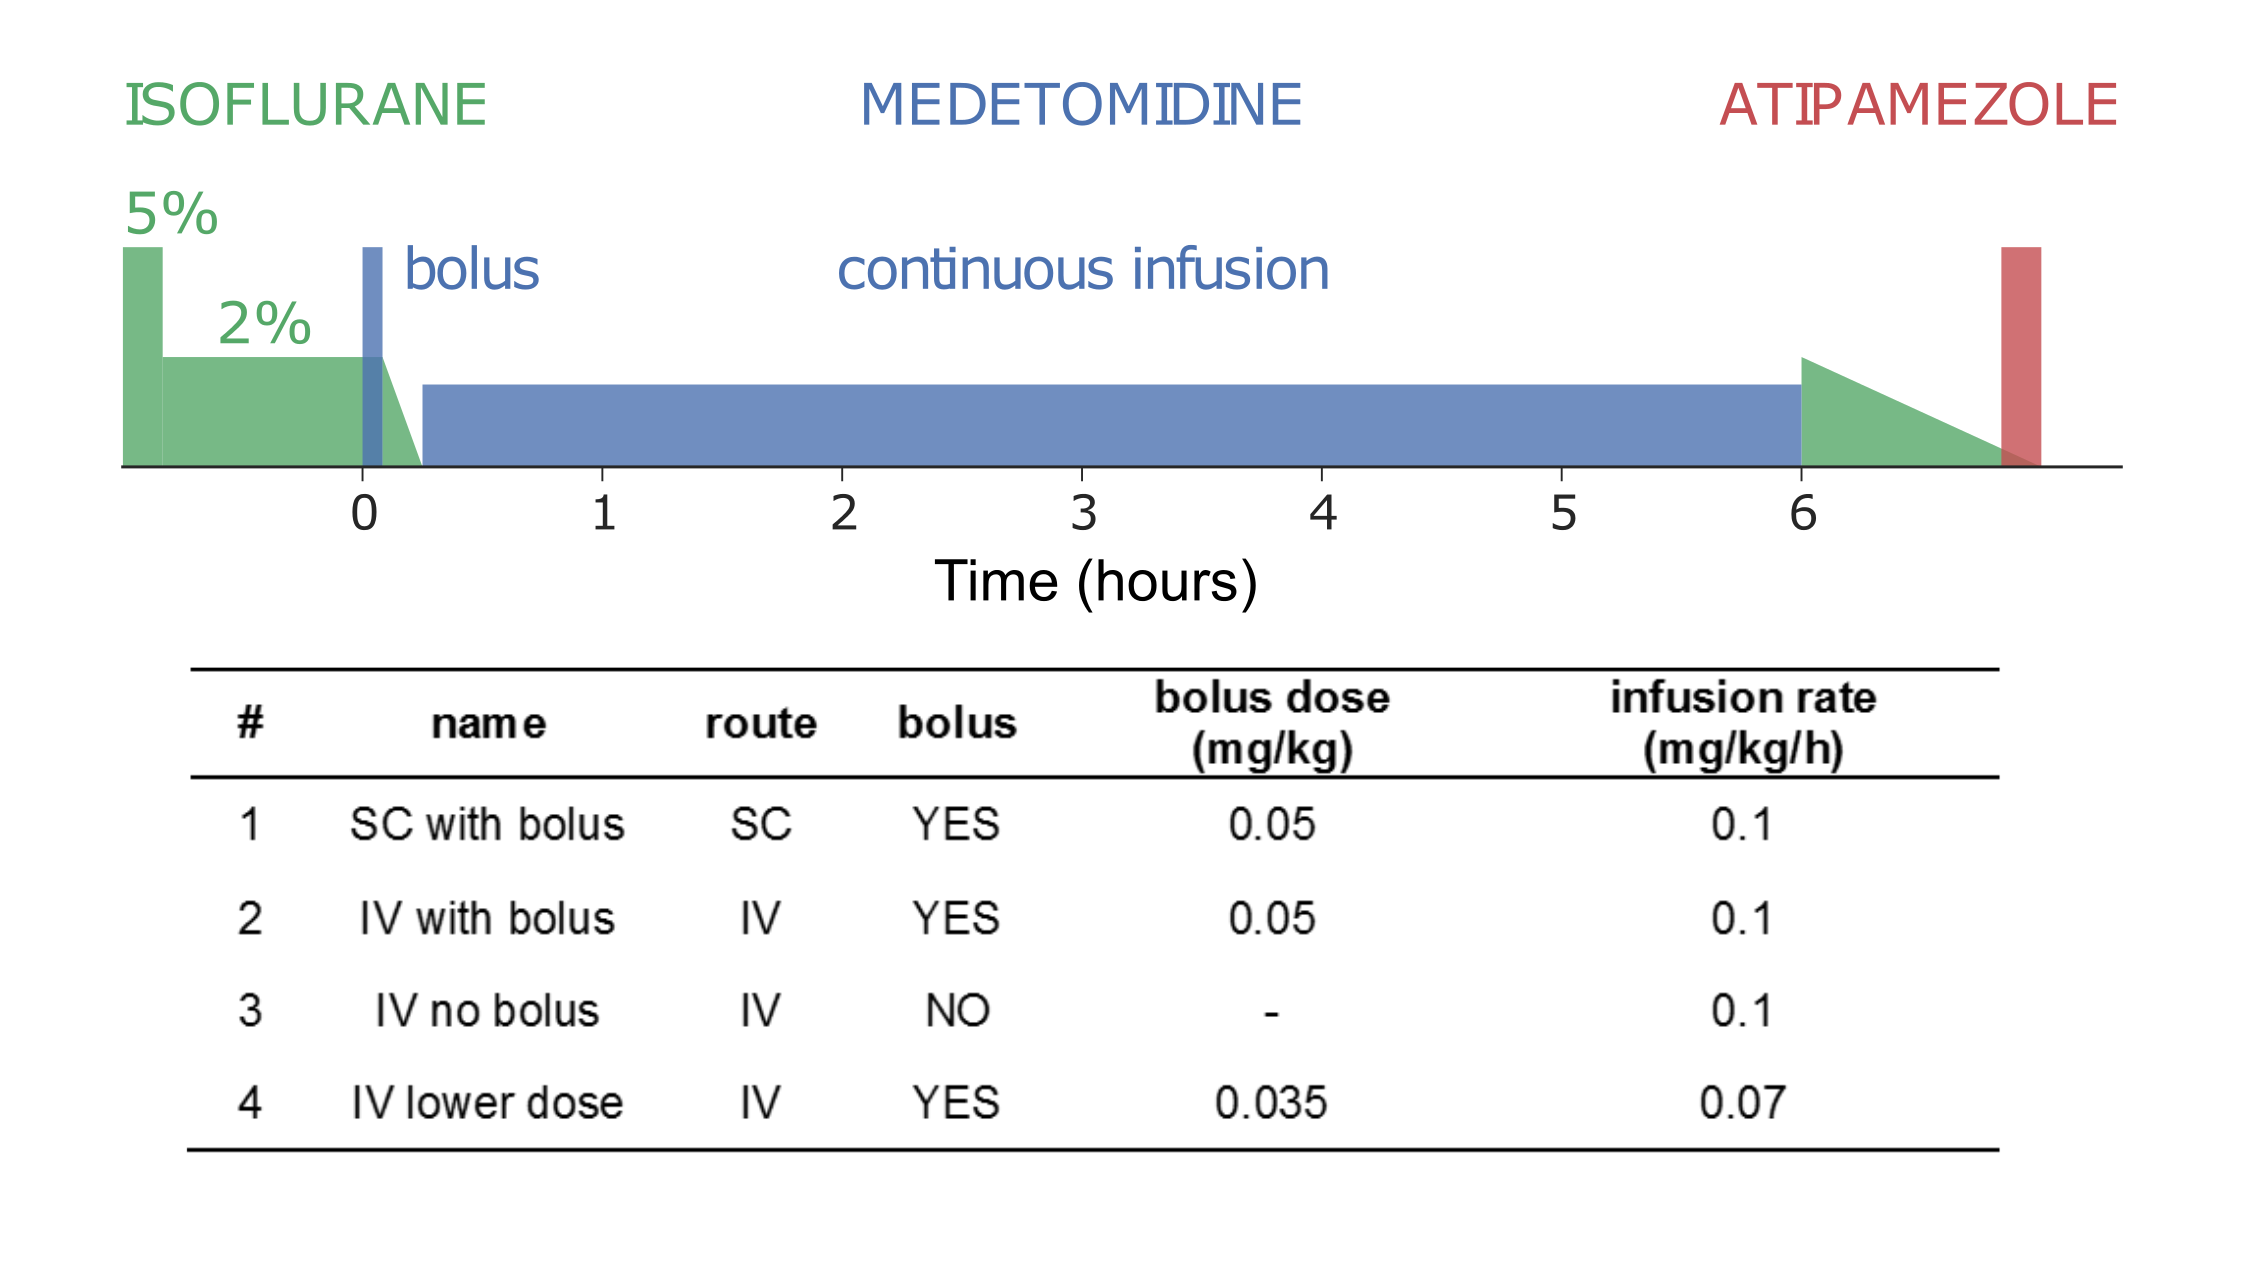
General outline of the
applied anesthetic protocols. Isoflurane is used to induce unconsciousness,
while atipamezole is given at the end to antagonize the effects of medetomidine
and facilitate recovery. The exact medetomidine doses for the four protocols used
in this study are given on the table.
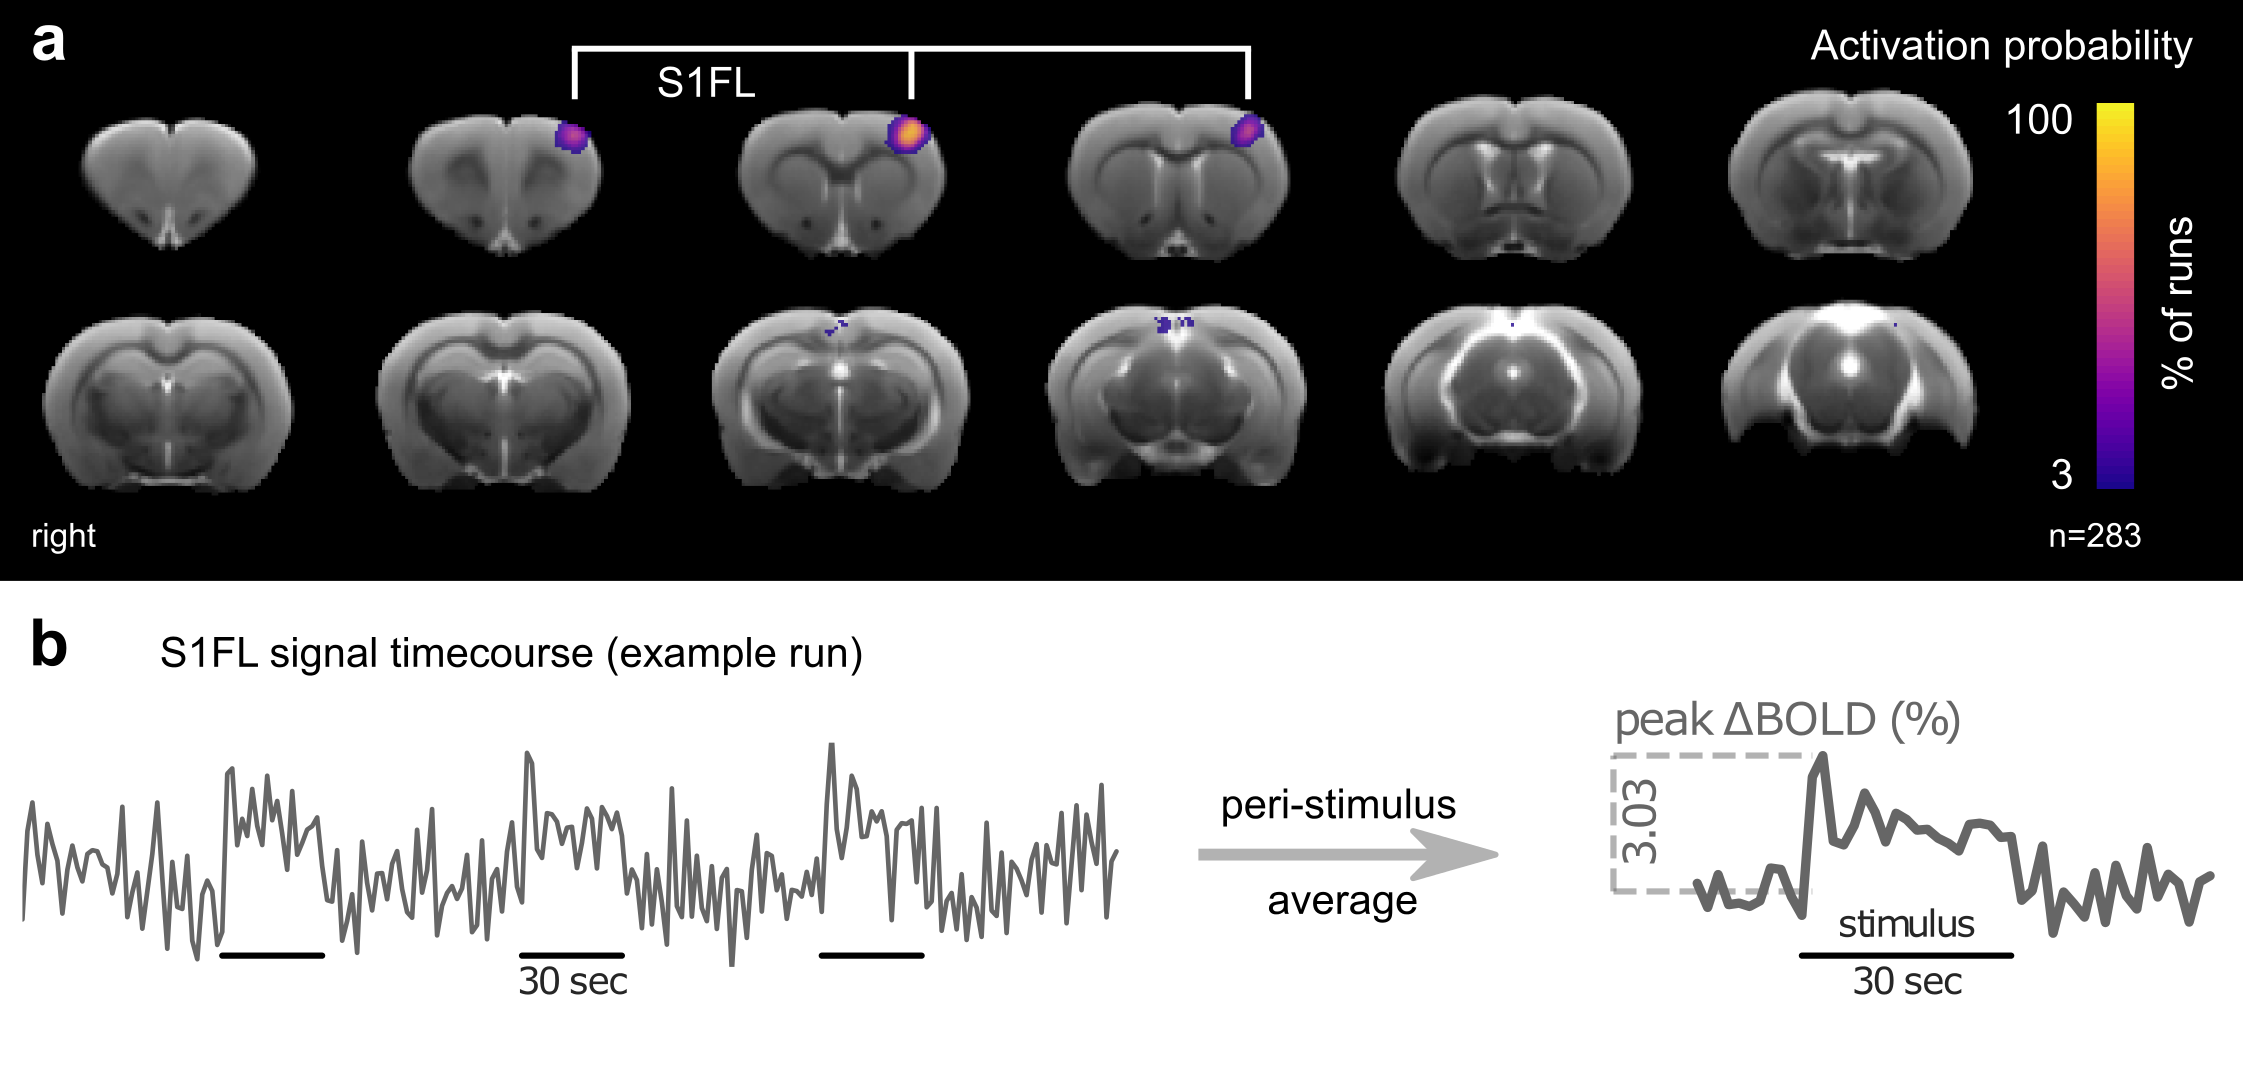
a. An activation
probability map created using 283 somatosensory fMRI runs. Each voxel’s value
represents the percentage of runs in which the voxel was significantly
responsive to electrical stimulation of the right forepaw. The most consistently
active area corresponds to the forelimb region of the left primary
somatosensory cortex (S1FL). b. An example BOLD signal timecourse extracted
from the S1FL. The peri-stimulus average is used to calculate the peak % signal
change (peak ΔBOLD).
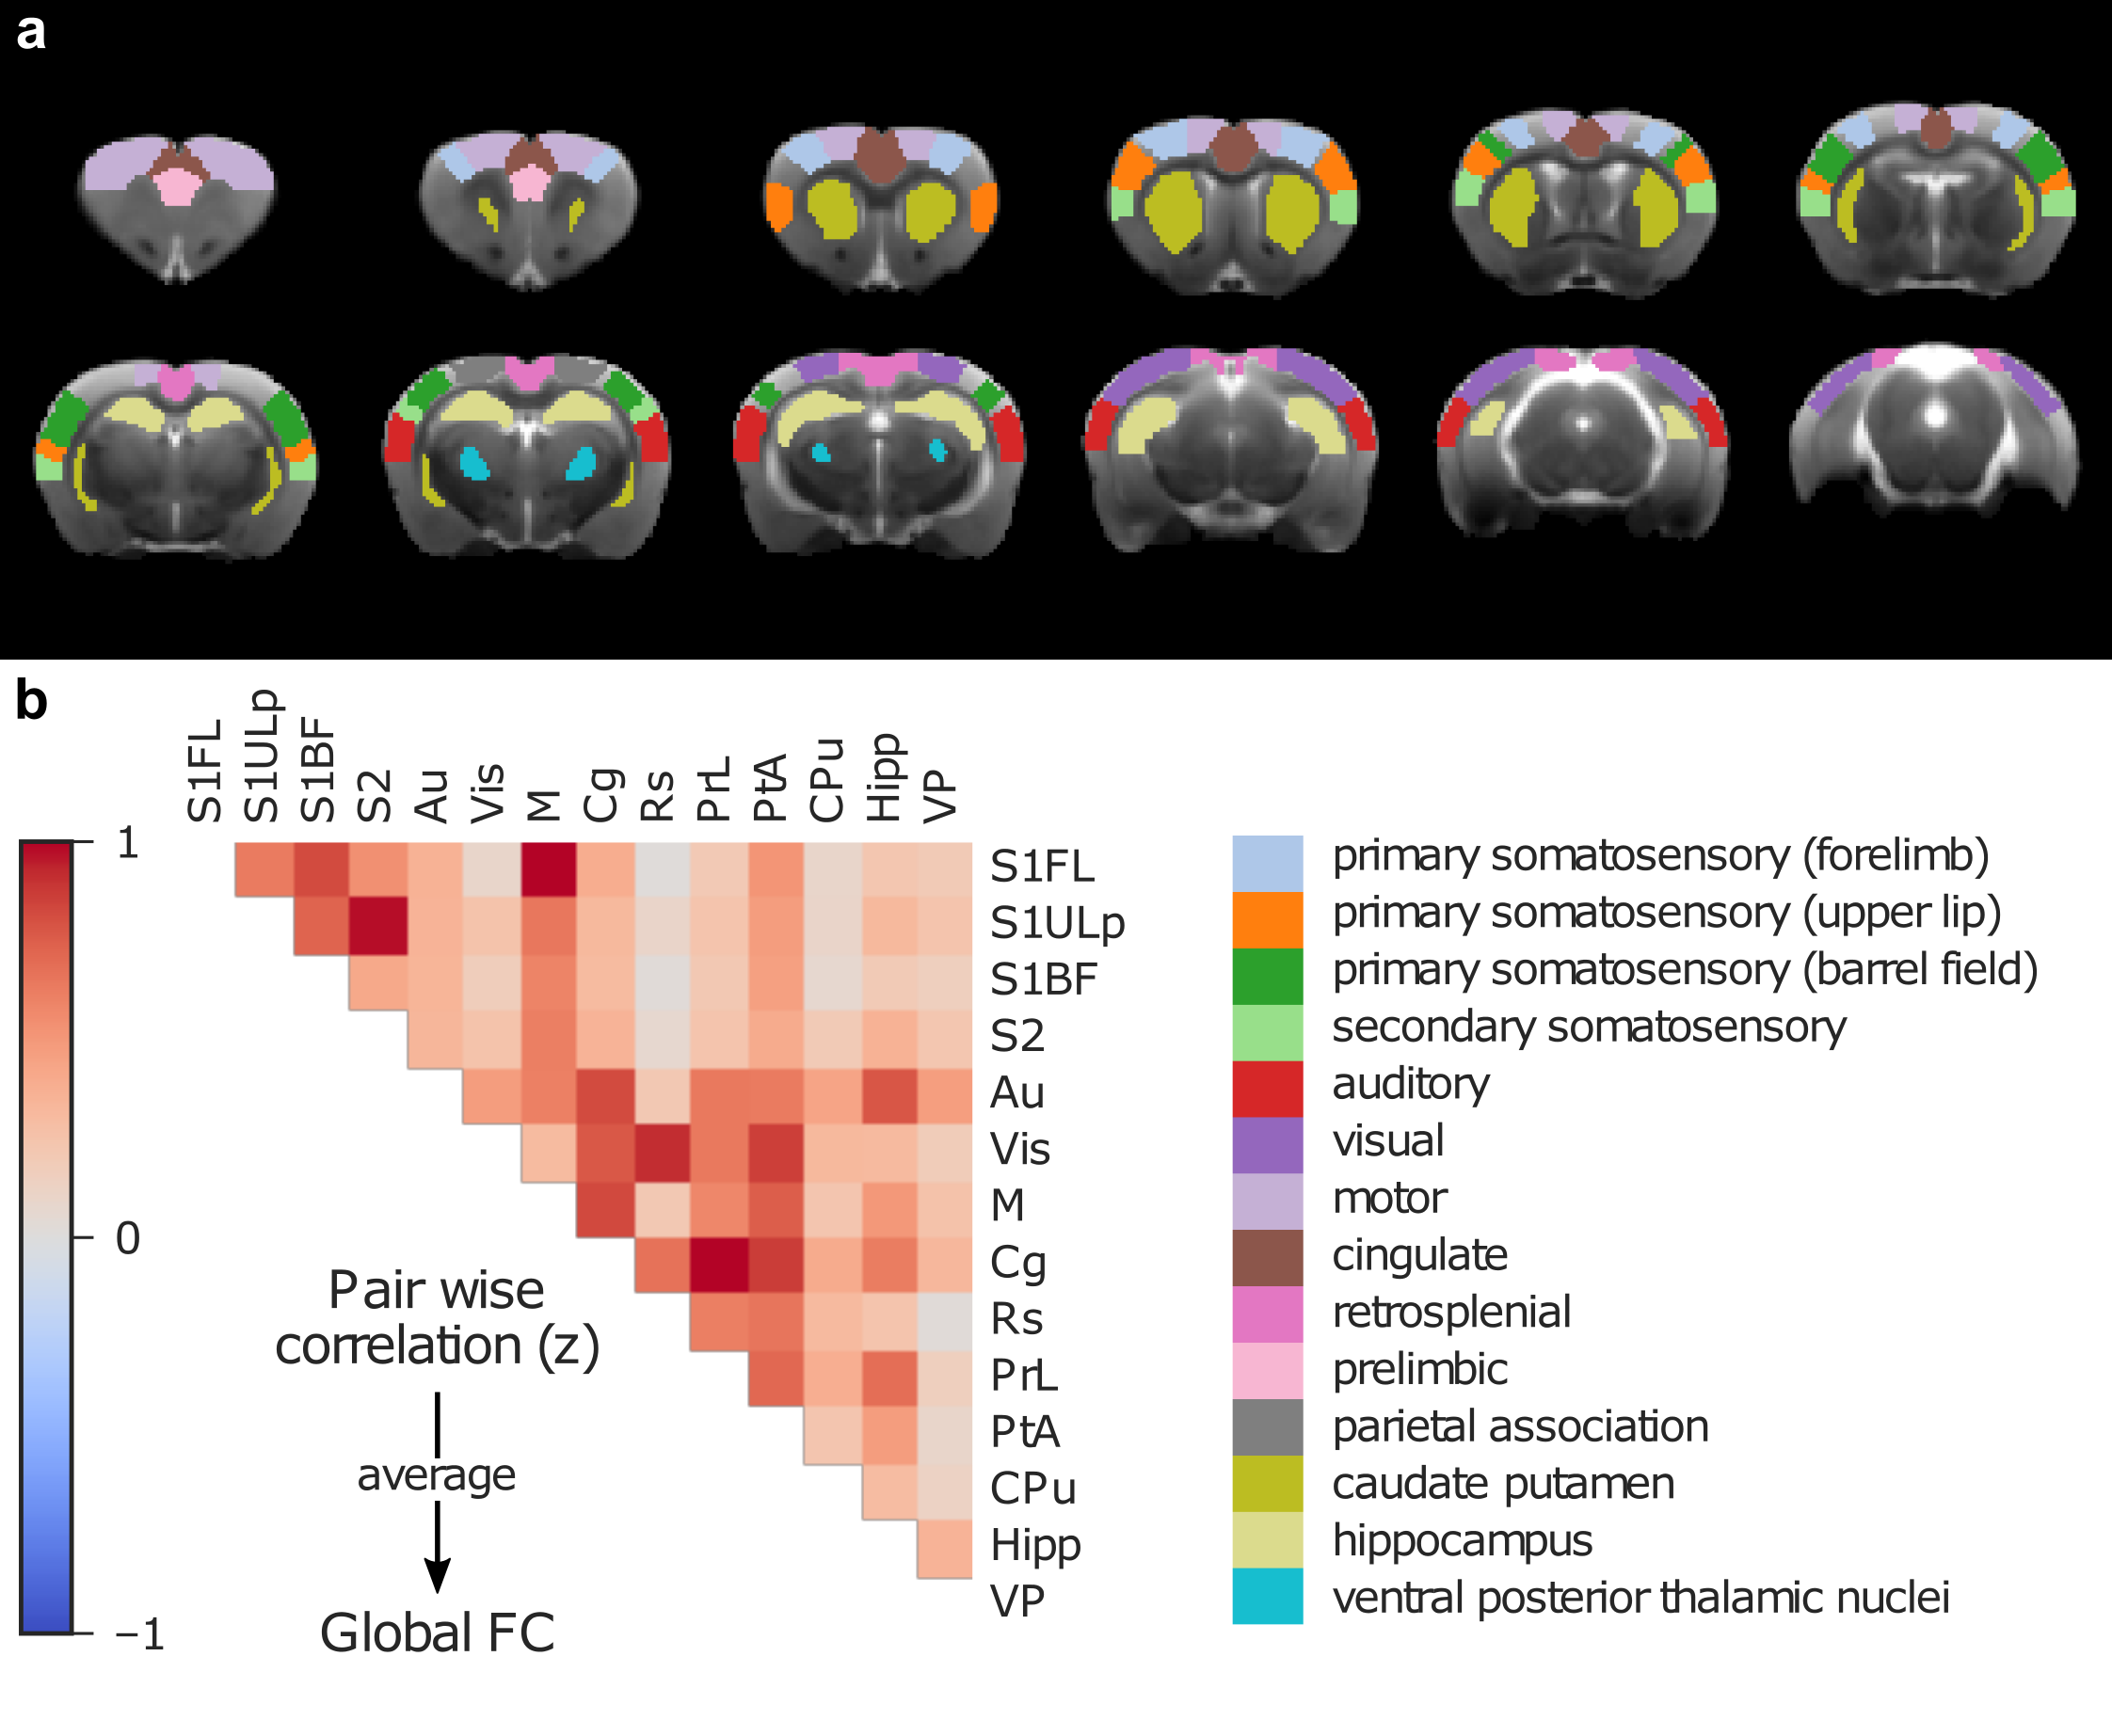
Functional connectivity (FC)
analysis. a. 14 regions-of-interest (names given on the lower right) were
hand-drawn on a common anatomical template, based on the Paxinos-Watson rat
atlas. b. A pair-wise correlation matrix (Fisher’s z-transformed Pearson’s
correlation) is shown from an example resting-state fMRI run. For each run, a
measure of global FC was obtained by averaging the correlation values from all
unique region-of-interest pairs.
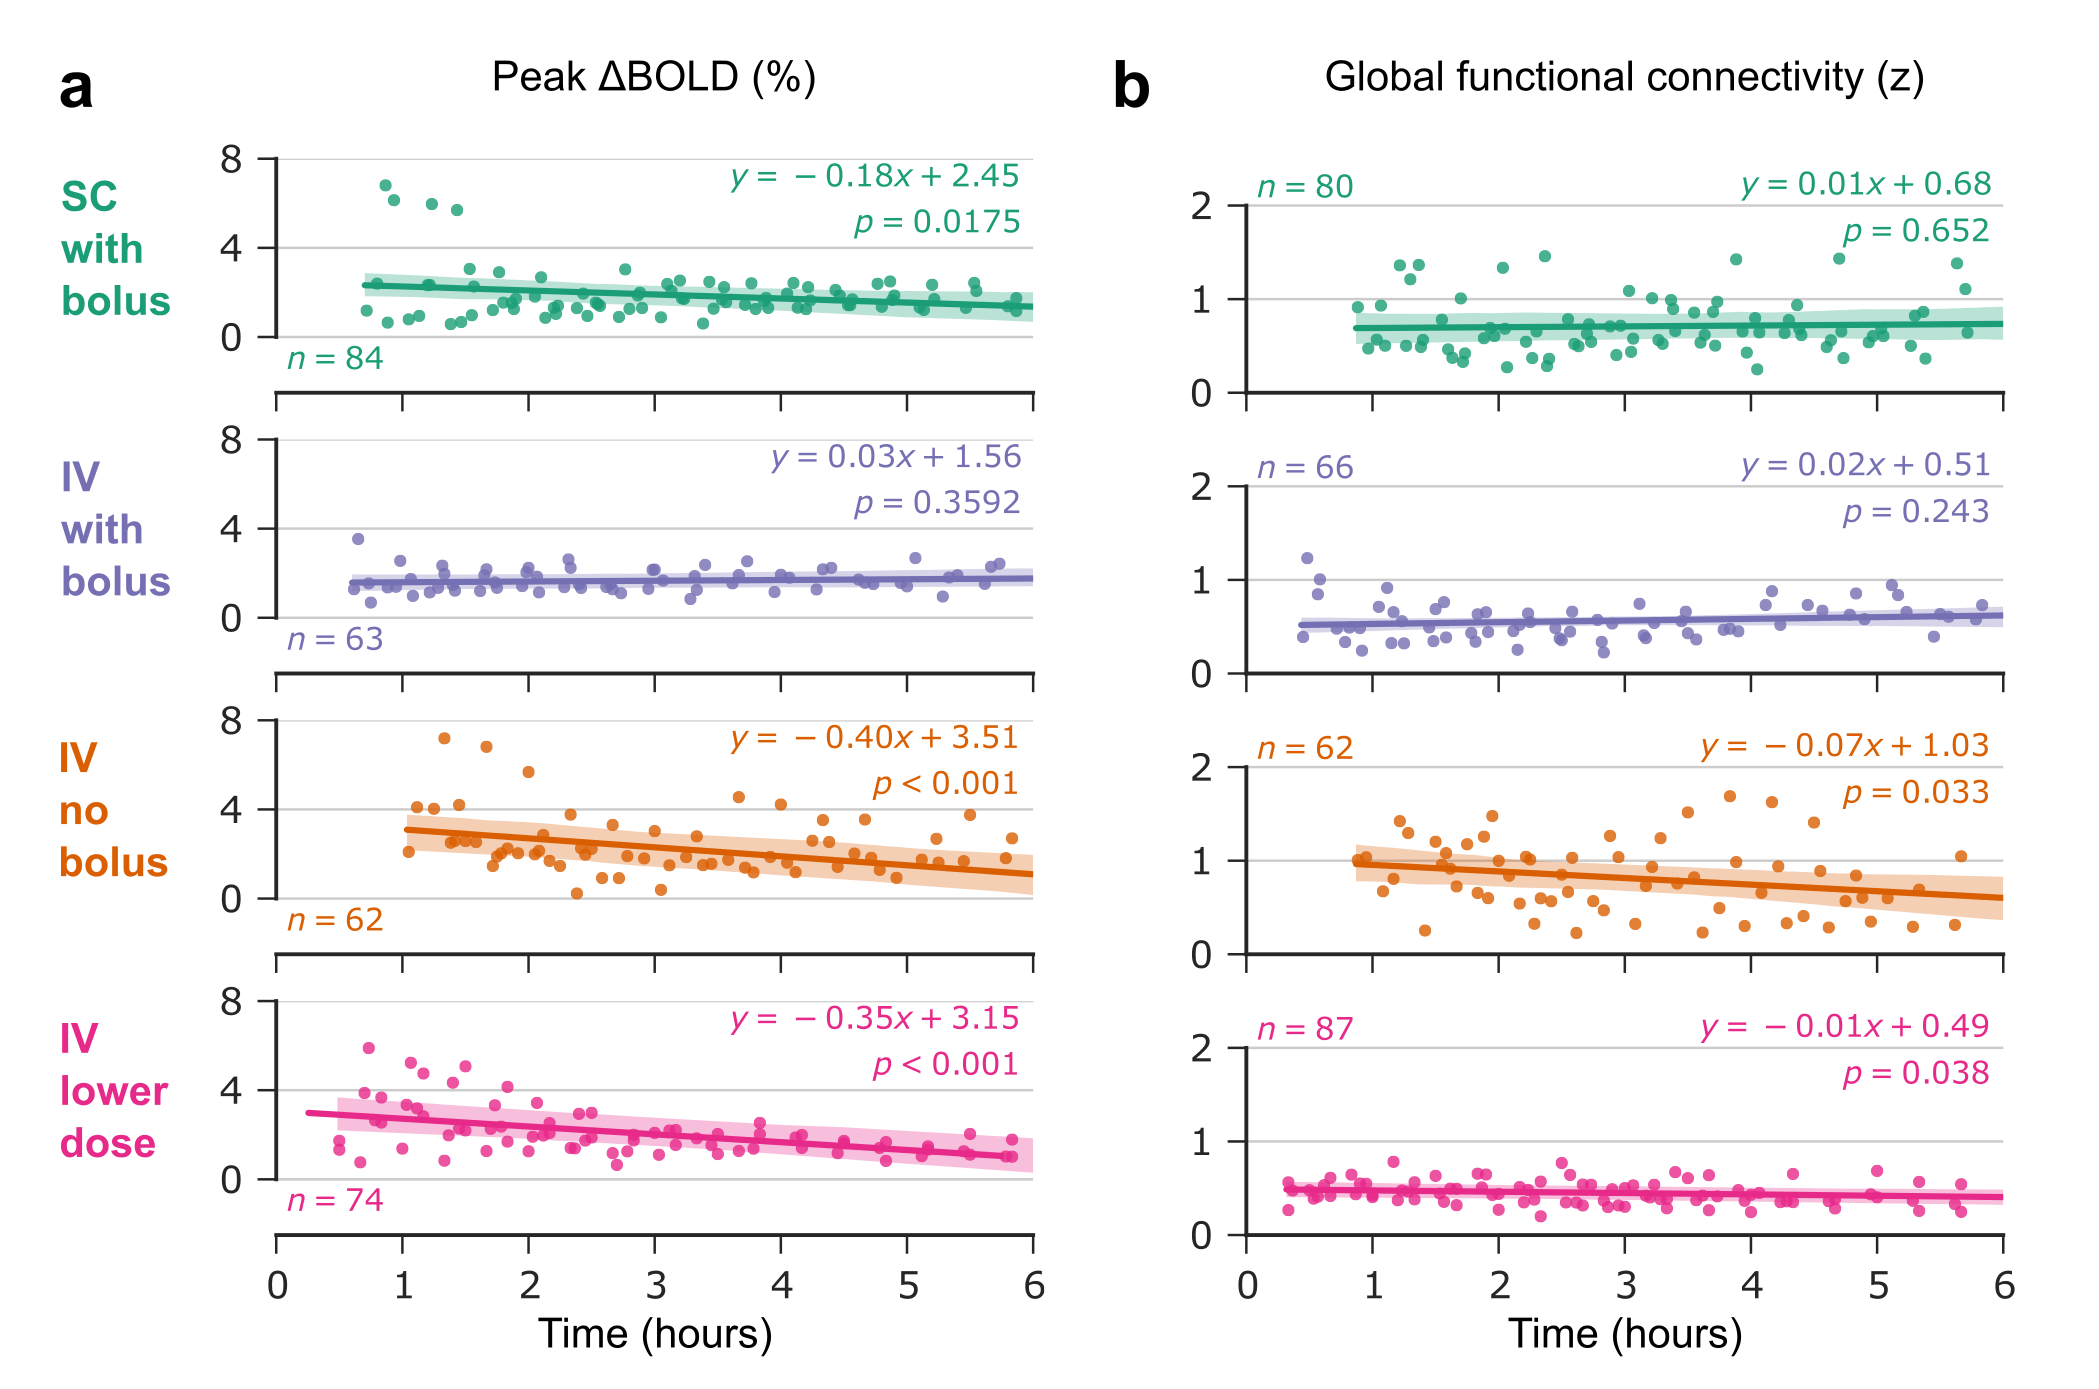
For each of the four
anesthetic protocols, the peak ΔBOLD (a) and the global functional connectivity
(b) values are plotted across time: dots represent single-run values; solid
lines correspond to the linear mixed effects model fit; shaded bands indicate
the 95% confidence intervals of the fit.