3685
Odor stimulation by automated syringe pumps in combination with the independent component analysis for BOLD-fMRI study of mouse whole brainFuyu Hayashi1, Mitsuhiro Takeda1, Naoya Yuzuriha1, Sosuke Yoshinaga1, and Hiroaki Terasawa1
1Faculty of Life Sciences, Kumamoto University, Kumamoto, Japan
Synopsis
Olfactory perception in mice involves the activation of brain regions. We previously developed a method that uses repetitive odor stimulation and independent component analysis (ICA) for BOLD-fMRI studies. Using BOLD-ICA, we sought to detect odor-evoked responses in the mouse whole brain. Previously, the administration of an odorant substance had been performed by manually operating a syringe pump to infuse the saturated vapor of an odorant substance. We constructed a system that automatically controls the syringe pump, to ensure the accuracy of stimulation timing and duration. We demonstrate the improved detectability in the BOLD-ICA method by the automated system.
Introduction
Olfaction is an important perception involving brain regions. Mice have a well-developed olfactory system. In mice, an odorant substance binds to olfactory receptors on the olfactory epithelium. The signal is transduced to the olfactory bulb, and then to higher-order brain regions, leading to specific behaviors, emotions, and physiological changes (Fig. 1). The odor-evoked neural pathways vary, depending on the type of odorant substance, which determines the resulting behavior of the mouse.1 To identify the activation pathways, the olfactory bulb of mice stimulated with odorant substances has been investigated by the BOLD-fMRI method.2 However, fMRI studies to detect odor-evoked responses over higher-order brain regions remain rare.3 The mouse brain is small, and thus the BOLD analysis is more likely to suffer from peripheral hemodynamic changes.4 We previously introduced independent component analysis (ICA) to the BOLD-fMRI method.5 In the BOLD-ICA method, stimulations are applied at constant intervals, and responses are detected by the ICA method.5 This method was applied to analyze olfactory responses in mice.5,6 In our odor stimulation experiment for mice, a syringe pump is used to infuse small amounts of odorant substances. However, the syringe pump was manually operated, thus raising concerns about the accuracy of the timing and duration of the odor administration. In this study, we implemented an automated odor stimulation system that controls the syringe pump without manual operation.Materials and Methods
We have been using a syringe pump to infuse odorant substances. A drop of the odorant substance solution was placed into the syringe. The solution odorant substance became vaporized to form a saturated vapor in the syringe. The saturated vapor was infused into the air line by operating the syringe pump. In this study, an automatic odor stimulation machine (in collaboration with ARCO SYSTEM, Inc.) was constructed. The operating software controls the syringe pumps and the electromagnetic valve at scheduled times (Fig. 2). Muscone, a major musk compound, was used as an odorant substance. MRI experiments were performed with a 7.0 Tesla Bruker BioSpec 70/20 scanner and a mouse brain 2-channel phased array surface cryogenic coil (Bruker BioSpin). Mice (male C57BL/6, 8–10 weeks old) were anesthetized with medetomidine (i.p. 0.3 mg/kg initial; 0.1 mg/kg/hr supplemental). GRE-EPI images were acquired: TR/TE = 2000/21.4 ms; FOV = 1.92×1.44 cm2; matrix = 96×72; resolution = 200×200 µm2; slice thickness = 400 µm; number of slices = 20; NEX = 1; flip angle = 70°. At 1 min intervals, muscone vapor was applied for 5 sec, by either manually or automatically operating the syringe pump, and this task was repeated 24 times. The scanned data were analyzed by the ICA method, using the FSL program. The data obtained from 3 mice in the automated operation were combined and analyzed by group ICA with the FSL program. The MR signal transition components with the frequency of 16.6 mHz were selected. The peak intensity profiles were created by summing the intensity profiles of the 24 tasks over 3 mice.Results
Upon stimulation with muscone using the automated system, the brain responses were detected in the piriform cortex (Fig. 3A) and amygdala (Fig. 3D). A significant intensity increase was detected over the time courses of the signals in the two regions (Fig. 3B, E). In contrast, with manual operation, no significant increase was detected in the corresponding brain regions (Fig. 3C, F). Next, we performed a group analysis by combining the data obtained from three mice in automated operations. With the accumulated data, noise-less activation maps were obtained and the signal-to-noise was improved in the time course of the signal (Fig. 4A, C). In both the piriform cortex and amygdala, the increase of the signal occurred 13 sec after the odor stimulation (Fig. 4B, D).Discussion
Muscone-evoked responses were detected in the piriform cortex and amygdala, consistent with a previous report based on an immunohistochemical assay.7 While the activation in these regions was detected in our previous study by manual operation, the detection required combined data from multiple mice.6 By virtue of the automated system, the activation could be detected using data from a single mouse. The increased accuracy of the timing of odor administration allowed the evaluation of the time lag between the stimulation and the occurrence of the BOLD signal, which may be associated with the identification of odorant substances by mice.Conclusion
The implementation of the automatic odor stimulation system significantly improved the detectability of the BOLD-ICA method.Acknowledgements
No acknowledgement found.References
1. Touhara K, Vosshall LB, Sensing odorants and pheromones with chemosensory receptors. Annu Rev Physiol. 2009;71:307–332. 2. Xu, F. et al., Odor maps of aldehydes and esters revealed by functional MRI in the glomerular layer of the mouse olfactory bulb. Proc Natl Acad Sci USA. 2003;100:11029–11034. 3. Pain, F. et al., Visualizing odor representation in the brain: a review of imaging techniques for the mapping of sensory activity in the olfactory glomeruli. Cell. Mol. Life Sci. 2011; 68: 2689–2709. 4, Ielacqua, G.D. et al., Proc Intl Soc Mag Reson Med. 2015;23:2037. 5. Funatsu et al. A BOLD analysis of the olfactory perception system in the mouse whole brain, using independent component analysis. Proc Intl Soc Mag Reson Med. 2017;25:5363. 6. Hayashi F, et al. BOLD-fMRI comparison of olfactory responses in the mouse whole brain, with different odors and anesthesia. Proc Intl Soc Mag Reson Med. 2018;26:2309. 7. Shirasu M, et al., Olfactory receptor and neural pathway responsible for highly selective sensing of musk odors. Neuron. 2-14;81:165-178.Figures
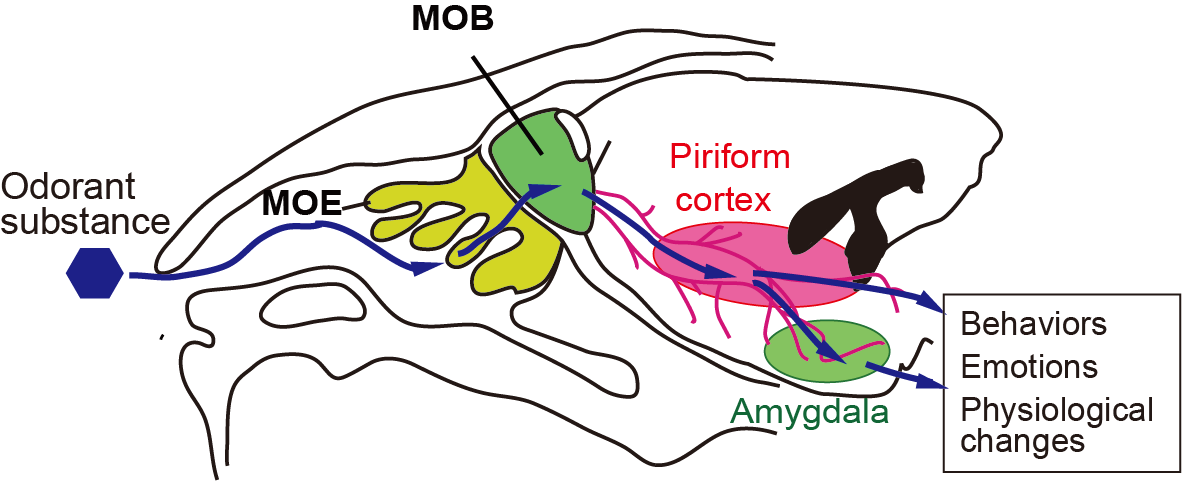
Fig. 1 Schematics of the mouse
olfactory system and relevant neural pathways. In mice, odorants bind to
olfactory receptors in the main olfactory epithelium (MOE). The signal is then transduced
to the glomerulus in the main olfactory bulb (MOB), mitral cells, neural
pathways, and higher-order centers.
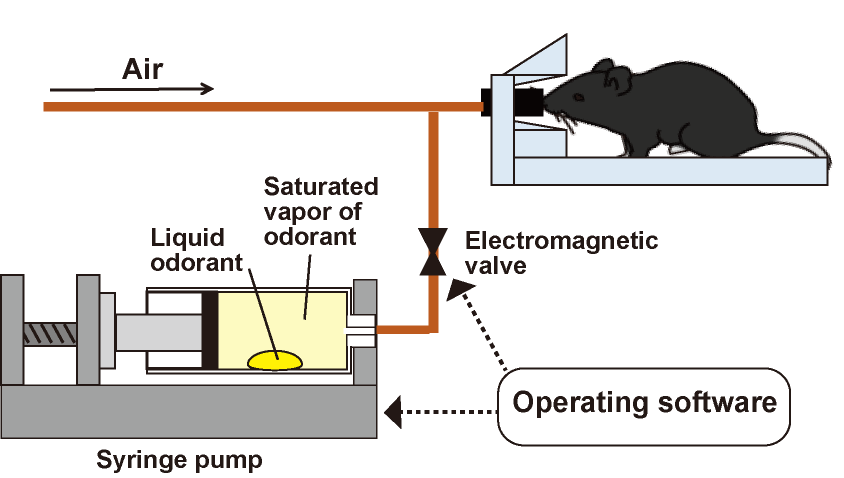
Fig. 2 Odor
stimulation system. A syringe pump is used in our system. In this system, a drop of liquid odor
substance is placed in the syringe. The
odorant is vaporized to a saturated vapor, which is infused into the air
line. The use of a syringe pump allows
for the administration of quite small amounts of odor substance. The syringe pump and electric valve are
controlled by the operating software, allowing precise control of the
stimulation timing and duration.
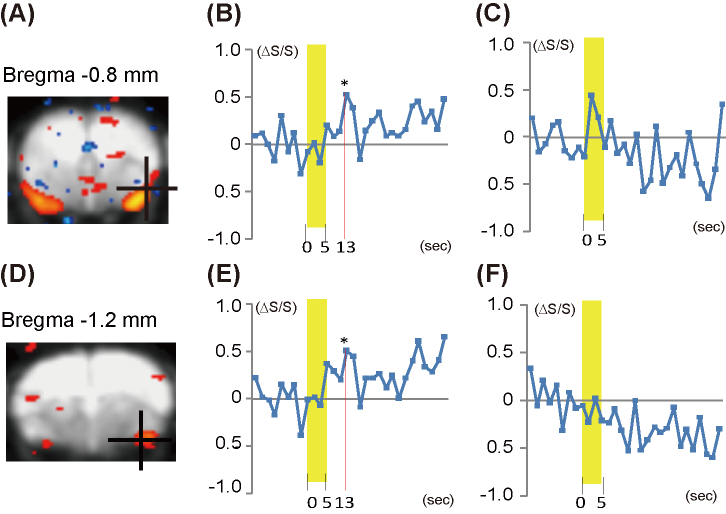
Fig. 3 Comparison of
muscone-evoked olfactory responses in higher-order brain regions in mice. In the experiment with the automated
stimulation system, muscone-evoked responses were detected in the piriform
cortex (A) and amygdala (D). The time courses of signals in the piriform cortex
(B) and amygdala (E) are shown. Time courses in corresponding regions in mice
with manual operations are shown (C) and (F). The odor exposure periods are
shown by yellow bars.
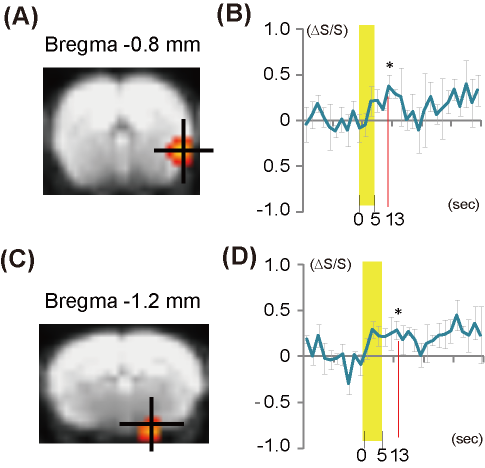
Fig. 4 Group analysis of mice stimulated with the
automated system.
The activation maps for the piriform cortex (A)
and amygdala (C). The time courses of the
BOLD signals in the piriform cortex and amygdala are shown in (B) and (D),
respectively. The odor exposure periods
are shown by yellow bars.