3677
Energy usage of a newly operational GE Healthcare Signa Premier 3T MRI1Radiology & Biomedical Imaging, University of California, San Francisco, San Francisco, CA, United States, 2Sustainability, University of California, San Francisco, San Francisco, CA, United States
Synopsis
Healthcare is a leading producer of carbon emissions with radiology as a key contributor. Our study describes the GE Premier's energy consumption. When operational for 10 hours in a 24 hour day, the GE Premier consumed 57.69 kwh, which is over double the energy consumption of the average household. Individual scans require 2.44-4.98 kwh; refrigerators use 1-2 kwh a day. Ready-to-scan and scanning modes require 4-10x the power of off mode. Optimizing the use of off mode will yield energy savings, and comparison to other models may guide environmentally conscious expansion of radiology services.
Introduction
Reports this year show that the United States’ (US) health system is the 7th largest producer of carbon dioxide in the world.1 Healthcare in the US emitted 10% of carbon dioxide produced in the country during 2011, which equates to 20,000 premature deaths.2,3 At our 800 bed tertiary care hospital, the University of California, San Francisco (UCSF), Radiology was found to be within the top two departments for energy consumption. Internationally, hospitals have investigated the energy use for magnetic resonance imaging (MRI) scanners and found that lower energy modes represent an opportunity for savings.4,5 This year, UCSF installed the highly anticipated GE Healthcare Signa Premier 3T MRI (GE Premier), a 70cm bore scanner equipped with a high performance gradient coil.6 Despite expansion of radiology services and knowledge of imaging’s significant carbon footprint, research and strategies for MRI energy efficiency has yet to be implemented throughout healthcare systems. This project aims to define the energy usage for one of the most advanced MRI scanners available and patterns of use at a tertiary care medical center. Our efforts are timely as UCSF is currently upgrading and replacing older MRI scanners. Also, the data from this project can elucidate areas for energy conservation, provide persuasion for manufacturers to prioritize technological advances in energy savings, and inform future MRI purchasing decisions for growing institutions.Methods
This is a descriptive study examining a single MRI scanner at a tertiary care medical center. The MRI scanner studied was the GE Healthcare Signa Premier 3T with software 27x and a dedicated cooling system. Power usage was measured by Power AnalyticsTM with a power quality analyzer (PowerSight PS4500), which was installed within the power distribution unit of the scanner’s equipment room. Power was captured at single-second intervals for 15-18 hours a day for 5 days, and was described by kilowatt x hour (kwh) and kilowatt per hour (kw/h). Scatterplots were constructed with kilowatt (kw) values on the vertical “y” axis and hours as the values on the horizontal “x” axis. The area under the curves (AUC) approximated the amount of kwh, and thus power used by the MRI scanner. Right-sided Riemann’s sums were specifically used to approximate the area under the kw by hour graph. The rate of power consumption, kw/h, was calculated by averaging the kw values over a certain duration. For types of exams done more than once, the energy usage and scanning duration were averaged. Microsoft Excel 2011 was used to perform graphing, estimation of AUC, and descriptive statistics. Equation: “y” value in kw * “x” value in hours = “power used” kwhResults
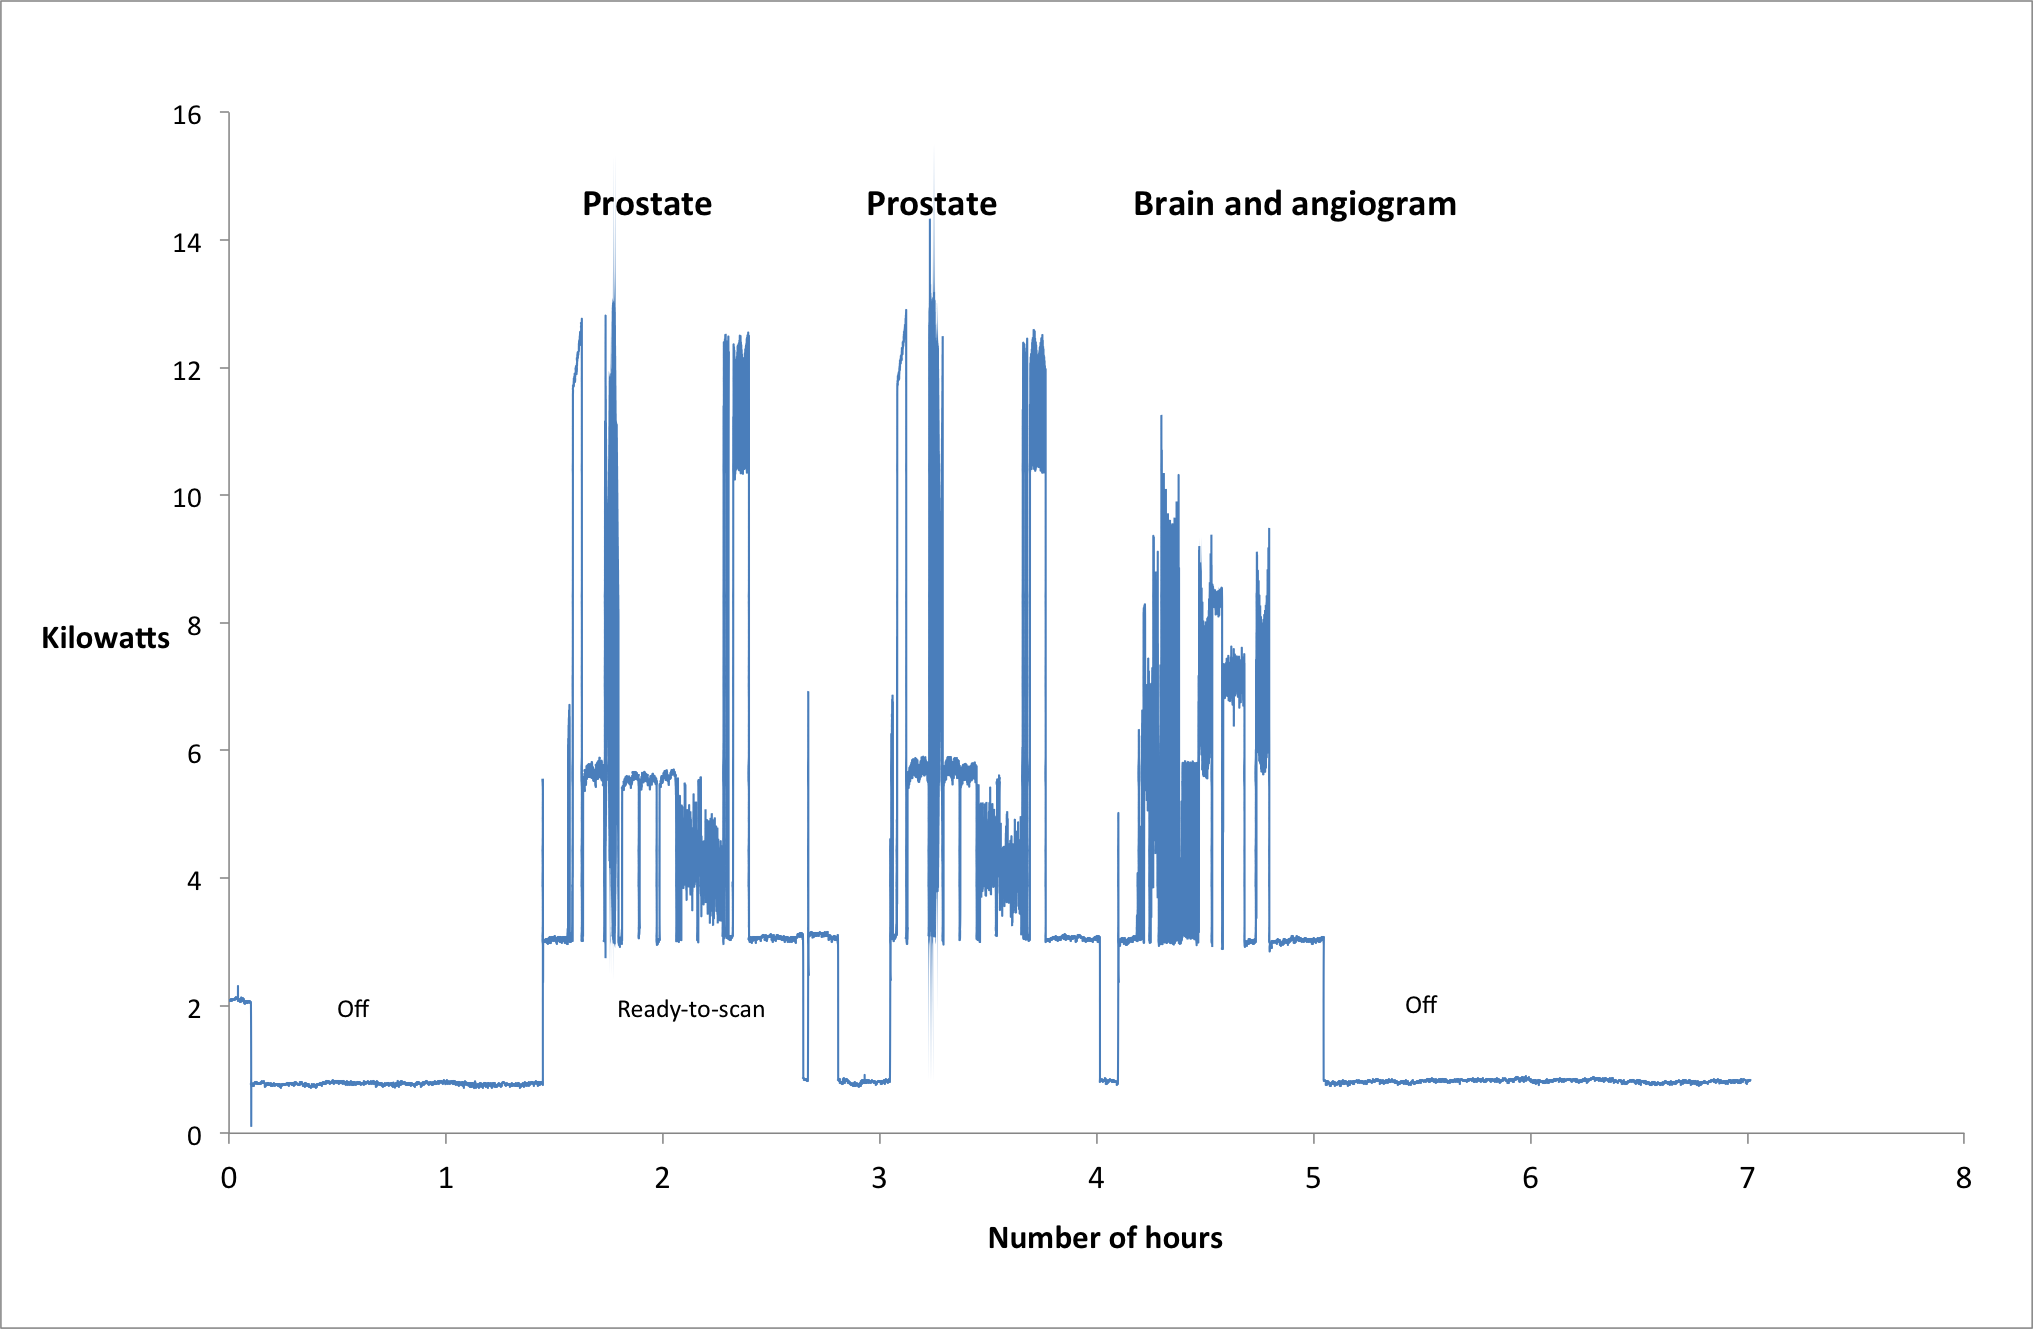
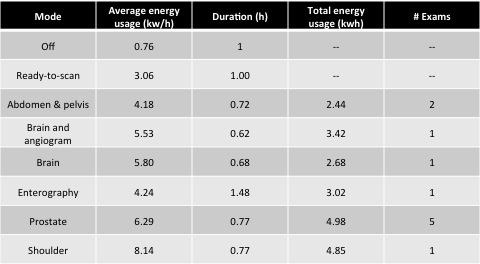
The GE Premier has three distinct modes of operation: off, ready-to-scan, and scanning (Figure 1). The average rate of power consumption when off was 0.76 kw/h. Ready-to-scan required 4 times as much power as off mode, a rate of 3.06 kw/h. Scanning can consume 5.5 – 10.7 times as much as off mode for rates of 4.18 -8.14 kw/h (Table 1). Compared to household items, a modern refrigerator uses 1-2 kwh per day.8 Exams last between 0.62-1.48 hours (37-88 minutes). The total power needed per scan ranged from 2.44 – 4.98 kwh. Off mode is used overnight and during significant wait times between scans. Over 5 days, the GE Premier performed 3-10 exams daily with an average of 7 (SD 3) for a total of 35. Of these exams, 13 were analyzed for energy consumption (Table 1). During the busiest day, the GE Premier was active for 10 hours and performed 10 scans. Total energy consumption on this day was 57.69 kwh, which includes 45.99 kwh for 10 hours in either ready-to-scan or scanning modes, and 11.70 kwh for the 14 hours in off mode. For comparison, a 3-person household in California uses 22 kwh per day.7Conclusion
With the addition of a GE Premier, UCSF has been able to perform up to 10 outpatient scans daily; each scan lasting 0.62-1.48 h. The scanner operates in off, ready-to-scan, and scanning modes. Ready-to-scan requires 4x as much power, while scanning can take up to 10x the power as off mode. MRI scans with the GE Premier consume between 2.44-4.98 kwh. The energy efficient off mode is used between scans and overnight. Future directions include metering older GE Healthcare models at UCSF and compare their energy consumption with that of the GE Premier. Also, we will compare the energy usage from standard models and models equipped with energy-saving technology.Acknowledgements
Dr. Geraldine Tran was supported by the UC President’s Bonnie Reiss Carbon Neutrality Fellowship and the National Institutes of Health (NIBIB) T32 Training Grant, T32EB001631.
We thank Jeff Rodriguez of PowerAnalyticsTM for installation of the power quality analyzer.
References
- Blumenthal, David; Seervai S. U.S. Health System Will Need to Adapt to Climate Change - The Commonwealth Fund. http://www.commonwealthfund.org/publications/blog/2018/apr/health-system-and-climate-change. Accessed May 18, 2018.
- Eckelman MJ, Sherman JD. Estimated Global Disease Burden From US Health Care Sector Greenhouse Gas Emissions. Am J Public Health. 2018;108(S2):S120-S122. doi:10.2105/AJPH.2017.303846.
- Chung JW, Meltzer DO. Estimate of the Carbon Footprint of the US Health Care Sector. JAMA. 2009;302(18):1970. doi:10.1001/jama.2009.1610.
- Sheppy M, Pless S, Kung F, Sheppy M, Pless S, Kung F. Healthcare Energy End-Use Monitoring Healthcare Energy End-Use Monitoring. 2014;(August).
- Herrmann C, Rock A. Magnetic Resonance Equipment (MRI) - Study on the potential for environmental improvement by the aspect of energy efficiency. 2012:1-30. http://www.eceee.org/ecodesign/products/medical_imaging_equipment/Improvement Potentials for MRI 2012-03-09 draft for discussion with CF.pdf.
- SIGNATM Premier – 70cm Tomorrow’s MR... Today. https://www.gehealthcare.com/en/products/magnetic-resonance-imaging/3-0t/signa-premier. Accessed November 1, 2018.
- Silverman D. Comparisons of Household Power Usage. https://www.physics.uci.edu/~silverma/actions/HouseholdEnergy.html. Accessed November 6, 2018.
- Appliance Energy Use Chart. http://www.siliconvalleypower.com/for-residents/save-energy/appliance-energy-use-chart. Accessed November 6, 2018.
Figures