3671
The changes of R2’ in quantitative evaluation of acute renal injury: Preliminary animal study1Peking University, Beijing, China, 2Shanghai Jiao Tong University, Shanghai, China, 3Peking University First Hospital, Beijing, China
Synopsis
As a recently proposed novel pulse sequence, the pulse-shifting multi-echo asymmetric spin echo (psMASE) can isolate R2’ in real time. Combined with gas challenge, it can be used to evaluate acute renal injury (AKI) quantitatively. In this study, we further investigated the feasibility of the change of R2' value (dR2’) in distinguishing different severities of AKI using this sequence. Results suggested that there was significant difference between the different severities of AKI and dR2’, which indicating that the dR2' value can serve as a potential quantitative indicator for acute renal injury evaluation.
Introduction
R2 ' is a functional parameter that directly reflects the magnetic sensitivity of hemoglobin and can be used to evaluate AKI with better accuracy1. Recent studies have shown that a novel sequence called psMASE, combined with gas challenge, can dynamically measure R2’ signals in real time2,3, but the correlation between the change of R2' value (dR2’) and the extent of tissue injury is still unclear. In this study, twenty rabbits were performed acute renal injury (AKI) operation by microspheres, and were divided into mild, moderate, severe and control groups. The degree of injury was then examined by T2w and identified by histopathological results. Then, we used one way analysis of variance (ANOVA) with the Student-Newman-Keul’s (SNK) post hoc test to evaluate the difference in dR2' among different degrees of injury, so that the relationship between dR2’ and pathology was examined.Methods
MRI Methods
This study was approved by the Animal Care and Use Institutional Committee and performed in accordance with the guidelines. The experimental subjects were 20 New Zealand white rabbits divided into four groups (control, mild, moderate, severe), and each group has five subjects. The mild, moderate and severe acute renal injury models were made by injecting 20,000, 40,000 and 60,000 microspheres doses of suspension into the right renal artery opening. After the operation, a continuous dynamic scan was performed in the air chamber using the psMASE sequence, and the air and carbon dioxide alternately entered, each for 5 minutes, for a total of 20 minutes. The pathological section was scanned and produced 3 weeks after operation using T2w sequence. The scan parameters are as follows:FOV,150×150 mm²;matrix size,70×70;repetition time= 2000 ms;TE1/TE2/TE3/TE4 = 60/80/100/120 ms;echo space = 20 ms;τ = -10/0/10 ms;slice thickness = 5 mm;SENSE factor = 2.
Statistical analyses
R2’ maps were generated as reported previously2, with in-house software programed with MATLAB R2018a (MathWorks Inc., Natick, MA, USA). Then, the dR2’ of each subject before and after gas challenges was evaluated. The injured area was selected manually according to pathology section and T2w image, and the mean value of dR2’ in the injured area was used. We used one-way analysis of variance with Student-Newman-Keul’s test for data analysis. Statistical analyses were performed using SPSS 19.0 software (SPSS, Inc., Chicago, IL, USA). A P value of less than 0.05 was considered to be significant.
Results
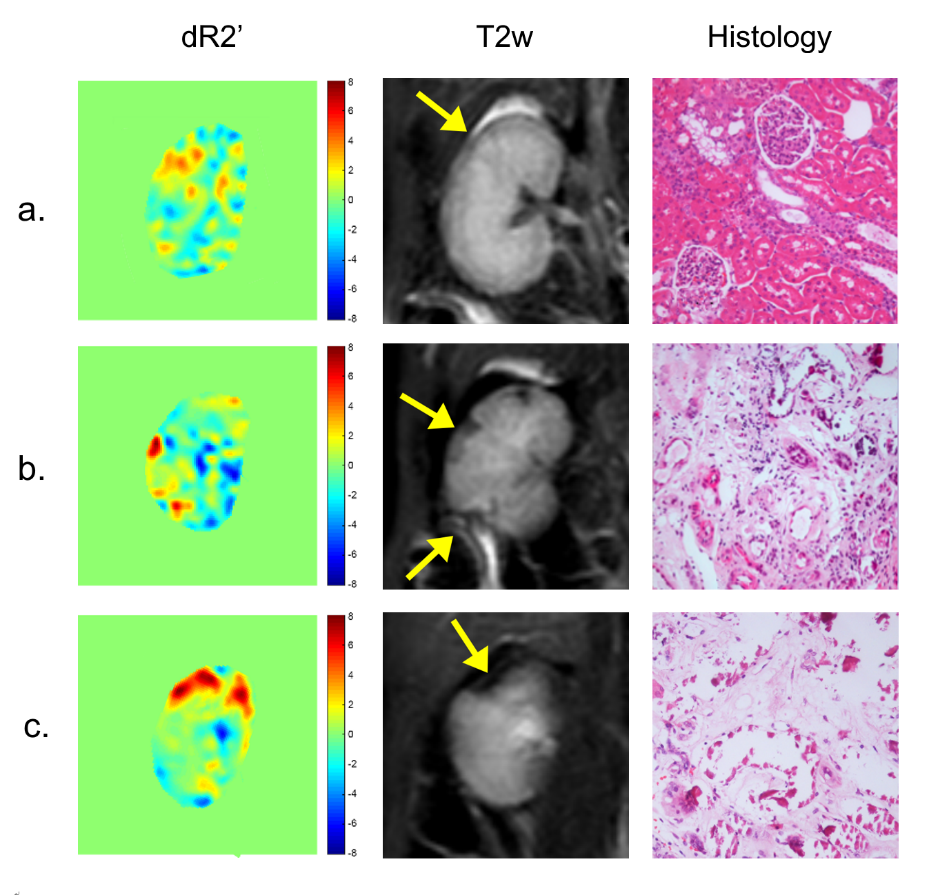
Typical lesions in mild (a), moderate (b) and severe (c) groups are shown in Fig 1, where the yellow arrows indicate the most affected areas. The calculated renal dR2’ maps, T2w images obtained after 3 weeks and pathological section results are shown in each group. For the mild case, mild vacuole degeneration occurs in a few renal tubular epithelial cells; for the moderate case, abscission of the epithelial cells, tubular ectasia and cellular debris are observed; and for the severe case, necrosis of the renal tubular epithelial cells is observed, and the basement membrane is exposed.
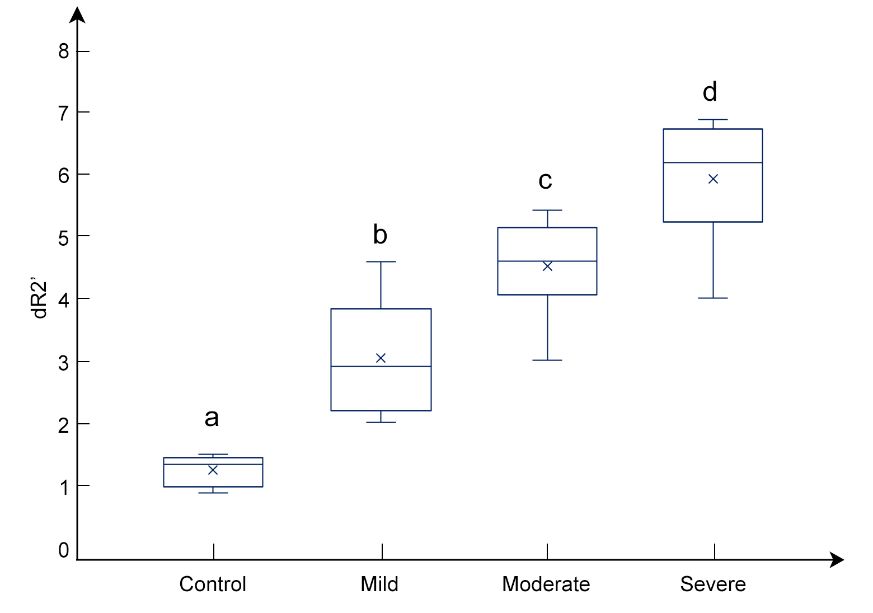
As shown in Fig 2, significant differences were found in dR2’ among groups with different severities of AKI (normal, mild, moderate and severe). Different letters above the boxes indicate significant differences according to the Student-Newman-Keul's multiple range test (P < 0.05). The values of dR2’ were 1.28 ± 0.24 (control), 3.25 ± 0.89 (mild), 4.82 ± 0.42 (moderate) and 6.31 ± 0.54 (severe) in the injured area.
Discussion
In our study, the change of R2' caused by gas challenge is able to distinguish different severities of AKI (normal, mild, moderate and severe). A one-way analysis of variance indicates a significant difference between the different severities of AKI and dR2’. The results showed that the dR2’ value of kidney could be used as a potential quantitative indicator for acute renal injury evaluation, and the psMASE sequence with gas challenge strategy might provide a new way for non-invasive evaluation of AKI.Acknowledgements
No acknowledgement found.References
1. Zhang J, Rusinek H, Chandarana H, Lee VS, Functional MRI. of the kidneys. J Magn Reson Imaging. 2013;37:282–293.
2. Wang C, Zhao K, Zhang R, et al. Evaluation of renal oxygenation change under the influence of carbogen breathing using a dynamic R2, R2’ and R2* quantification approach[J]. NMR in Biomedicine, 2016, 29(11): 1601-1607.
3. Chengyan Wang , Bihui Zhang, et al. Hemodynamic response to respiratory challenge evaluated by dynamic R2’ imaging: application for acute renal ischemia caused by microsphere-induced renal artery embolism. ISMRM 2018
Figures