3669
MRI prediction of Slipped Capital Femoral Epiphysis in children1Department of Radiology, Shengjing Hospital of China Medical University, Shenyang, China, 2Department of Radiology, Liaoning Electric Power Center Hospital, Shenyang, China, 3Philips Healthcare, Beijing, China, 4Cancer Research UK Cambridge Institute, University of Cambridge, Cambridge, United Kingdom
Synopsis
We compared the MRI images of peripheral skeletal muscle atrophy and steatosis between heathy children and children with Slipped Capital Femoral Epiphysis (SCFE). Statistical analysis revealed the correlation between the two pathological changes in MRI images and the incidence of SCFE,and get the threshold value of two indicators leading to the onset of SCFE,which holds potential for the guidance on clinical diagnosis and therapy plan for SCFE.
Introduction
Slipped Capital Femoral Epiphysis (SCFE) is one of the most common cause of periacetamular pain in children, with an incidence rate of 1/5000 to 1/10000 in children and yongsters, and the incidencerate varies among different ethnics [1]. The hip joint consists of the femoral head and the acetabulum, and its main function is to support weight and walk. Peripheral muscle is critical to hip joint activity as a stabilizer [2], and its role in hip diseases is attracting increasing attention [3].MRI can clearly show the cross-sectional area of the muscle and quantify the fat content, which has been used to evaluate the peripheral muscles for various hip joint diseases in children. The purpose of this study was to evaluate the difference of periacetabular muscle atrophy and the adipositization between healthy children and SCFE patients using MRI, to assess the effect of periacetabular muscle on SCFE pathogenesis, and to provide new imaging diagnostic indicators for SCFE.Methods
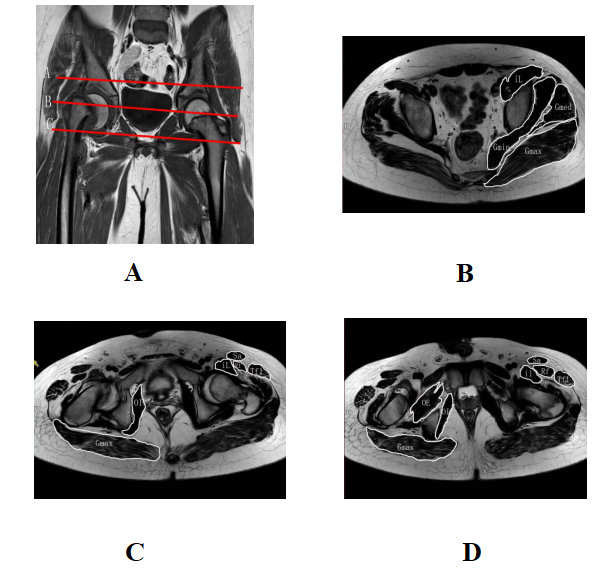
Twenty-five children diagnosed with single-sided SCFE were included into this study, while 10 healthy children were included into a control group. All patients and volunteers received MRI at 3.0 T (Philips, Best, Netherlands) . Inclusion criteria for healthy children: no apparent hip diseases on MRI, aged 6-15. The subjects were scanned using 8 channel phase arrayed hip coil in supine position.The imaging sequences included routine coronary T1W, coronary T2W, axial T1W, and coronary and sagittal T2W with lipid suppression.The muscle group cross-sectional area (M-CSA) and the muscle fat infiltration (FI) for both sides of the hips were scored by two experienced radiologists on the axial T2W and T1Wimages. The following regions were scored (Figure 1): three muscle groups (the anterior group or the flexor group, the medial group or the external rotator group, and the posterior group or the extensor group) at three slices (at 2cm above the femoral head, femoral head - greater trochanter, and pubic symphysis, respectively).FI score criteria were [4]: 0 - normal appearance; 1 – hyperintensity dots;2– hyperintensity volume ≤ 50%; 3 – hyperintensity volume>50%; 4 –a statewhen the entire muscle is replaced by hyperintensity.The threshold of M-CSA and FI at the onset of SCFE were obtained by analyzing the ROC curve of both SCFE patients and healthy subjects.P <0.05 indicates statistically significant.Results
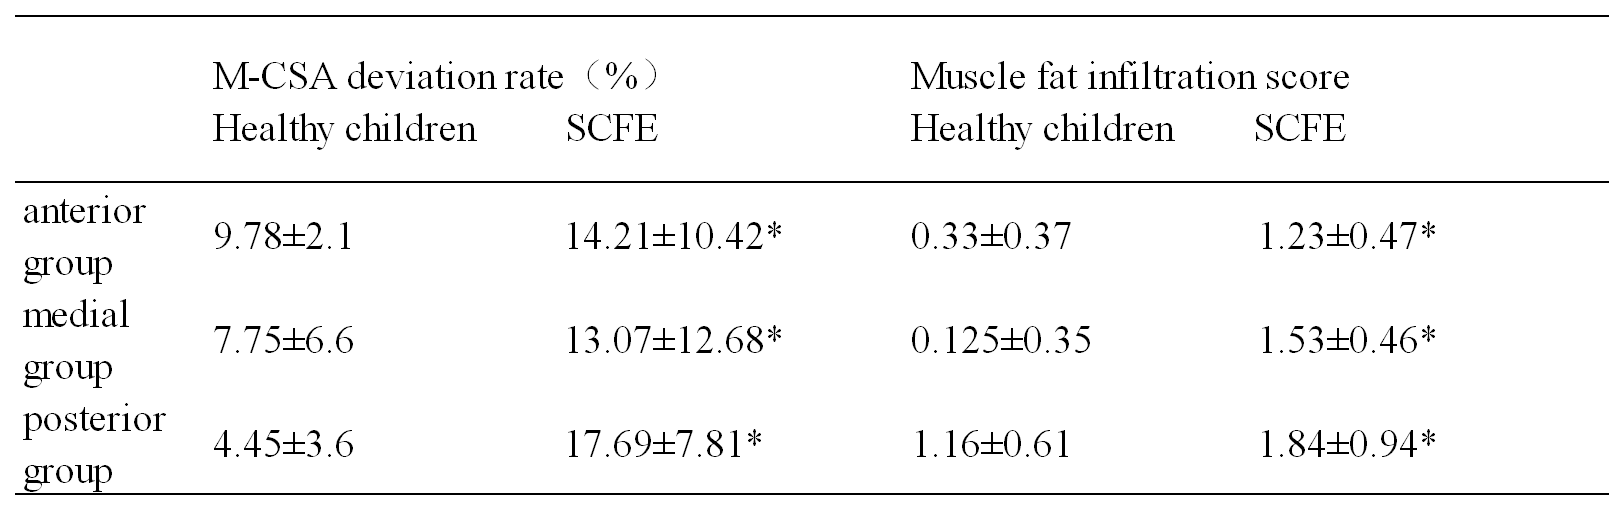
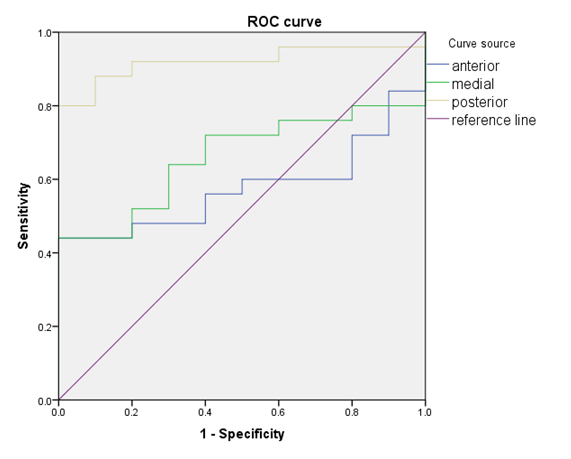
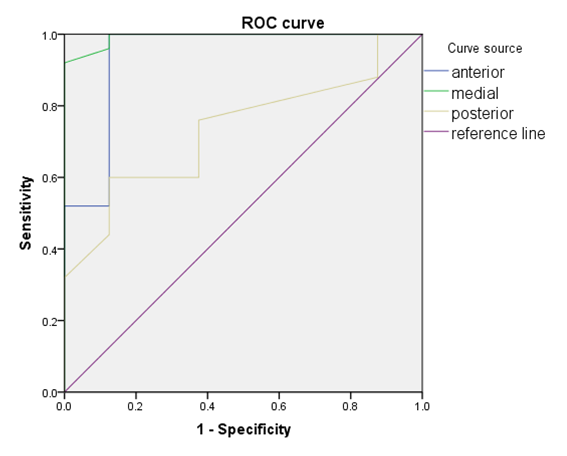
There was significant difference (Figure 2) in the bilateral M-CSA and FI scores between the patients and healthy children (P < 0.05). According to the ROC curve analysis for the two groups, M-CSA (Figure 3) had different diagnosis accuracy in different regions: posterior group> medial group > anterior group, where AUC = 0.915 for the posterior group. The threshold of muscle atrophy for the onset of SCFE was 11.92%, with an 80% sensitivity and a 100% specificity: the muscle atrophy > 11.92% indicates a SCFE possibility of 80%. The fat infiltration (Figure 4)also showed varying accuracy in different regions: anterior group > medial group > posterior group (AUCs = 0.993, 0.940, and 0.733 respectively), where both the former two groups holds promise for SCFE diagnosis. The anterior group had a threshold value of 0.44for the muscle fat infiltration, with 100%sensitivity and 87.5%specificity.The medial group had a threshold value of 1.08 for the muscle fat infiltration, with 92% sensitivity and 100% specificity.Discussion
In clinical practice, a considerable number of patientsare misdiagnosed or diagnosed with delay [5-6], mainly due to the lack of clear imaging findingsin the SCFE imaging.We found in our clinical practice thatthe hip M-CSAof SCFE patients aresmaller than the contralateral, which agreed with theliteraturesthat SCFE patients have thinner lateral femoral quadriceps muscle in the affected side[7], leading to the design of this study.Image analysisrevealed that the SCFE children has significantly higher muscle atrophy and adipositization than the healthy children. In healthy children, there was also variation in the bilateral M-CSA between the two groups of hip muscles, as well as some adipositization, but no femoral head slip presented. Periacetabular muscle gradually loses its support on the hip when atrophy and adipose progress to a certain extent, and hence the pathogenesis of SCFE. The results hence suggested the importance of muscle training for the SCFE patients for a better prognosis, in addition to the regular surgery plan.This work also holds diagnosis promise, suggesting the possibility of SCFE when the adolescent patients present bilateral hip muscle asymmetry in MRI.Conclusion
Patients with SCFE have significantly higher hip muscle atrophy and fat infiltration than normal children, as could be captured via a combination of T1W and T2W MR imaging. When muscle atrophy and fat infiltration increase to a certain level, the incidence of SCFE is significantly increased.Asymmetric fat infiltration and atrophy in children's hip muscles suggest that SCFE may occur.Acknowledgements
No acknowledgement found.References
1.Lehmann CL, Arons RR, Loder RT, Vitale MG. The epidemiology of slipped capital femoral epiphysis: an update. J Pediatr Orthop. 2006;26:286–290.
2.Agten Christoph A,Sutter Reto,Buck Florian M et al. Hip Imaging in Athletes: Sports Imaging Series .Radiology, 2016; 280(2): 351-69.
3.Boutin Robert D,Bamrungchart Sara,Bateni Cyrus P et al. CT of Patients With Hip Fracture: Muscle Size and Attenuation Help Predict Mortality.AJR Am J Roentgenol, 2017;208(6): W208-W215.
4.Fischer D, Kley RA, Strach K, et al. Distinct muscle imaging patterns in myofibrillar myopathies. Neurology, 2008;71 (10): 758-765.
5.Perry DC, Metcalfe D, Costa ML, Van Staa T. A nationwidecohort study of slipped capital femoral epiphysis. Archivesof disease in childhood. 2017;102(12):1132-1136.
6.Kocher MS, Bishop JA, Weed B, et al. Delay in diagnosis of slipped capital femoral epiphysis. Pediatrics 2004;113:e322-325.
7.Robben S G,Meradji M,Diepstraten A F et al. US of the painful hip in childhood: diagnostic value of cartilage thickening and muscle atrophy in the detection of Perthes disease.Radiology, 1998;208(1): 35-42.
Figures