3666
Evaluation the functional of parotid glands in diabetic patients: diffusion-weighted echo-planar MRI before and after stimulationXuemei Wang1, Mingjia Niu1, Lanxiang Liu1, Yuan Fang1, Tao Zheng1, Juan Du2, Qinglei Shi3, Shuang Wu1, and Jinglong Li1
1Qinhuangdao Municipal No. 1 Hospital, Qinhuangdao, China, 2Graduate School of Hebei Medical University, Shijiazhuang, China, 3MR Scientific Marketing, Siemens Healthcare, Beijing, China
Synopsis
Recent studies have reported that lipid infiltration (LIPG) may be one of the mechanisms of salivary secretion decrease in diabetic patients. In this study, we compared the difference of ADCs between normal and patients before and after stimulation. It demonstrated that diffusion-weighted echo-planar MR imaging allows non-invasive quantification of functional changes in the parotid glands and the feasibility in reflecting the degree of fat deposition in parotid gland caused by parotid dysfunction.
Objective
To evaluate the performance of diffusion-weighted (DW) echo-planar imaging (EPI) in diagnosing functional conditions of the parotid gland in diabetic patients through acid stimulation. In order to study the variation of fat content of parotid gland in diabetic patients, a correlation analysis between the ratio of signal intensity of parotid gland (SIopposed-phase/SIin-phase) with T1 weighted VIBE sequence and apparent diffusion coefficient (ADC) was performed.Methods
40 male diabetic patients aged 40-60 years and 40 healthy volunteers were examined with 3D T1-weighted volumetric interpolated breath-hold examination (VIBE) sequence and single shot echo-planar (EP) diffusion-weighted (DW) imaging at 3.0 T scanner (MAGNETOM Skyra, Siemens AG, Erlangen, Germany). The examinations were performed before and every 3 min until 10 times after the acid stimulation with vitamin C pill 500 mg. The volume of interest (VOI) was segmentated and measured by a radiologists with more than 10 years of diagnostic experience with a software of ITK-SNAP (https://itk.org/). The values of ADC at every time point and the peak value of ADC were compared between the two groups by using Independent sample t test and the correlation between ADC values of ratio of signal intensity of parotid gland was analyzed by using Pearson correlation analysis. A P-value< 0.05 was considered to indicate significant difference.Results
The ADCs of parotid gland in patient group at resting state was slightly lower than that in volunteer group [(1.02 ±0.08) ×10-3mm2/s vs (1.11 ±0.09) ×10-3mm2/s p > 0.05]. The ADC values of the volunteer group increased after stimulation until reached the peak gradually. The ADC values of the patient group decreased after stimulation firstly, then increased until to the peak gradually. The maximum peak value of patient group was significantly lower than that of volunteer group [(1.45 ± 0.08) ×10-3mm2/s vs (1.7 ± 0.06) ×10-3 mm2/s, (p < 0.05)]. There was a significant correlation between the peak ADCs of parotid gland and the ratio of signal intensity of parotid gland after acid stimulation (r = 0.666, p < 0.05).Conclusion
Diffusion-weighted echo-planar MR imaging allows non-invasive quantification of functional changes in the parotid glands in diabetic patients. The ADC values may reflect the degree of fat deposition in parotid gland caused by parotid dysfunction.Acknowledgements
No acknowledgement found.References
No reference found.Figures
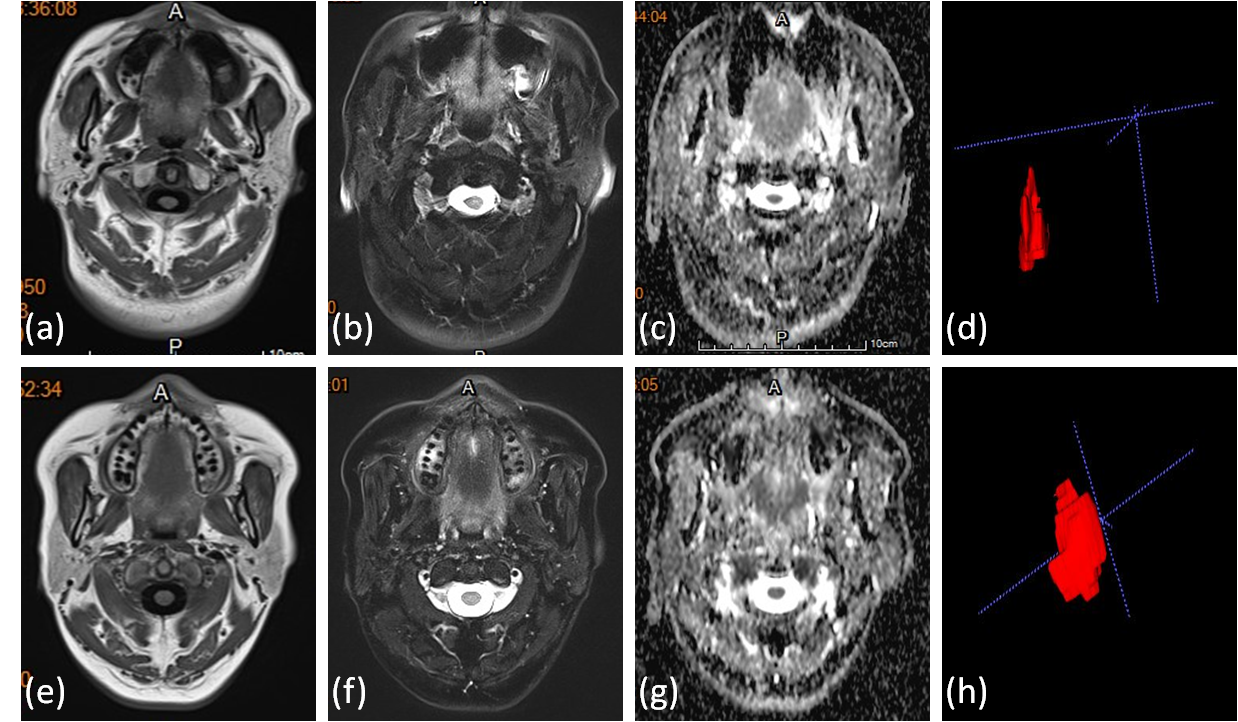
Fig. 1. MRI of parotid gland in the patient and healthy volunteer
(a-c) T1WI, T2WI, ADC images in the patient,(d) The three-dimensional measurement diagram of
ADC values in the patient, (e-g) T1WI, T2WI, ADC images in the healthy volunteer, (h) The three-dimensional measurement diagram of ADC values in the healthy volunteer.
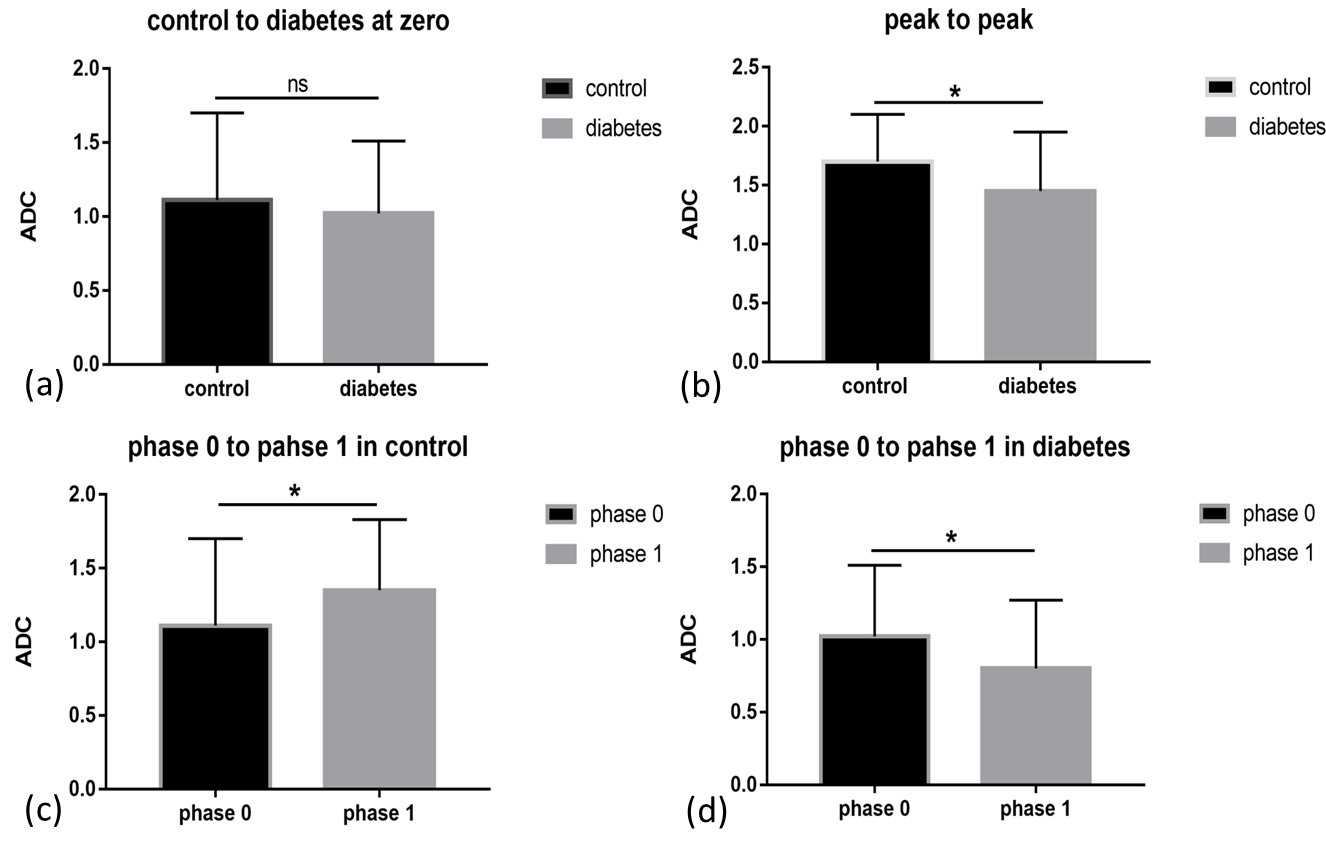
Fig.
2. (a) The
ADC values of between
control and diabetes group in resting state, (b) The
ADC peak values between control and diabetes group after stimulation, (c) The
ADC values of control group in the first phase
after stimulation,
(d) The ADC values of
patient group in the first phase after stimulation.
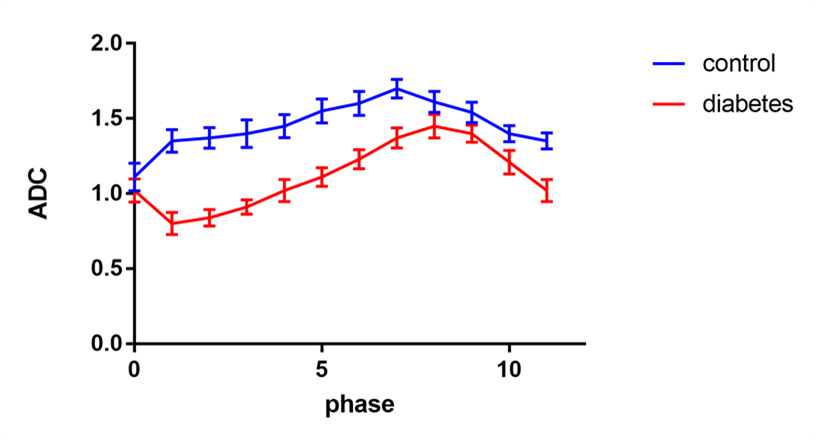
Fig.
3.
ADC changes in the parotid gland
during gustatory stimulation.
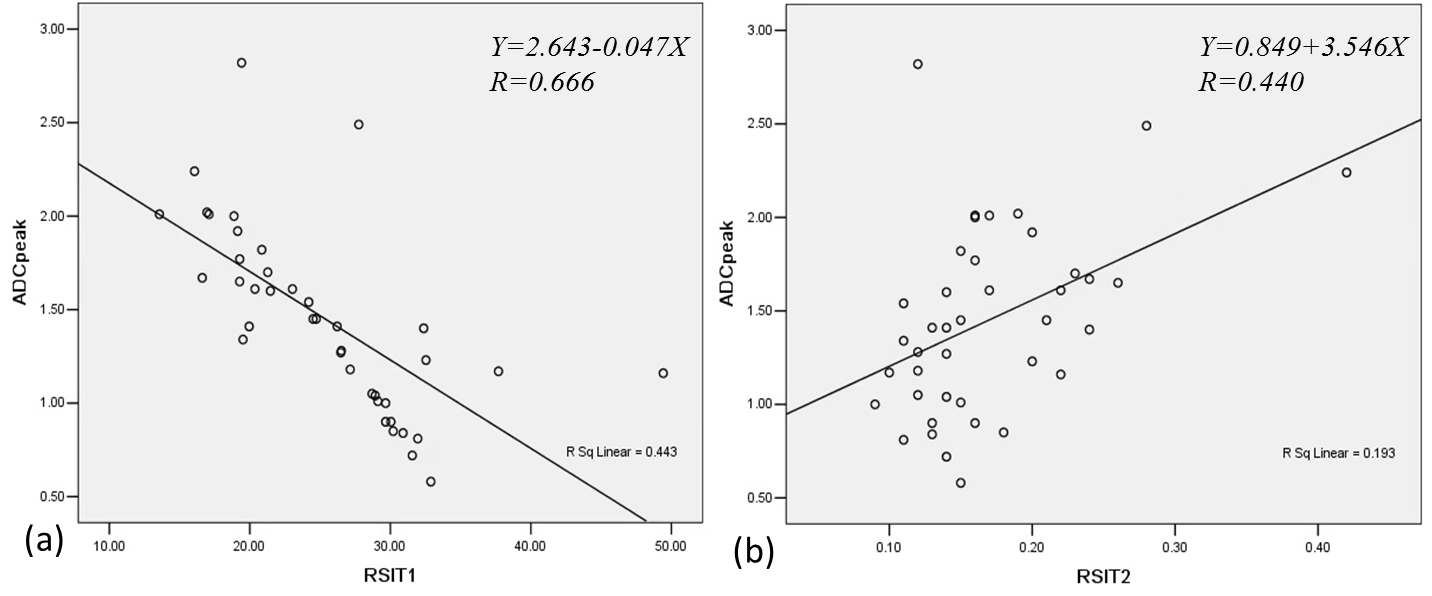
Fig. 4.The correlation
analysis between the peak ADC and the ratio of signal intensity of parotid
gland (SIopposed-phase/SIin-phase) with T1 weighted VIBE sequence in parotid
gland after acid stimulation.
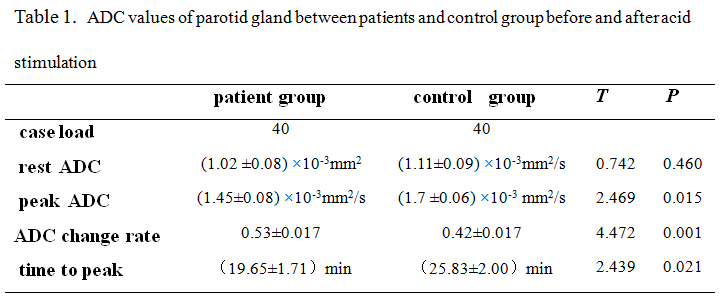
Table 1. ADC
values of parotid gland between patients and control group before and after
acid stimulation