3662
Early evaluation of radiation-induced parotid damage in patients with nasopharyngeal carcinoma by T2 mapping and mDIXON Quant imaging: initial findings1Radiology, Drum Tower Hospital, School of Medicine, Nanjing University, Nanjing, China, 2Philips Healthcare, Shanghai, China
Synopsis
Forty-one patients with NPC underwent T2 mapping and mDIXON Quant imaging for parotid glands before RT, mid-RT, and post-RT. From pre-RT to mid-RT, parotid T2 and FF values increased significantly. From mid-RT to post-RT, parotid T2 value continuously increased, but parotid FF value decreased significantly. Change rate of parotid T2 value significantly correlated with parotid atrophy rate from pre-RT to post-RT. Parotid T2 value and FF value negatively correlated with parotid volume, while parotid T2 value positively correlated with MR scan time point significantly. T2 mapping and mDIXON Quant imaging is useful for noninvasive evaluation of radiation-induced parotid damage.
INTRODUCTION
Radiation-induced parotid damage is a common complication in patients with nasopharyngeal carcinoma (NPC) treated with radiotherapy to head and neck region, which severely reduce the life quality of those patients. The aim of this study was to early evaluate the changes of irradiated parotid glands with T2 mapping and mDIXON Quant imaging.METHODS
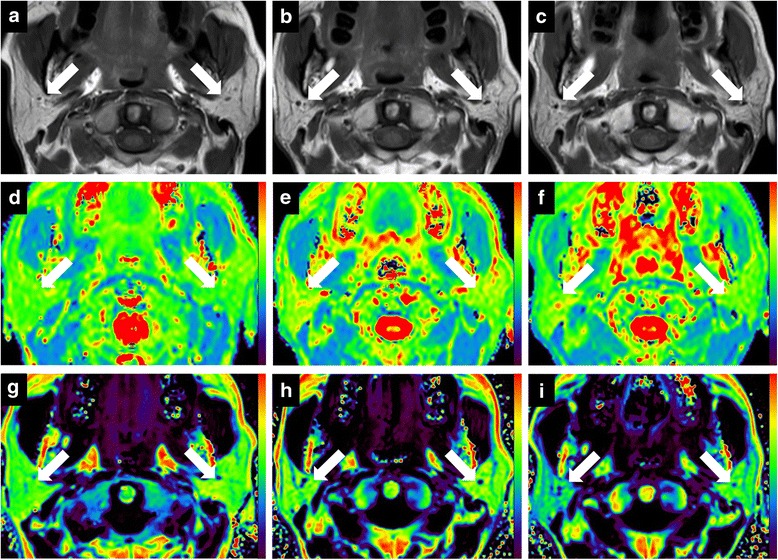
Forty-one patients with NPC underwent conventional magnetic resonance imaging for nasopharynx and neck, and T2 mapping and mDIXON Quant imaging for bilateral parotid glands within 2 weeks before radiotherapy (pre-RT), 5 weeks after the beginning of radiotherapy (mid-RT), and 4 weeks after radiotherapy (post-RT). Parotid volume, T2 values, fat fraction (FF) values, and mean radiation dose were recorded and analyzed.RESULTS
From pre-RT to mid-RT, parotid volume decreased (atrophy rate, 27.0 ± 11.5%), while parotid T2 and FF values increased (change rate, 6.0 ± 6.2% for T2 value and 9.1 ± 9.9% for FF value) significantly. From mid-RT to post-RT, parotid T2 value continuously increased (change rate, 4.6 ± 7.7%), but parotid FF value decreased (change rate, − 9.9 ± 18.2%) significantly. Change rate of parotid T2 value significantly correlated with parotid atrophy rate from pre-RT to post-RT (r = 0.313, P = 0.027). Multiple linear regression analysis showed that parotid T2 value (standardized coefficient [SC] = − 0.259, P = 0.001) and FF value (SC = − 0.320, P = 0.014) negatively correlated with parotid volume, while parotid T2 value positively correlated with MR scan time point (SC = 0.476, P = 0.001) significantly. Parotid T2 and FF values showed excellent reproducibility (intraclass correlation coefficient, 0.935–0.992).DISCUSSION
Parotid volume decreased significantly after radiotherapy with an atrophy rate of 27%, which might be due to the loss of acinar cells. Parotid T2 value continuously increased during radiotherapy, which can be explained by the continuous aggravation of tissue edema. We also confirmed a positive correlation between the change rate of parotid T2 value and parotid atrophy rate from pre-RT to post-RT. A possible explanation is that the enlarged extracellular space due to the loss of acinar cells caused an accumulation of free water in parotid parenchyma. It was reported that parotid shrinkage was significantly correlated with the decrease of saliva production in patients with head-and-neck cancer undergoing radiotherapy.
Parotid FF value first increased and then decreased during radiotherapy. Multiple linear regression analysis revealed that early increase of FF value was mainly due to parotid atrophy from pre-RT to mid-RT. From mid-RT to post-RT, parotid volume remained unchanged, while glandular edema continuously aggravated. The FF value reflects the relative proton density ratio between fat signal and the sum of fat and water signals, which might suggest that the decrease of parotid FF value was due to glandular edema from mid-RT to post-RT.
CONCLUSION
T2 mapping and mDIXON Quant imaging provided pathophysiological information of parotid gland during radiotherapy, which could serve as an objective and quantitative modality in evaluating early radiation-induced parotid damage and facilitate a timely adjustment of treatment scheme to alleviate the damage of parotid glands.Acknowledgements
No acknowledgement found.References
1. Stephens LC, King GK, Peters LJ, et al. Acute and late radiation injury in rhesus monkey parotid glands. Evidence of interphase cell death. Am J Pathol. 1986;124:469–478.
2. Chang HC, Juan CJ, Chiu HC, et al. Parotid fat contents in healthy subjects evaluated with iterative decomposition with echo asymmetry and least squares fat-water separation. Radiology. 2013;267:918–923.
3. Houweling AC, Schakel T, van den Berg CA, et al. MRI to quantify early radiation-induced changes in the salivary glands. Radiother Oncol. 2011;100:386–389.
4. Teshima K, Murakami R, Tomitaka E, et al. Radiation-induced parotid gland changes in oral cancer patients: correlation between parotid volume and saliva production. Jpn J Clin Oncol. 2009;40:42–46.
5. Li G, Xu Z, Yuan W, et al. Short- and midterm reproducibility of marrow fat measurements using mDixon imaging in healthy postmenopausal women. Skelet Radiol. 2016;45:1385–1390.
Figures