3660
Comparing the Quantitative T1 and T2 Mapping Acquired by Magnetic Resonance image Compilation (MAGiC) and MR Fingerprinting (MRF)1Department of Radiology, Wan Fang Hospital, Taipei Medical University, Taipei, Taiwan, 2GE Healthcare, Taipei, Taiwan, 3GE Healthcare MR Research China, Beijing, China, 4IMAGO7 Foundation, Pisa, Italy, 5National Institute for Nuclear Physics, Pisa, Italy, 6Department of Radiology, School of Medicine, College of Medicine, Taipei Medical University, Taipei, Taiwan
Synopsis
Quantifying tissue T1 and T2 provides valuable biomarker for characterizing various tissue pathologies yet limits by its long scan time and consequently hampered their clinical practice. Magnetic resonance image compilation (MAGiC) and Magnetic resonance fingerprinting (MRF) are novel imaging techniques that simultaneously provide quantitative maps of tissue relaxation times at one acquisition. We compared the quantitative values in various brain tissue using the MAGiC and MRF in healthy volunteers. In quantifying T1 between two techniques, no significant difference was found in white matter and gray matter, but difference was observed in cerebrospinal fluid. On the contrary, T2 value showed significant difference.
INTRODUCTION
T1 and T2 mappings that allow an absolute quantification of tissue parameters have driven the growing interest as a tool that enable clinicians to accurately evaluate disease1,2 and compare examinations within longitudinal follow-up or between patients. However, quantitative measurement is often time-consuming and thus may not be applicable to clinical practice. Magnetic resonance Fingerprinting3 (MRF) and a recent commercially available technology named magnetic resonance image compilation4, MAGiC, received lots of attention because they can yield simultaneous quantitative T1 and T2 maps in one acquisition. In addition, various clinical useful image contrast such as T1, T2, T2-FLAIR can be synthesized since the T1 and T2 value has been derived and can be as inputs for signal synthesis. With similar pros in these two promising techniques, no literature has compared the difference between MRF and MAGiC in terms of their image quality and quantitative values. Here we compare the quantitative T1 and T2 values driven from these two techniques among three brain tissues in healthy volunteers.METHODS
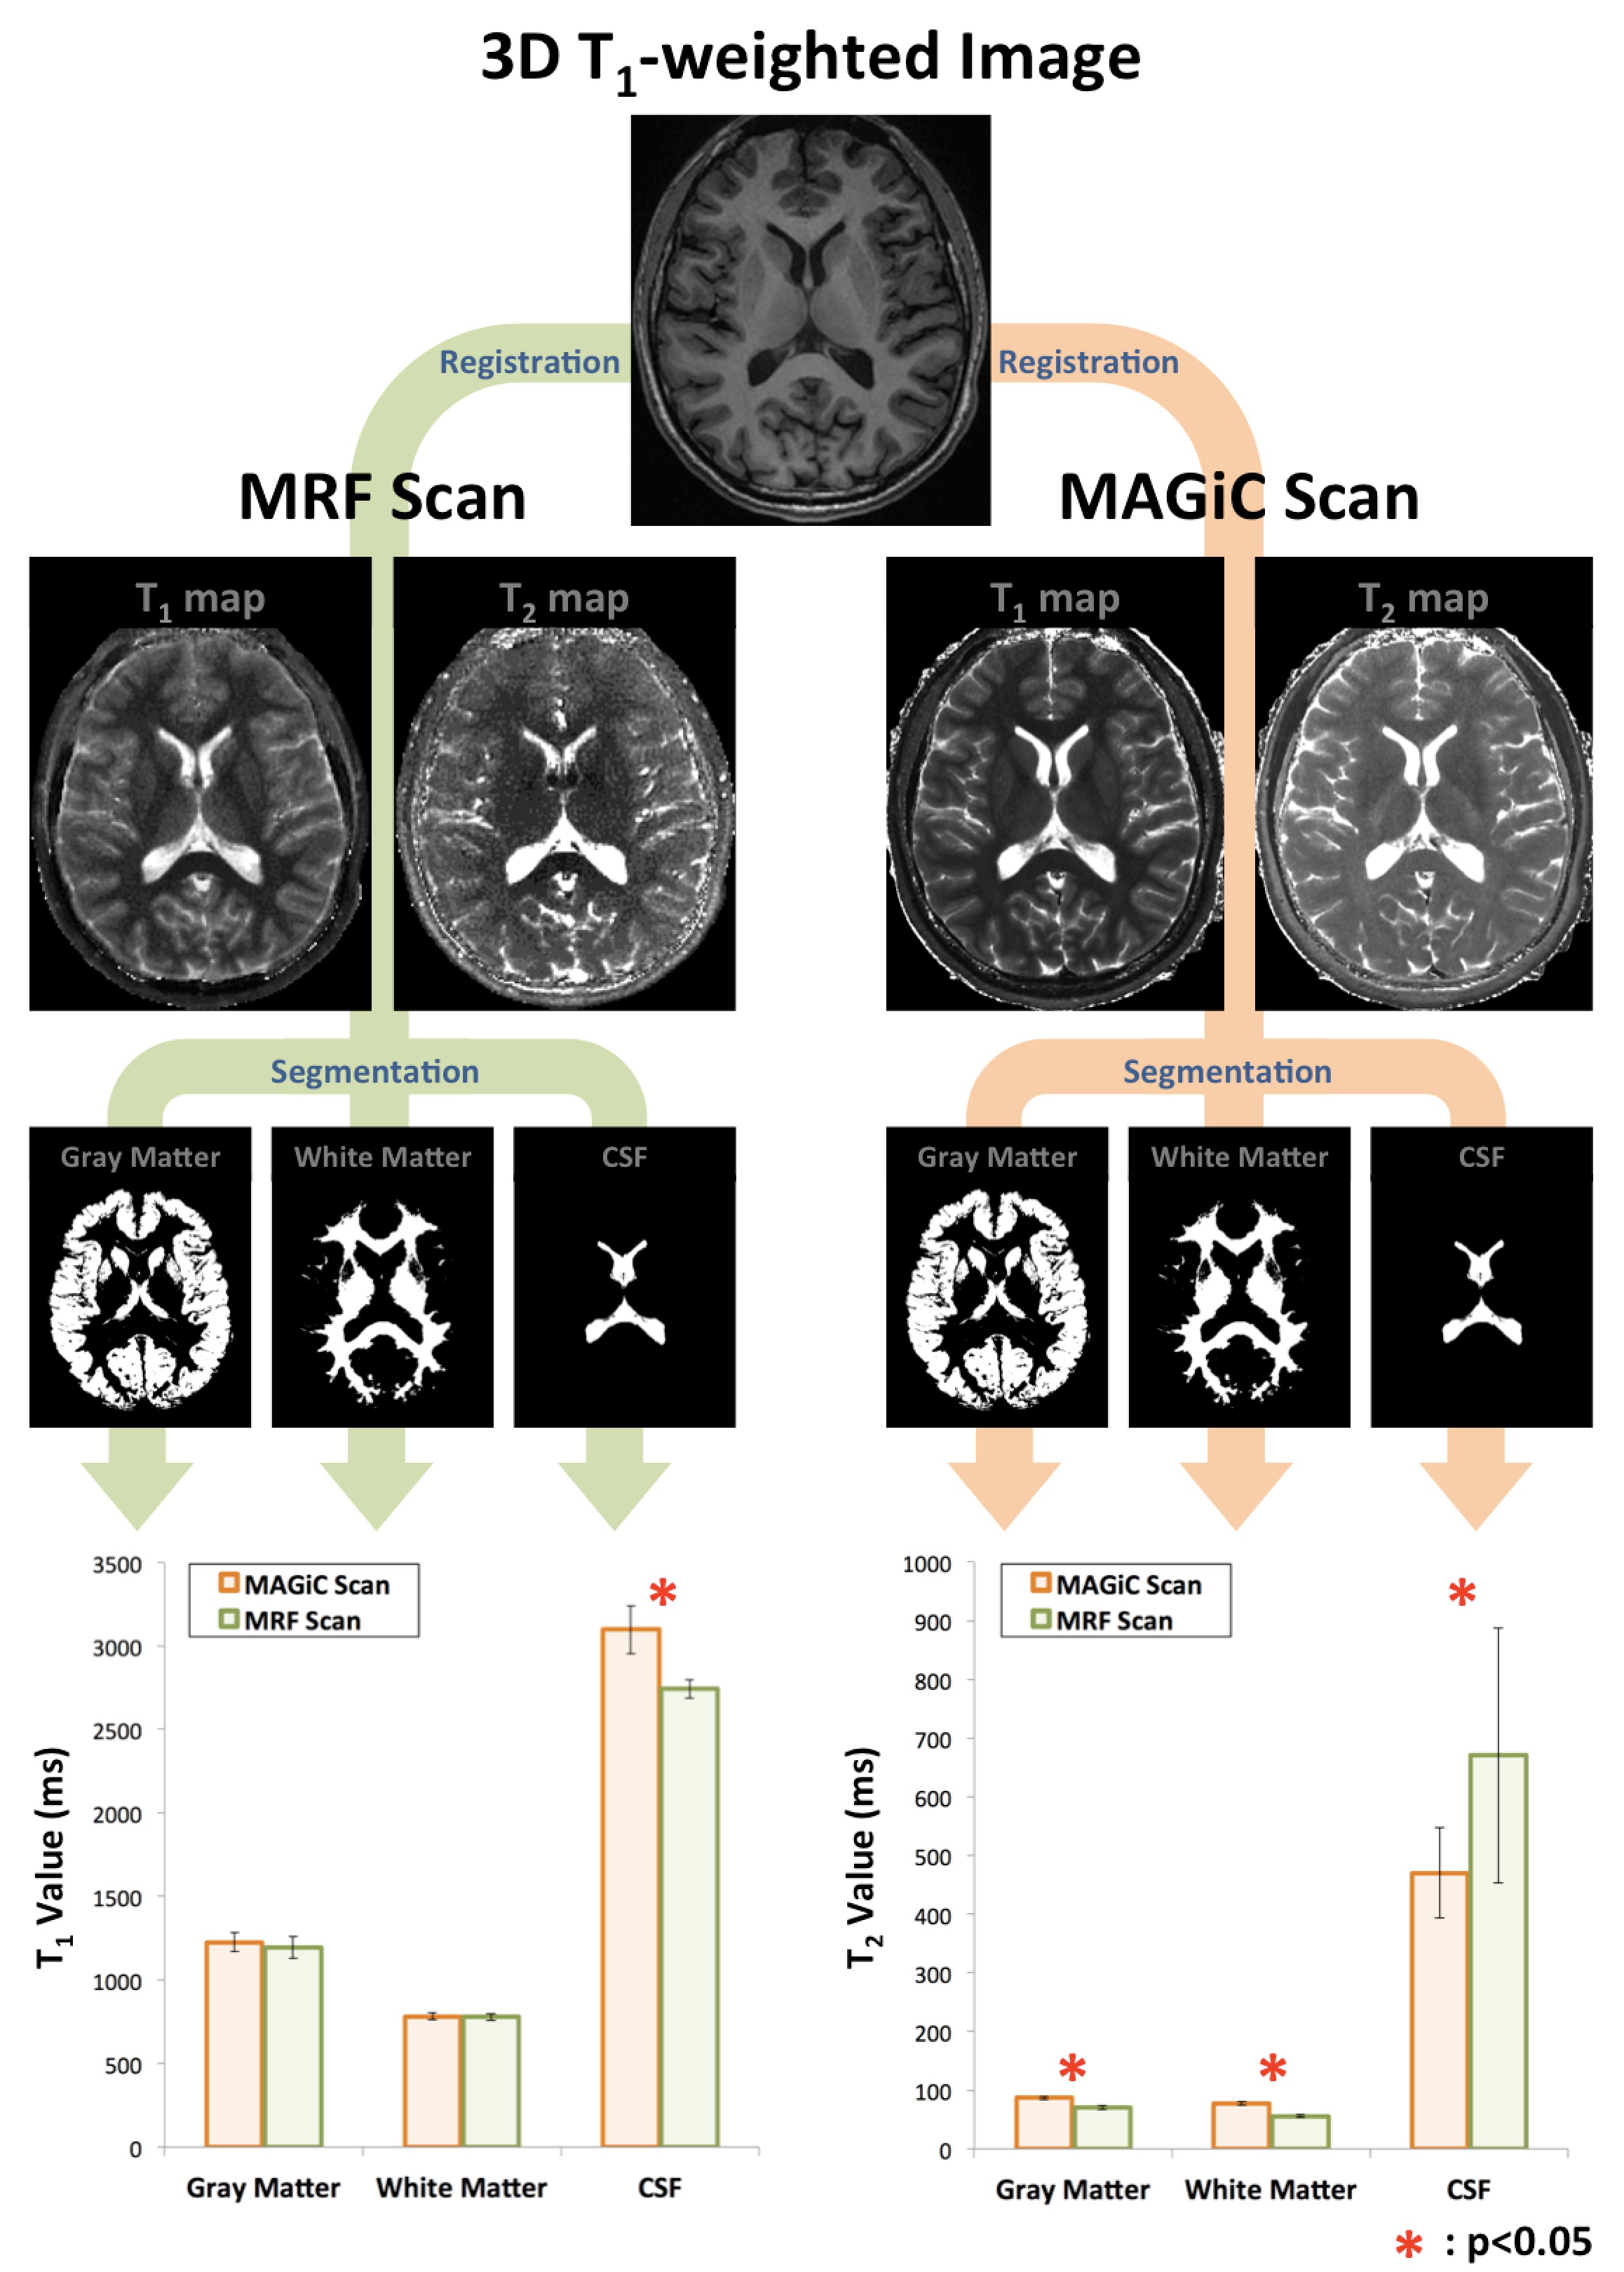
Eight participants (3 females; mean age, 29 years) were enrolled in this study. Data were acquired using a 3T MRI scanner (Discovery MR750w; GE Healthcare, Milwaukee, USA) using a geometry-embracing method (GEM) head-and-neck unit for signal detection and a whole-body coil for radio-frequency excitation. MAGiC was acquired using a 2D fast-spin echo based multi-saturation-delay multi-echo. Steady-state free precession (SSFP) was employed for MRF acquisition5,6 and its acquisition trajectories used 89 undersampled golden-angle spiral interleaves with sampling bandwidth = ±250kHz, TR = 9ms, TE = 2.2ms, NEX=1, and 979 frames. The scan flip angle list from Jiang et al5. B0 and B1 were not included in the dictionary but slice profile was included to improve T2 accuracy. Other imaging parameters used in MAGiC and MRF scans were: 22 mm x 22 mm FOV, 256 x 256 matrix size, 5-mm slice thickness with 1-mm gap, and 24 slices per scan. The scanning time of MAGiC and MRF scans was all 4 minutes. Another 1-mm isotropic 3D fast-spoiled gradient-echo (FSPGR) T1-weighted scan (TR/TE = 8.62/3.25 ms) was acquired for tissue segmentation. In preprocessing, the 3D FSPGR was registered into the spatial orientation of MAGiC and MRF scans, respectively. Next, the spatial segmentation was applied in the registered images for extraction of white matter (WM), gray matter (GM), and cerebrospinal fluid (CSF).RESULTS
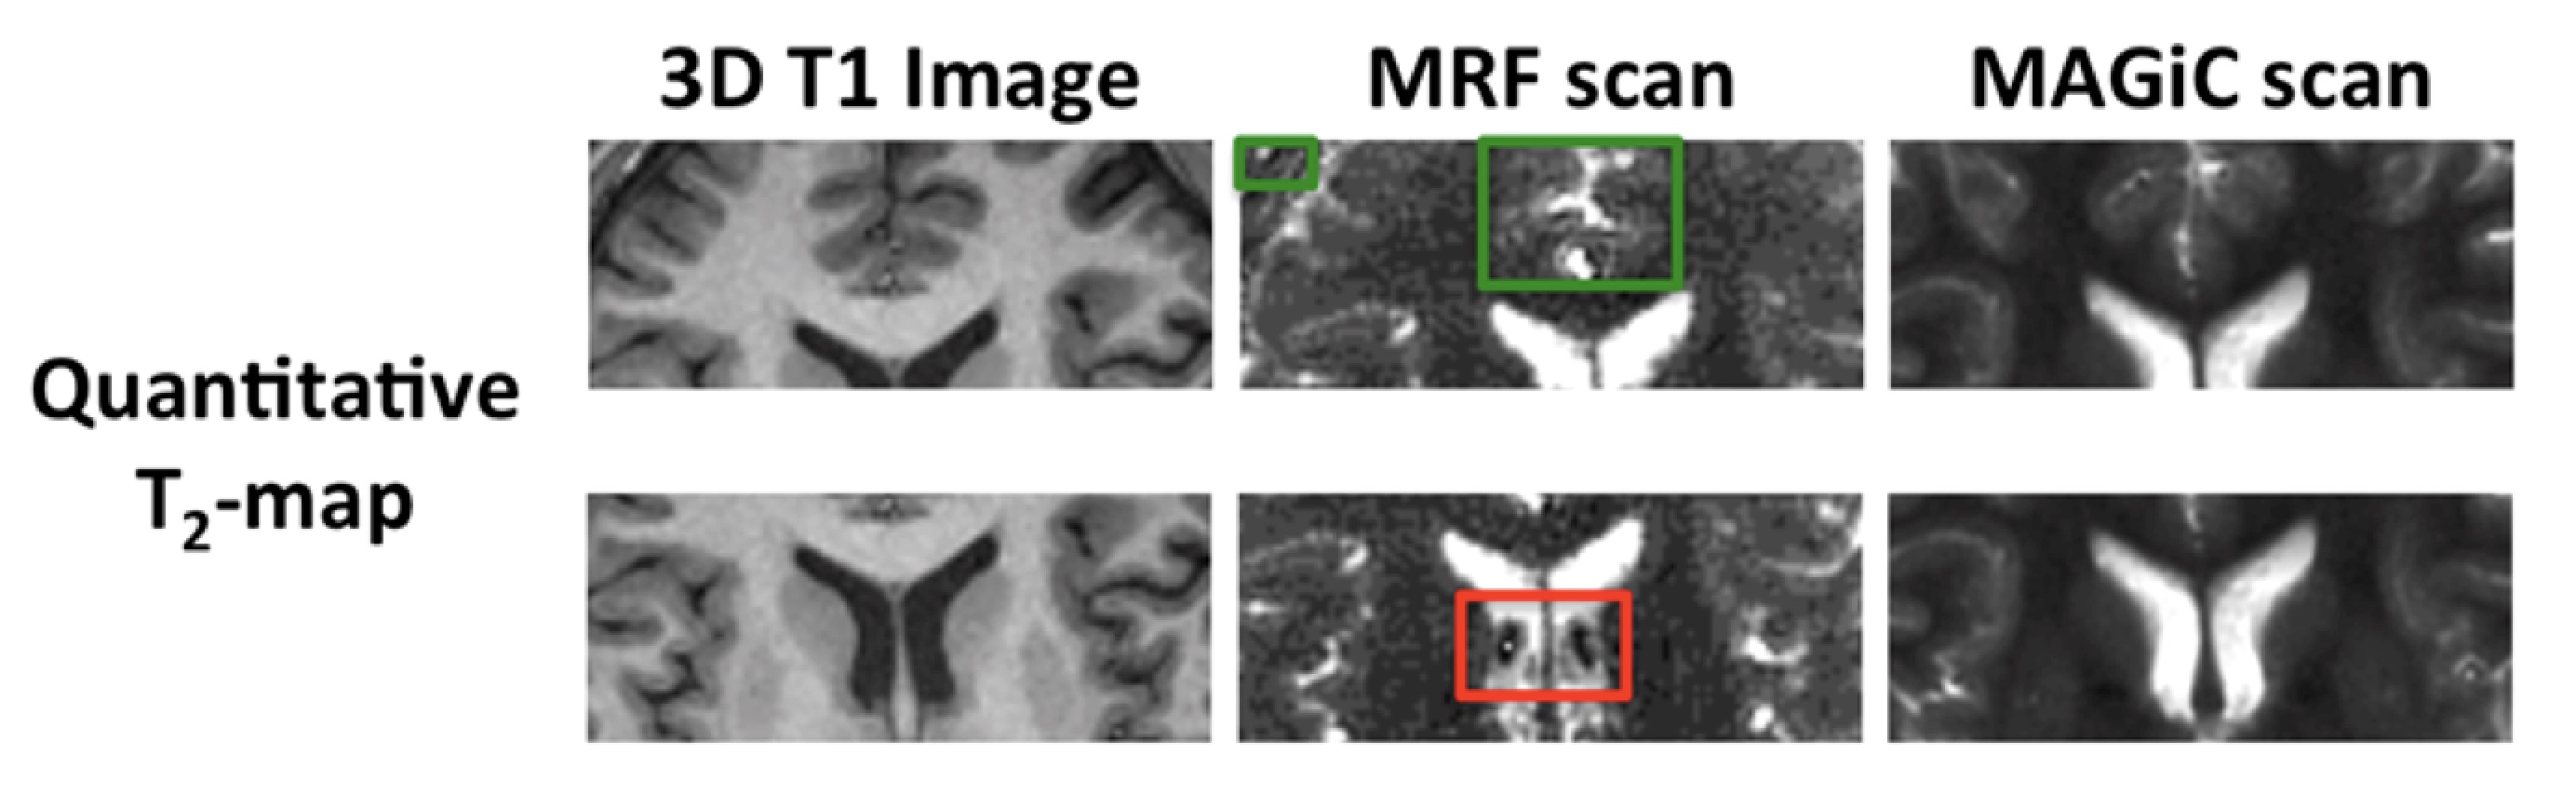
Both T1 and T2 value in brain tissues generated by MRF was similar with previous report . Comparing T1 value, no significance was found between 2 techniques in WM and GM; on the contrary, significant differences were observed in the CSF regions (MAGiC: 3098 ms; MRF: 2743 ms) (Figure 1). Significant differences of T2 value were demonstrated among three brain tissues (MAGiC in GM/WM/CSF: 87/77/471 ms; MRF in GM/WM/CSF: 74/57/695 ms), though they are all at normal range7. Moreover, the T2-value by MRF showed the influence by in-plane flow (Figure 2, upper), and some value-loss in the CSF regions (Figure 2, lower); besides, the T2 value of CSF regions generated by two techniques was much lower than the real value.7DISCUSSION and CONCLUSION
In this study, we compared the quantitative values from these two techniques in brain tissues of GM, WM, and CSF in healthy volunteers. T2 value showed significant difference between two techniques. With SSFP MRF, the inversion pulse applied before the readout train, as well as variable flip angles, all contribute to impart T1 weighting, which results in a robust T1 quantification. On the other hand, the stimulated echoes within the used SSFP MRF acquisitions were less efficient at encoding T2. In addition, flow compensation was not considered in signal model of MRF. The MRF derived T2-value showed the influence by in-plane flow, and presented some value-loss in the CSF regions. MAGiC and MRF are powerful techniques to provide multiple contrast images within a single acquisition, but the limit of inaccurate quantitative T2 values in CSF regions could raise the concern in clinical diagnosis.Acknowledgements
No acknowledgement found.References
1. Shah B, et al. (2011) Quantitative MR Imaging: Physical Principles and Sequence Design in Abdominal Imaging. Radiographics. 31:867-875.
2. Lescher et al. (2015). Quantitative T1 and T2 mapping in recurrent glioblastomas under bevacizumab: earlier detection of tumor progression compared to conventional MRI. Neuroradiology. 57:11-20.
3. Tanenbaum, L.N. et al. (2017). Synthetic MRI for clinical neuroimaging: results of the magnetic resonance image compilation (MAGiC) prospective, multicenter, multireader trial. AJNR Am J Neuroradiol. 38(6):1103-1110.
4. Ma, D. et al. (2013). Magnetic resonance fingerprinting. Nature. 495(7440):187-92.
5. Jiang Y et al. (2015) MR fingerprinting using fast imaging with steady state precession (FISP) with spiral readout. Magn Reson Med 74:1621–1631
6. Buonincontri et al. (2018). Repeatability of 2D FISP MR Fingerprinting in the Brain at 1.5T and 3.0 T. ISMRM, #682.
7. Thangavel, K. and Saritas, U.E. (2017). Aqueous paramagnetic solutions for MRI phantoms at 3 T: a detailed study on relaxivities. Turk J Elec Eng Comp Sci. 25:2108-2121.
Figures