3659
Accuracy of Synthetic MAgnetic Resonance image Compilation (MAGiC) neural scan1Department of Radiology, Wan Fang Hospital, Taipei Medical University, Taipei, Taiwan, 2GE Healthcare, Taipei, Taiwan, 3Department of Radiology, School of Medicine, College of Medicine, Taipei Medical University, Taipei, Taiwan
Synopsis
This study aimed to verify the accuracy of quantitative T1 and T2 estimation generated from a synthetic MR imaging method, MAGiC by comparing these results with conventional scanning on a homemade phantom with 9 concentration of aqueous CuSO4, and our result showed that the quantitative estimations were inaccurate in the CSF regions. In addition, the MAGiC synthetic image contrast was evaluated in both healthy volunteers and stroke patients. Agreed with the quantitative estimations, the CSF regions caused the apparent contrast differences.
INTRODUCTION
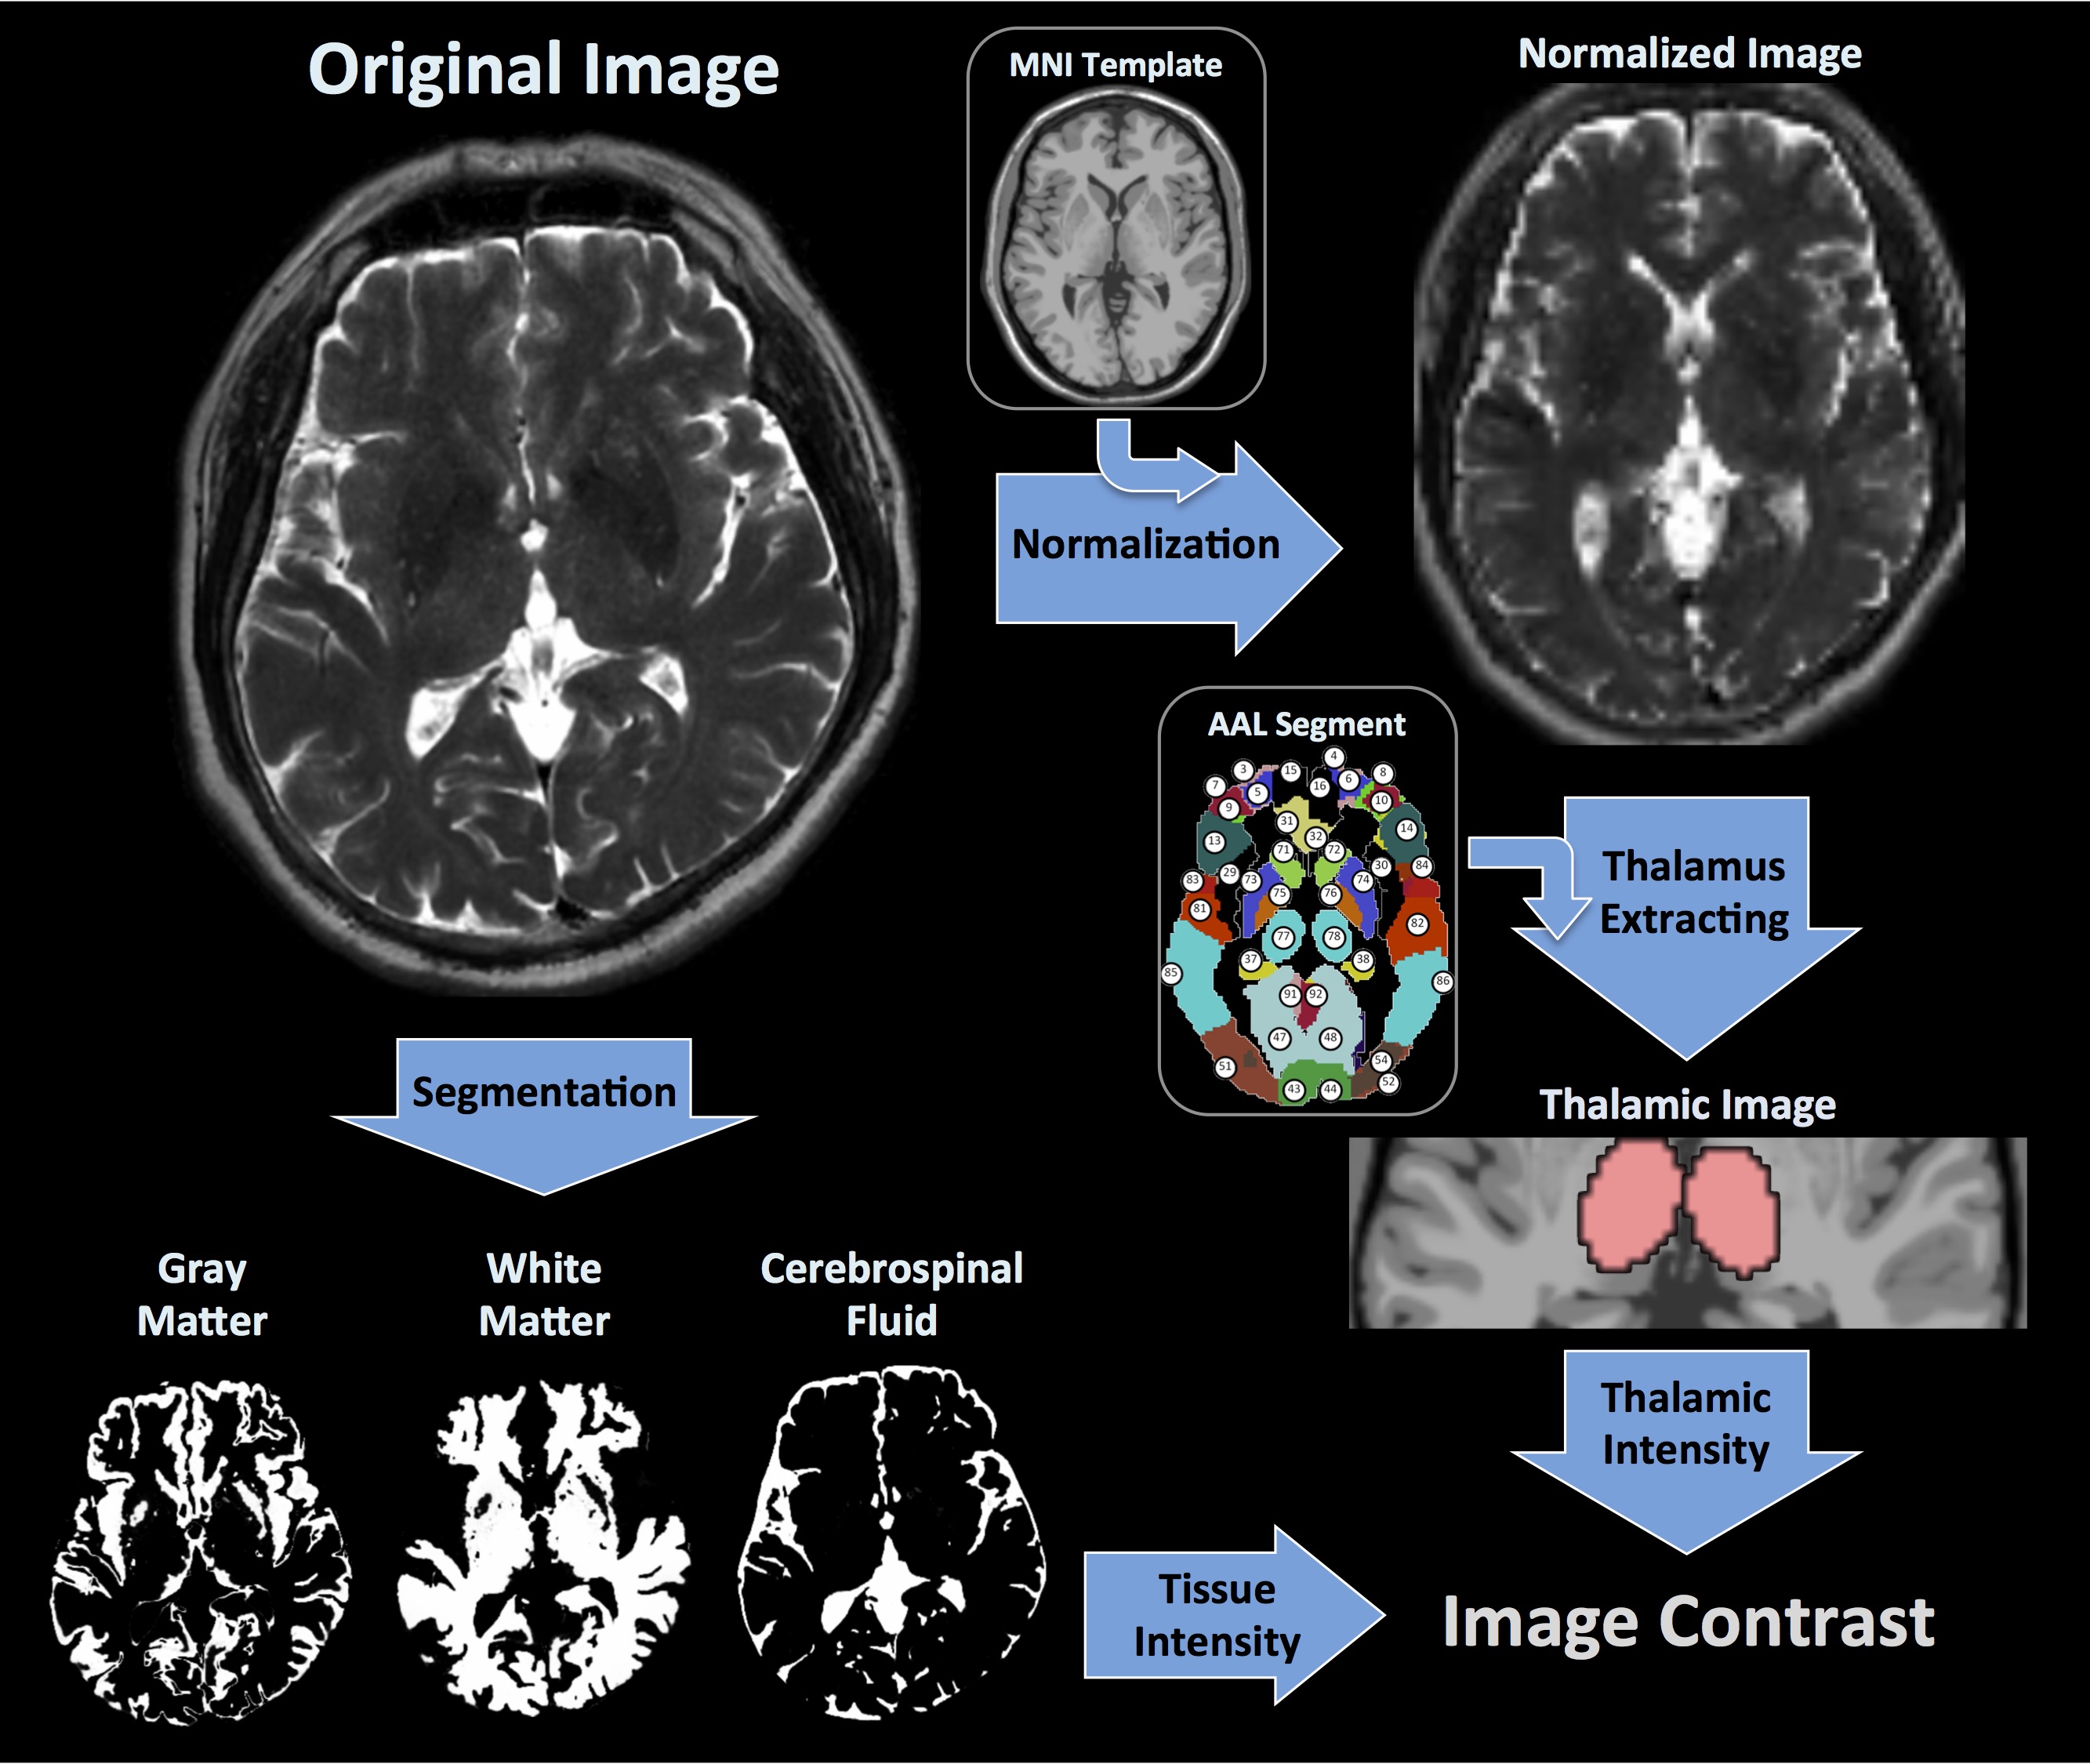
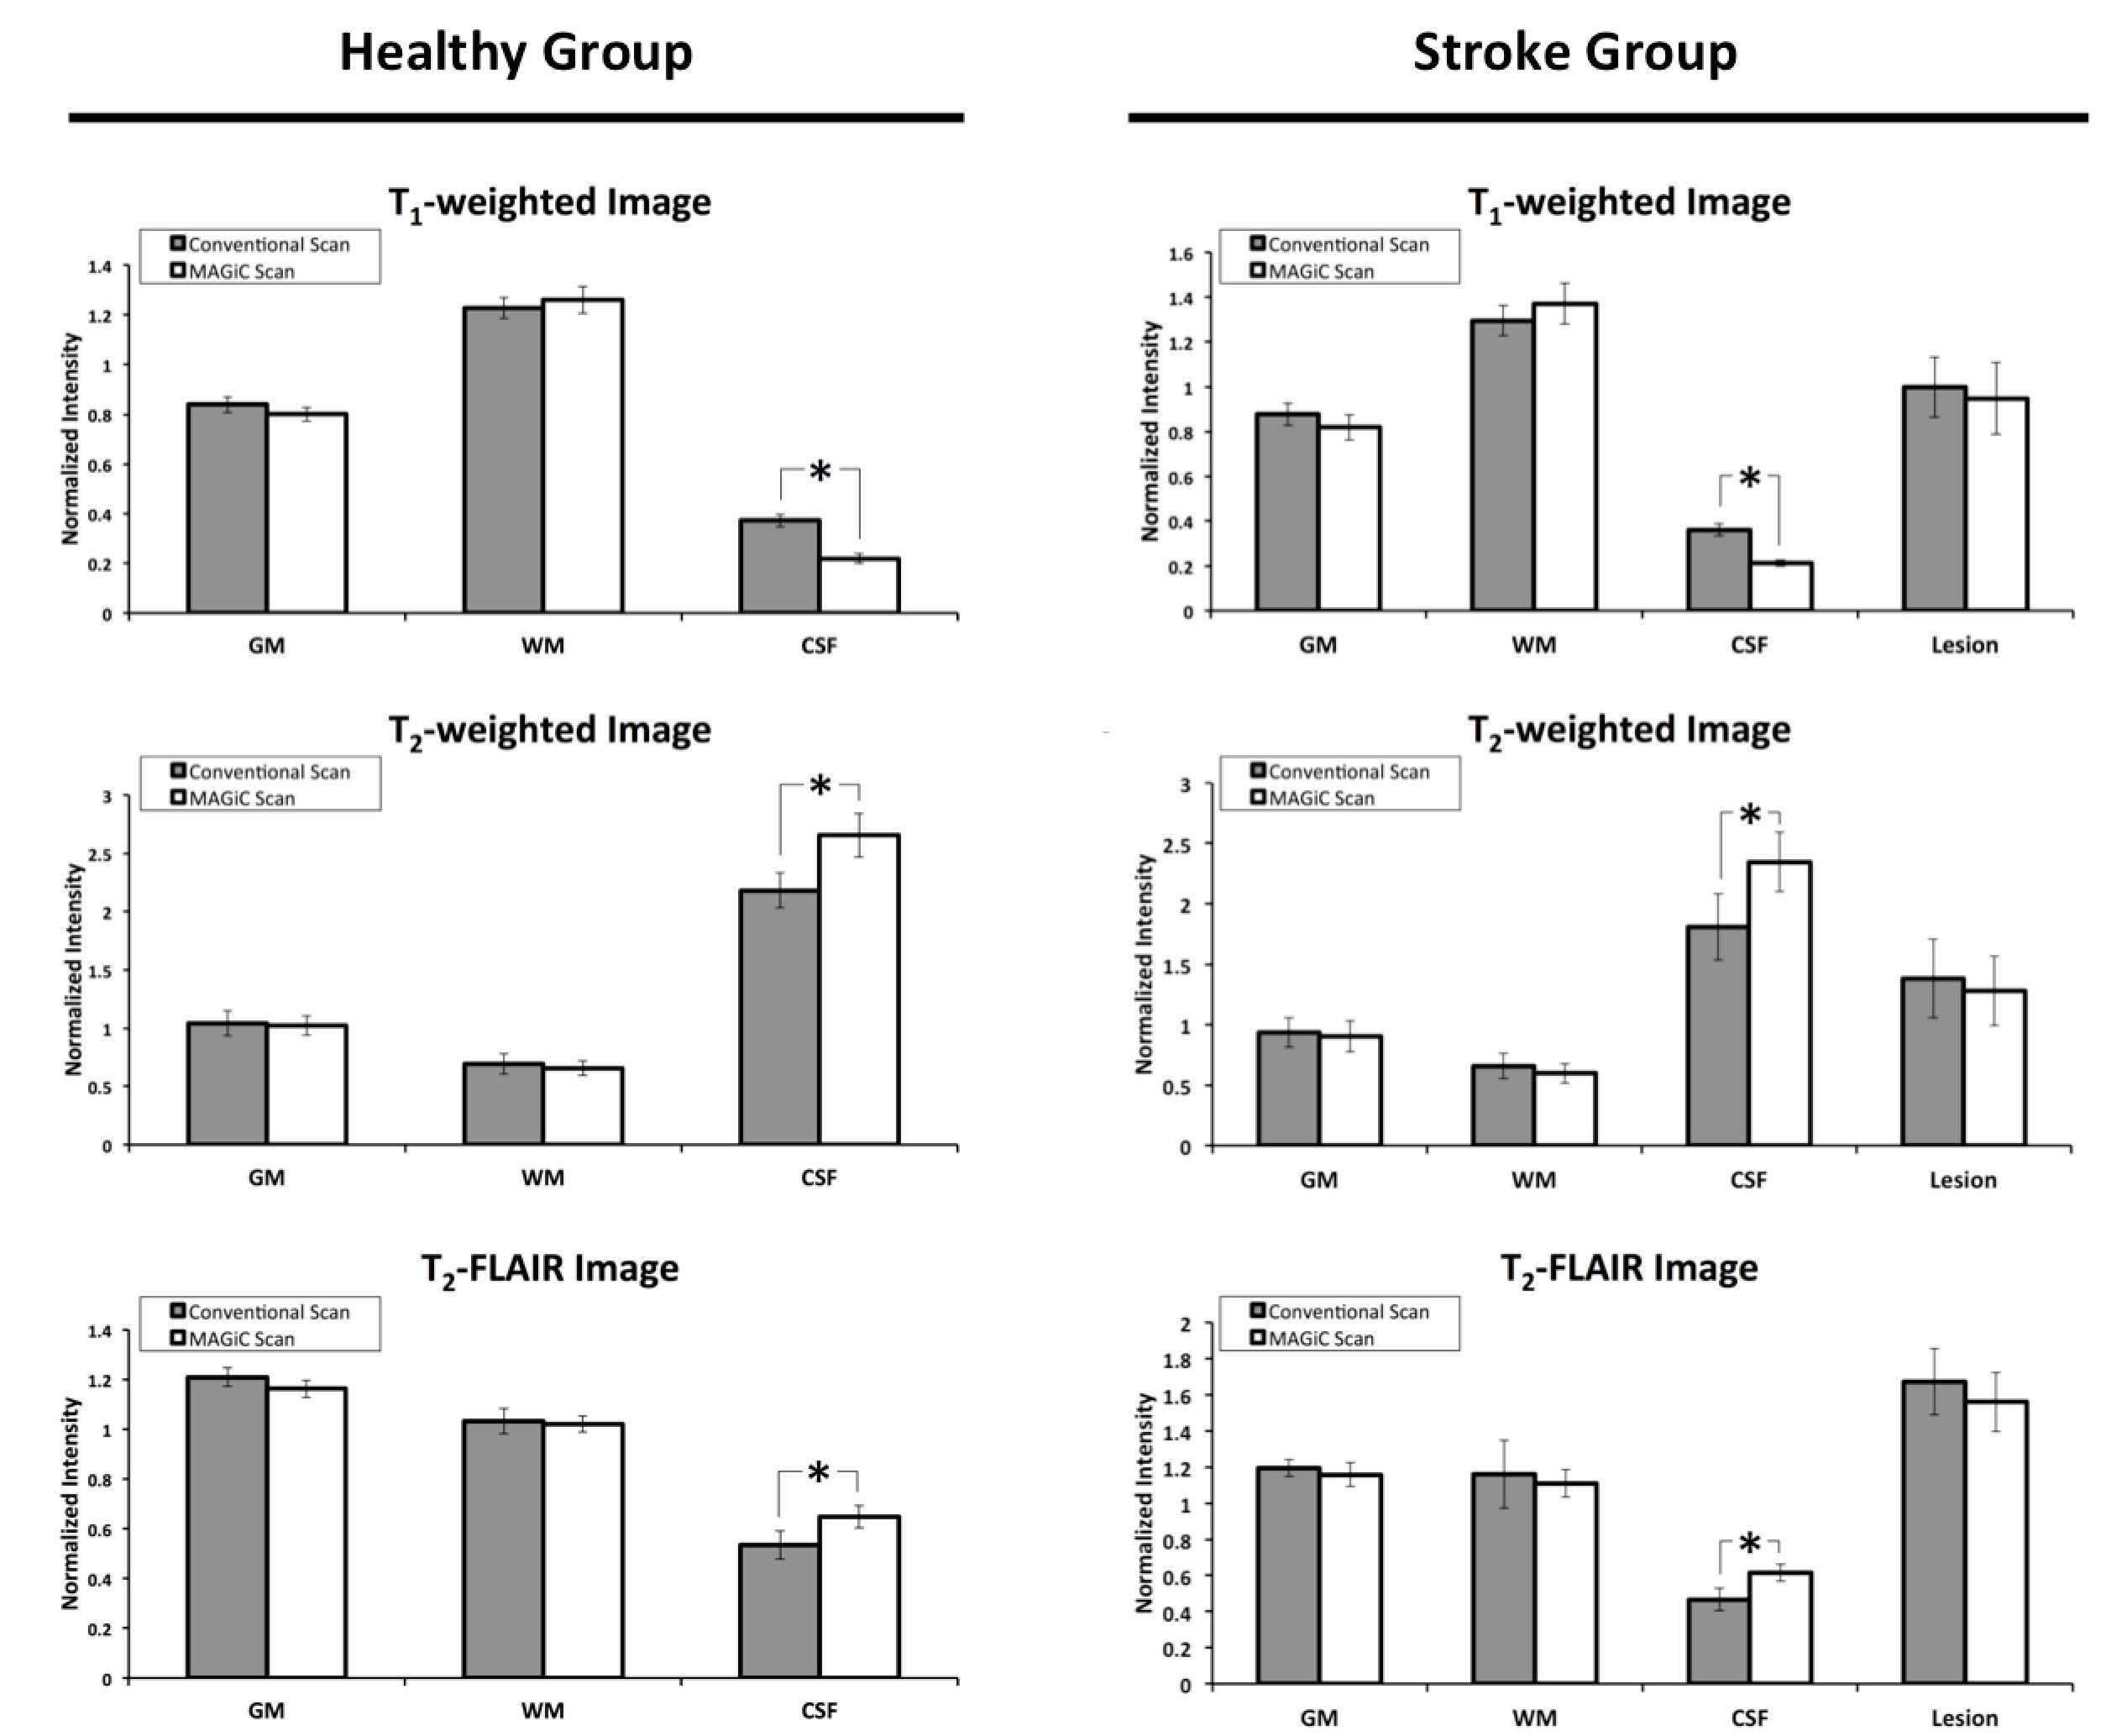
Synthetic MAgnetic Resonance image Compilation (MAGiC) is a magnetic resonance (MR) imaging technology that allows the reconstruction of multiple images contrasts within a single imaging acquisition.1-6 Previous literature7 had shown similar legibility and quality of subjective diagnosis scores between images acquired by conventional scans and those by the MAGiC scans. However, differences in contrast levels were apparently, particularly in images applied a fluid-attenuated inversion recovery sequence, which might result from inaccurate quantitative relaxation times using the MAGiC technique. To validate the quantitative T1 and T2 values using MAGiC against the conventional acquisition, we designed a homemade phantom filled with nine concentrations of aqueous CuSO4. In addition to the phantom validation, quantitative comparisons on image contrast between MAGiC and conventional scans were performed on 20 healthy participants and 18 stroke patients. All images in 2 groups were segmented into regions of gray matter, white matter, and CSF. To acquire accurate image contrast across subjects, the image intensity of 3 regions were divided by mean signal intensity of the bilateral thalamus.METHODS
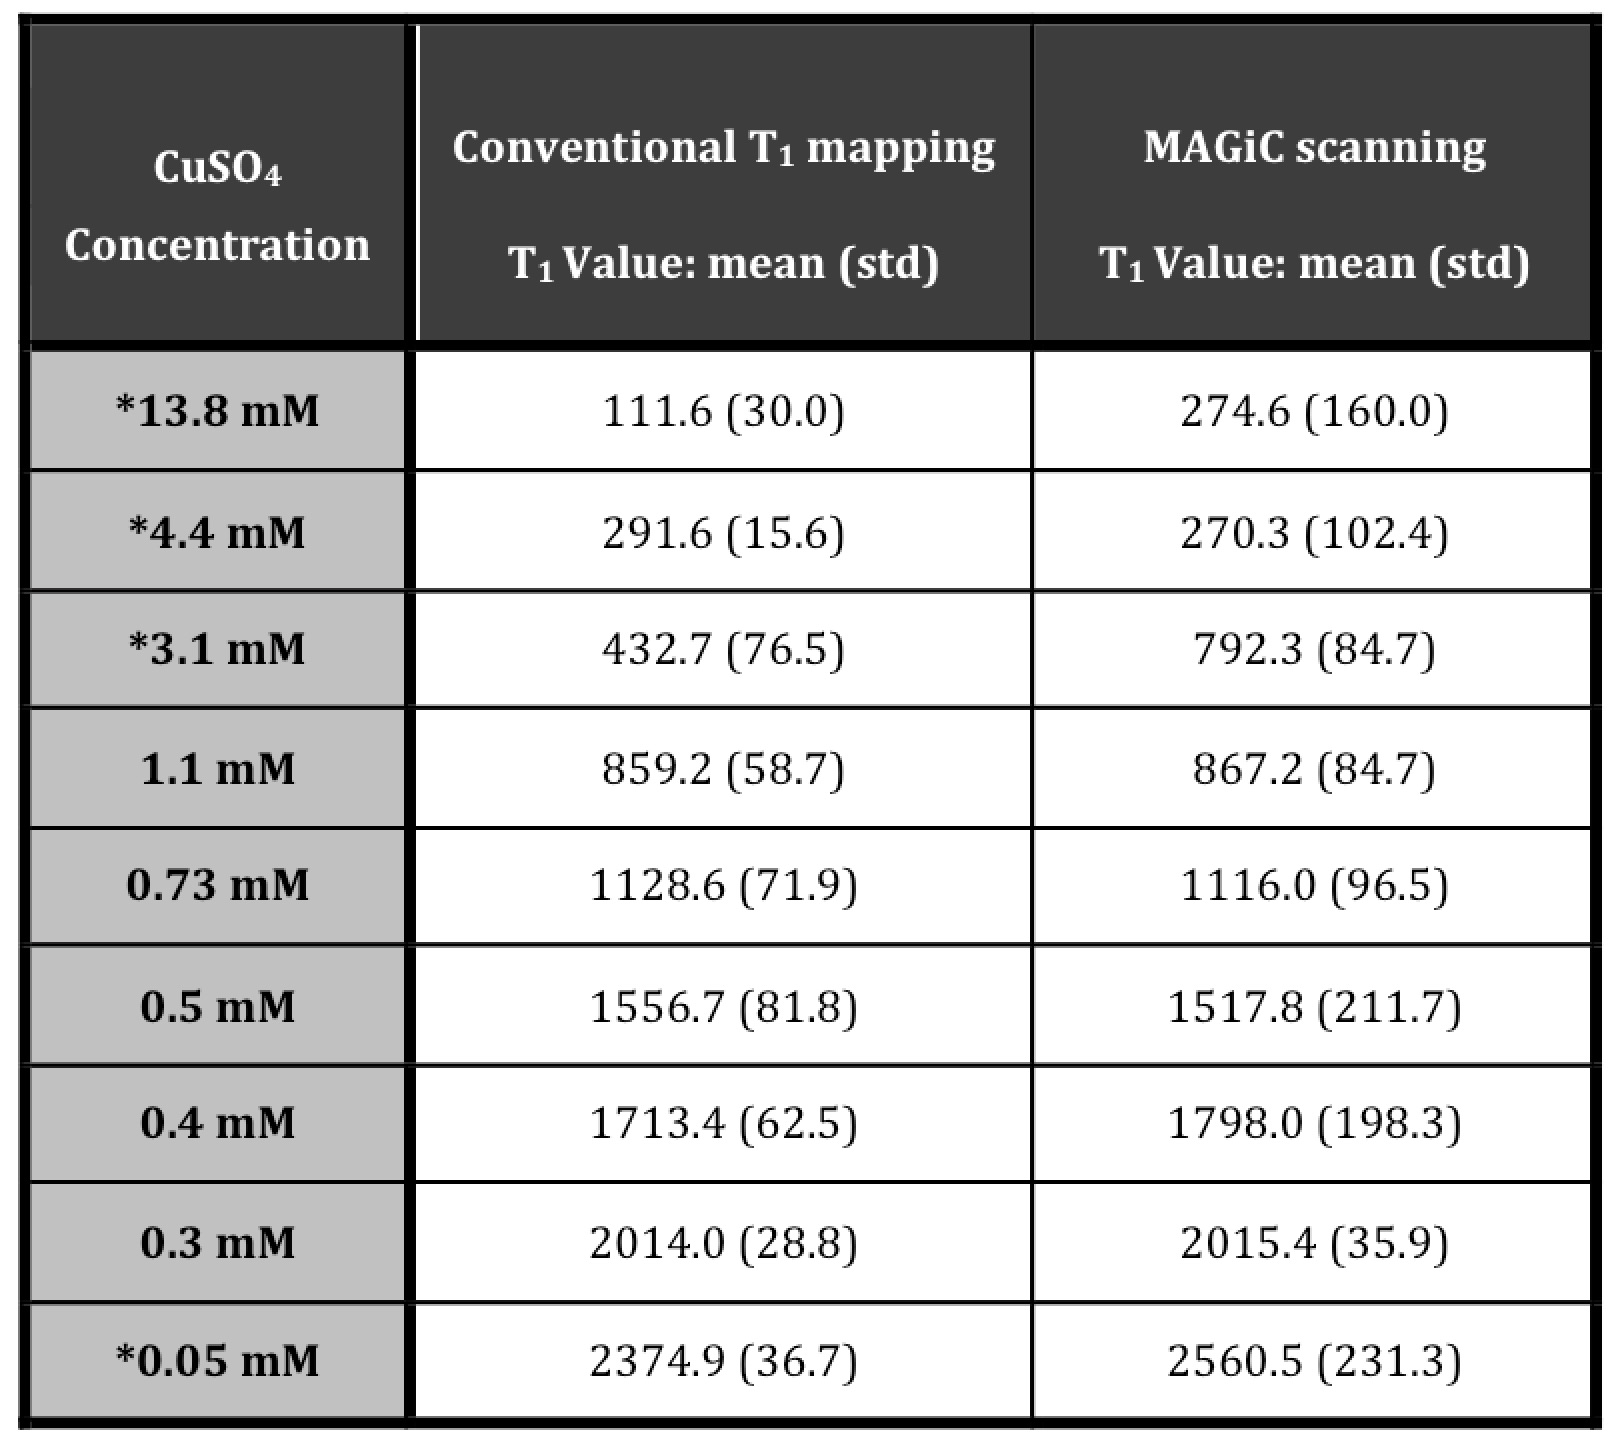
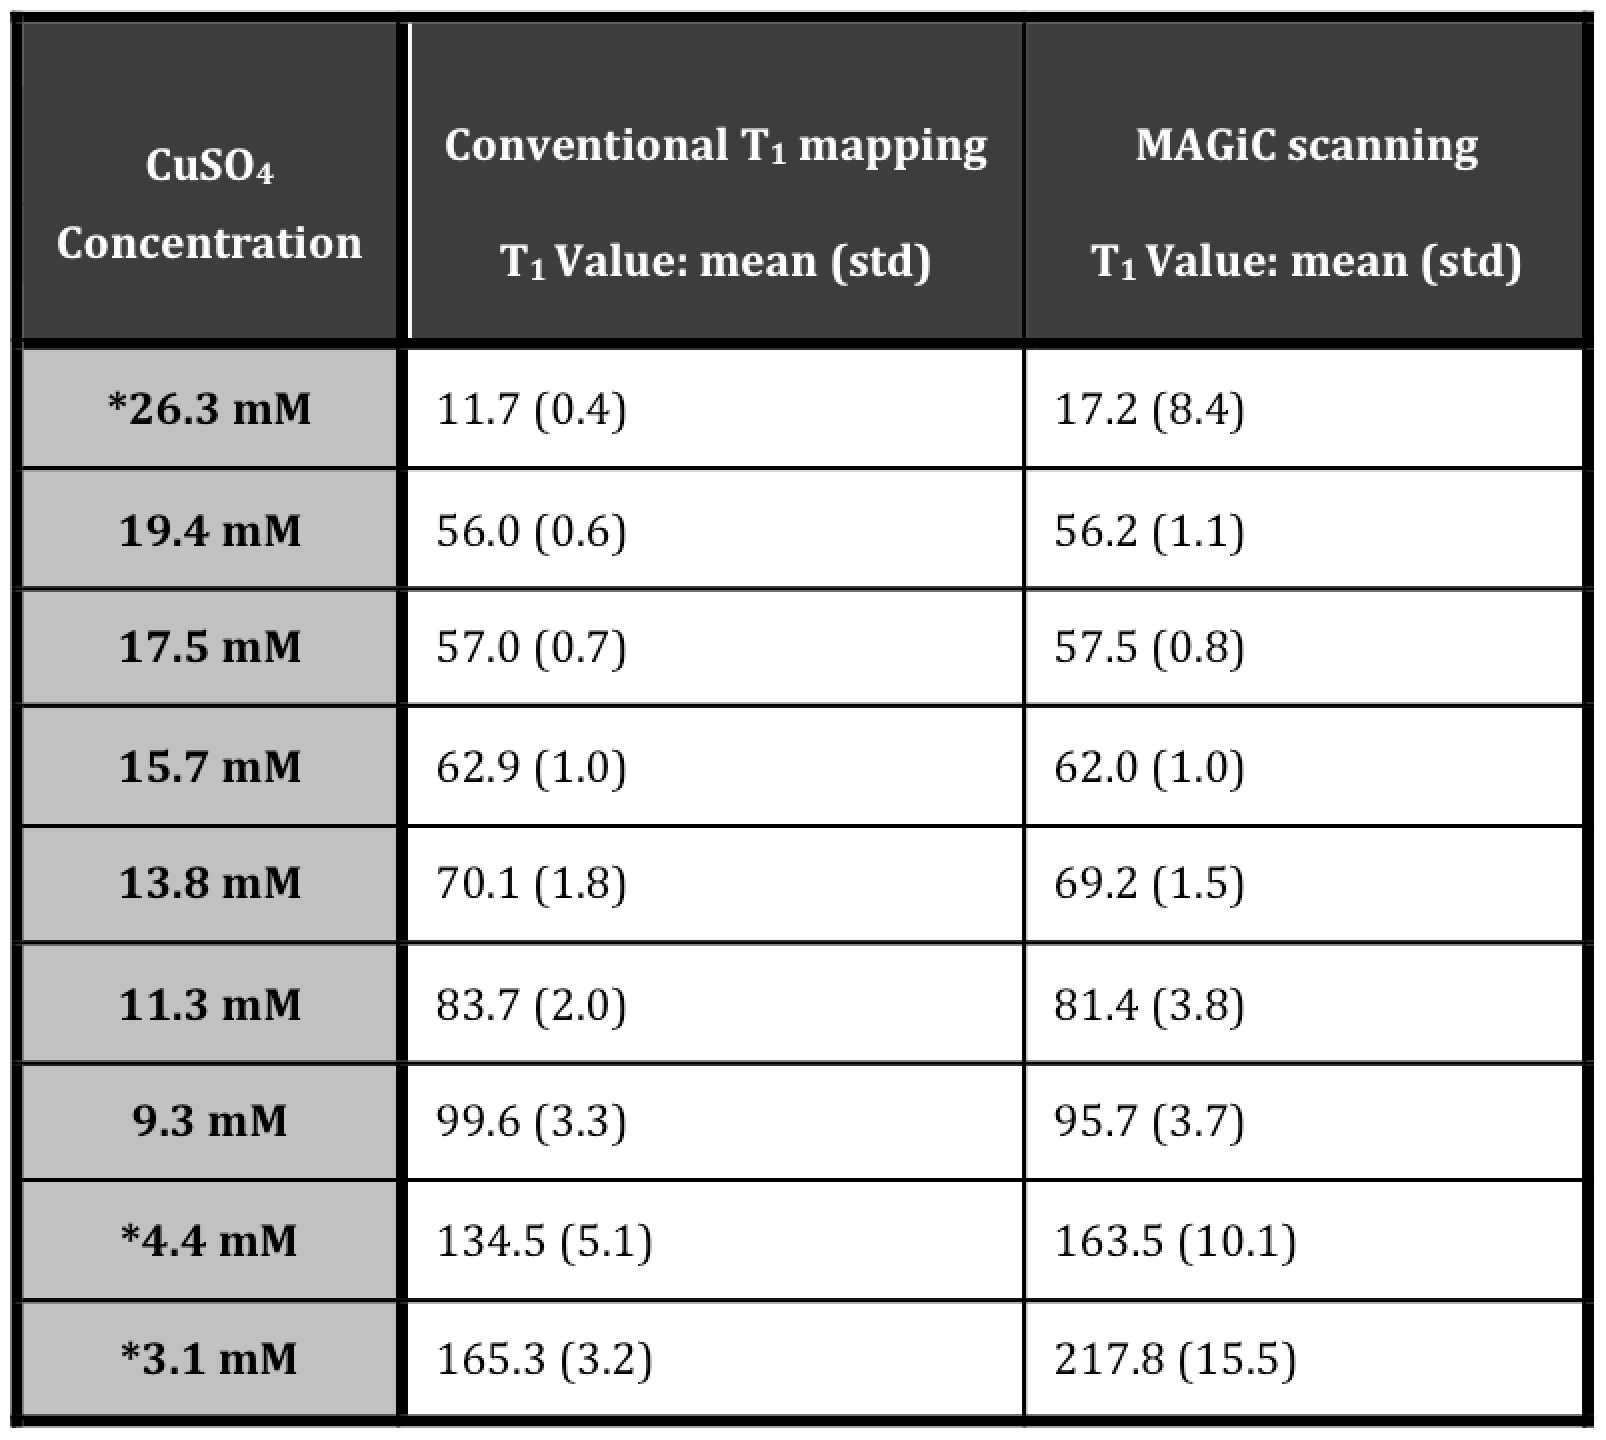
The phantom was made from 9 specific concentration of aqueous CuSO48-9 whose T1 and T2 values are ranging from 100 to 2300 ms and 10 to 260 ms, respectively. We conducted all of the experiments using the MAGiC and fast spin-echo (for T1- and T2- mapping) sequences on the 3T MR scanner (MR 750w, GE Healthcare, Milwaukee, USA) with a 24-channel array head coil as signal detection. For human data (20 healthy controls and 18 stroke patients), the MAGiC images were acquired using a fixed set of scanning parameters that closely approximated to standard stroke MRI protocol10; conventional images were acquired using 2D FSE-IR T1-w (TR/TE/TI = 1800/23/750 ms), 2D FSE T2-w (TR/TE = 4545/110 ms), and T2 FLAIR imaging (TR/TE/TI = 9000/92/2472 ms). Additionally, one EPI-based DWI (TR/TE = 6000/77 ms) was acquired with a b-value of 1000 s/mm² to detect the stroke lesion location in the stroke patients. In terms of sequence order, the MAGiC scans were performed in the last.RESULTS and DISCUSSION
In phantom validation, significant differences were found on phantom with a high T1 (0.05 mM CuSO4 as 2375 ms of T1 value) and T2 (<4.4 mM CuSO4 as >135 ms of T2 value) values, showing that the MAGiC scanning resulted in inaccurate synthetic image intensity of the cerbrospinal fluid (CSF). On human data, significant differences in synthetic image contrast were found in the CSF regions in all images. For patients with stroke lesions, no significant differences were detected between MAGiC and conventional scans.CONCLUSION
While the power of MAGiC scanning has been demonstrated in clinical practice, differences in FLAIR contrast levels are apparent. In this study, we used a homemade phantom with nine concentrations of aqueous CuSO4 to verify the limit of accurate estimation on T1 and T2 measurements using MAGiC sequence. Even though the quantitative estimations were inaccurate in the CSF regions and then caused the apparent contrast differences, it would not affect the diagnosis of stroke lesion. Our result could benefit to the improvement for MAGiC technique.Acknowledgements
No acknowledgement found.References
1. Riederer S, Suddarth S, Bobman S. Automated MR image synthesis: feasibility studies. Radiology 1984;153:203-206.
2. Warntjes J, Dahlqvist O, Lundberg P. Novel method for rapid, simultaneous T1, T2*, and proton density quantification. Magn Reson Med 2007;57:528-537.
3. Krauss W, Gunnarsson M, Andersson T, Thunberg P. Accuracy and reproducibility of a quantitative magnetic resonance imaging method for concurrent measurements of tissue relaxation times and proton density. Magn Reson Imaging 2015;33:584-591.
4. Warntjes J, Leinhard O, West J, Lundberg P. Rapid magnetic resonance quantification on the brain: optimization for clinical usage. Magn Reson Med 2008;60:320-329.
5. Blystad I, Warntjes J, Smedby O, Landtblom AM, Lundberg P, Larsson EM. Synthetic MRI of the brain in a clinical setting. Acta Radiol 2012;53:1158-1163.
6. Granberg T, Uppman M, Hashim, Cananau C, Nordin LE, Shams S, Berglund J, Forslin Y, Aspelin P, Fredrikson S, Kristoffersen-Wiberg M. Clinical feasibility of synthetic MRI in multiple sclerosis: a diagnostic and volumetric validation study. AJNR Am J Neuroradiol 2016;37:1023-1029.
7. Tanenbaum et al., Synthetic MRI for clinical neuroimaging: results of the magnetic resonance image compilation (MAGiC) prospective, multicenter, multireader trial, AJNR Am J Neuroradiol. 2017 Jun;38(6):1103-1110.
8. Thangavel K, Saritaş EÜ. Aqueous paramagnetic solutions for MRI phantoms at 3 T: A detailed study on relaxivities. Turk J Elec Eng & Comp Sci 2017;25:2108-2121.
9. Barral JK, Gudmundson E, Stikov N, Amoli ME, Stoica P, Nishimura D. A robust methodology for in vivo T1 mapping. Magn Reson Med 2010;64:1057-1067.
10. Schellinger PD, Jansen O, Fiebach JB, Hacke W, Sartor K. A standardized MRI stroke protocol: comparison with CT in hyperacute intracerebral hemorrhage. Stroke 1999;30:765-768.
Figures