3655
Validation of Diffusion Imaging Measures in Gray Matter using Histology from macaque monkey1Graduate Program for Neuroscience, Boston University, Boston, MA, United States, 2Psychiatry NeuroImaging Lab, HMS, BWH, Boston, MA, United States, 3Harvard Center for Biological Imaging, Harvard University, Cambridge, MA, United States, 4Center for Morphometric Analysis, Massachusetts General Hospital, Charlestown, MA, United States, 5Martinos Center for Biomedical Imaging, Massachusetts General Hospital, Charlestown, MA, United States, 6Anatomy and Neurobiology, Boston University School of Medicine, Boston, MA, United States
Synopsis
This study is the first attempt towards histological validation of diffusion imaging measure of Trace in the gray matter of macaque monkey. Heterogeneity of Trace (hTrace) computed for one monkey in 7 cytoarchitectonically different regions was compared with the variance in intracellular volume fraction for the same regions computed using digitized histological sections, stained for all cell bodies. hTrace was found to be significantly correlated with the variance in intracellular volume fraction. This shows that the diffusion measure of hTrace is sensitive to the underlying gray matter cytoarchitecture such as the cell size and cell packing density.
Introduction
Diffusion Tensor Imaging (DTI) measures the movement of water molecules within each image voxel, affected directly by the underlying biology. However, since DTI measures are only indirect putative measures of cellular level features, it is essential to validate the biological basis of these measures. Previous studies have validated DTI measures mainly in white matter1,2,3 and only a few studies have validated DTI measures in gray matter (GM)4,5. DTI validation studies in GM4 have mainly used induced lesions as a way of validation. But the question of how the fundamental GM structure such as cell size, cell packing density, spatial arrangement and geometry of cell bodies influences DTI measures in healthy subjects/animals still remains unclear. Trace is a commonly used measure of average diffusion in the tissue. We therefore start by first exploring different biological factors that could contribute to Trace in GM. Regional Trace is average Trace (avgTrace) for all voxels in a defines region of interest (ROI). Heterogeneity of Trace (hTrace) measures the inter-voxel regional variance in Trace, and is shown to be more sensitive to changes in GM architecture compared to regional avgTrace6. In this study, we hypothesize that regional hTrace will be influenced by variance in cell area density in histology.Methods
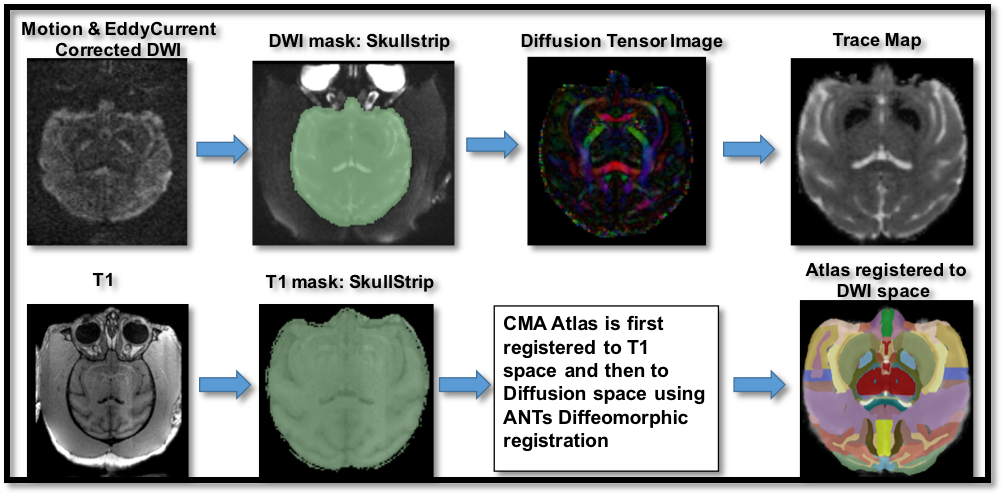
MRI scans of one male monkey of age 20 years were acquired in-vivo, on a Siemens 3T scanner: T1-scans: resolution = 0.6x0.6x0.59 mm3. Three repetitions of diffusion scans were acquired with: resolution = 0.8x0.8x0.8 mm3, 60 directions for b=1000,2000,3000 s/mm2 each. MRI scans were preprocessed using the standard pipeline (Figure 1). Diffusion tensor models were constructed using Slicer software7 separately for b=2000 and 3000 s/mm2, followed by computing two Trace maps. To compute hTrace and avgTrace for 7 cytoarchitecturally different regions of interest (ROIs) we used a macaque brain atlas with cortical and subcortical GM parcellations8,9. avgTrace and hTrace are defined6 as $$avgTrace=\frac{1}{N}\ast\sum_{i=1}^{N}Trace_{i},\ hTrace=\frac{1}{N^{2}}\sum_{i=1}^{N}\sum_{j=1}^{N}\left \| Trace_{i} -Trace_{j}\right\|$$, where N is the number of voxels in the ROI and the Trace in a voxel is indexed by i or j.
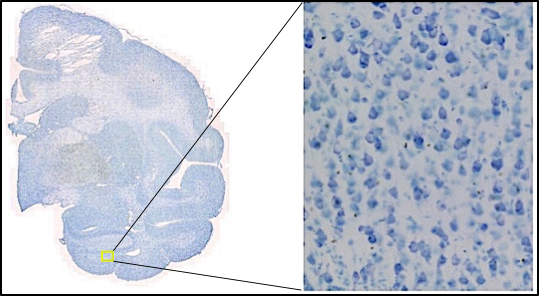
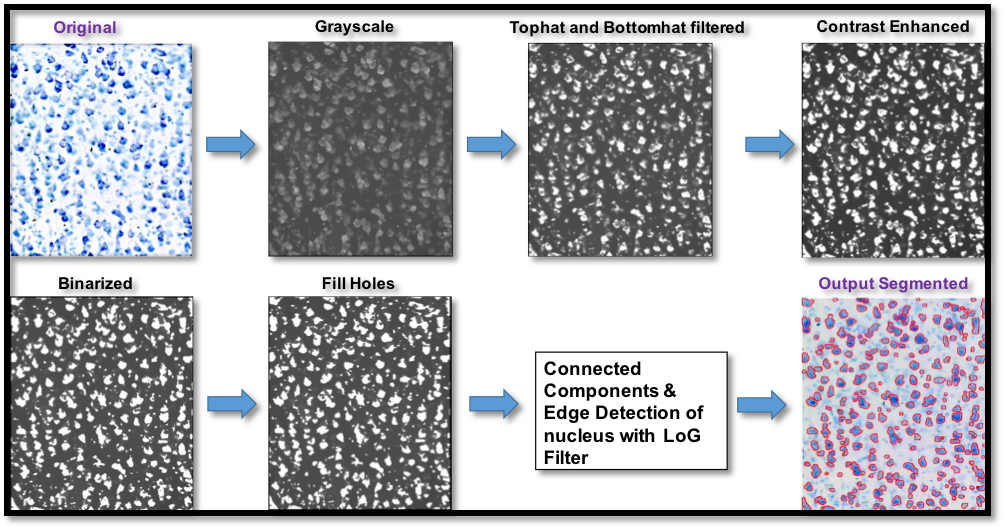
Brain tissue was harvested from the same monkey and cut into whole hemisphere frozen sections that were 60-μm-thick sections and spaced at 600 μm apart. Sections were stained using standard lab protocol with Thionin stain (0.05% thionin at pH 4.8) which labeled all cell bodies blue. We then imaged the stained slices using a Zeiss Axioscan microscope with 10x objective to obtain a resolution of 0.44 μm (Figure 2). Same 7 ROIs used in diffusion MRI analysis were hand drawn on these digitized histological sections, which were used for ROI based comparisons. We then segmented the histology slices to identify stained cell bodies using the Matlab Image Processing Toolbox and Nuclei Counter code: (https://www.mathworks.com/matlabcentral/fileexchange/45174-nuclei-counter) (Figure 3).
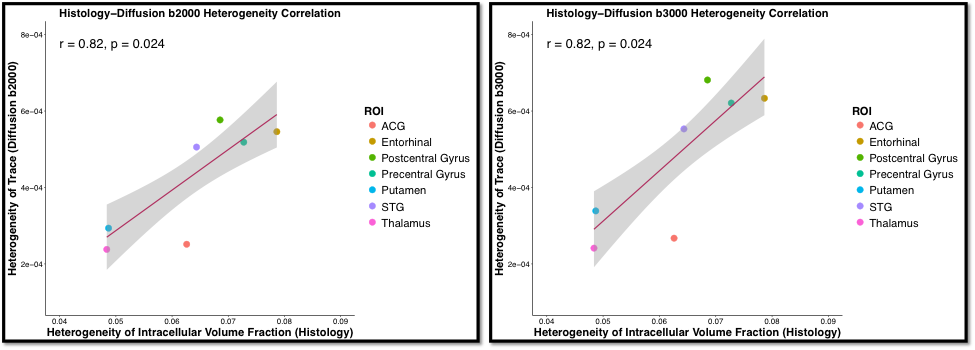
We then computed average cell density across all tissue sections, which was the fraction of area covered by cell bodies in each ROI. Next, each section within each ROI was resampled into 2D grid of dimensions 0.8x0.8mm2 to match the diffusion voxel size. Variance of cell area density was computed across all such 2D voxel-sized squares within each ROI, which gave us the heterogeneity in cell area density (intracellular volume fraction). We then compared our diffusion measures of avgTrace and hTrace with histological measures of average cell area density and heterogeneity of intracellular fraction using Pearson correlation.
Results
Average cell area density values computed in this study are consistent with the previous study10 that measured Gray level Index (GLI), which is the fraction of area covered by all cell bodies in the cortex of macaques. Average Regional Cell Area Density showed no significant correlation with avgTrace in GM. But, regional variance in cell area density showed high positive correlation with heterogeneity of Trace for both b=2000 and 3000 s/mm2. Subcortical regions can be qualitatively seen to be less heterogeneous in structure than cortical regions. Further investigation with more data is needed to study statistical differences between ROIs.Discussion and Conclusion
This study presents the first attempt towards histological validation of Trace in GM in macaque. Results prove our hypothesis that DTI measure of regional hTrace is highly influenced by variance in intracellular volume fraction. The higher the heterogeneity in the intracellular volume fraction, the higher the hTrace, which is correlated to variance in cell size and cell packing density. Given the promising results from this study, it is important to further investigate how other histological components such as position and geometry of cell bodies and even processes like dendrites may affect diffusion imaging measures such as Trace.Acknowledgements
The authors would like to acknowledge the following grants which supported this work: R01MH102377, (PI: Dr. Marek Kubicki), NIH R01 AG042512, (PIs: Drs. Kubicki, Makris, Rosene), R21 NIH R21AT008865 (PIs: Drs. Makris, Kubicki)References
1. Seehaus A, Roebroeck A, Bastiani M, Fonseca L, Bratzke H, Lori N, Vilanova A, Goebel R, Galuske R. Histological Validation of High-Resolution DTI in Human Post Mortem Tissue. Frontiers in Neuroanatomy. 2015.9 (3): 273–12. doi:10.3389/fnana.2015.00098.
2. Leergaard TB, White NS, Crespigny A, Bolstad I, D'Arceuil H, Bjaalie JG, Dale AM. Quantitative Histological Validation of Diffusion MRI Fiber Orientation Distributions in the Rat Brain. PLoS ONE 2010. 5 (1): e8595–98. doi:10.1371/journal.pone.0008595.
3. Morawski M, Kirilina E, Scherf N, Jäger C, Reimann K, Trampel R, Gavriilidis F, et al. Developing 3D Microscopy with CLARITY on Human Brain Tissue: Towards a Tool for Informing and Validating MRI-Based Histology. NeuroImage. 2017. 1–12. doi:10.1016/j.neuroimage.2017.11.060.
4. Laitinen T, Sierra A, Bolkvadze T, Pitkänen A, Gröhn O. Diffusion Tensor Imaging Detects Chronic Microstructural Changes in White and Gray Matter After Traumatic Brain Injury in Rat. Frontiers in Neuroscience. 2015. 9: 1–12. doi:10.3389/fnins.2015.00128.
5. Jespersen SN, Leigland LA, Cornea A, Kroenke CD. Determination of axonal and dendritic orientation distributions within the developing cerebral cortex by diffusion tensor imaging. IEEE transactions on medical imaging. 2012. 31(1), 16-32.
6. Rathi Y, Pasternak O, Savadjiev P, Michailovich O, Bouix S, Kubicki M, Westin CF, Makris N, Shenton ME. Gray Matter Alterations in Early Aging: a Diffusion Magnetic Resonance Imaging Study. Human Brain Mapping. 2014. 35 (8): 3841–56. doi:10.1002/hbm.22441.
7. Fedorov A, Beichel R, Kalpathy-Cramer J, Finet J, Fillion-Robin JC, Pujol S, Bauer C, et al. 3D Slicer as an Image Computing Platform for the Quantitative Imaging Network. Magnetic Resonance Imaging. 2012. 30 (9): 1323–41. doi:10.1016/j.mri.2012.05.001.
8. Dubach MF, Bowden DM. BrainInfo online 3D macaque brain atlas: a database in the shape of a brain. Society for Neuroscience Annual Meeting, Chicago, IL. 2009.Abstract No. 199.5.
9. Rohlfing T, Kroenke CD, Sullivan EV, Dubach MF, Bowden DM, Grant KA, Pfefferbaum A.The INIA19 Template and NeuroMaps Atlas for Primate Brain Image Parcellation and Spatial Normalization. Frontiers in Neuroinformatics. 2012. 6:27. doi: 10.3389/fninf.2012.00027.
10. Semendeferi K, Armstrong E, Schleicher A, Zilles K, Van Hoesen GW. Prefrontal cortex in humans and apes: A comparative study of area 10. Am. J. Phys. Anthropol. 2001.114: 224-241. doi:10.1002/1096-8644(200103)114:3<224::AID-AJPA1022>3.0.CO;2-I
Figures