3654
Consistency and Reproducibility of Probabilistic Tractography1Imaging Institute, The Cleveland Clinic, Cleveland, OH, United States, 2Neurological Institute, The Cleveland Clinic, Cleveland, OH, United States
Synopsis
Deciding from among the many available tractography algorithms can be challenging. We demonstrate that track-based measures can be compared using standard statistical approaches to compare the performance of two probablistic tractography algoirthms to determine the conditions under which one algorithm can replace another.
Introduction
Comparison of tractography algorithms is an important step when deciding among the many algorithms available, but it can be difficult to define a well-behaved statistic for individual fiber tracks. Track-based measures—values of tissue microstructure parameters averaged across a white matter pathway— are readily analyzed with standard statistical approaches. We compare two probabilistic tractography approaches—a stochastic algorithm that uses Monte Carlo (MC) sampling of fiber orientation distributions1 and a partial differential equation (PDE)-based approach2 that was formulated to mimic the MC approach. One motivation for the comparison is that the MC approach, while robust against the presence of lesions and crossing fibers, is computationally intensive. The PDE approach requires minmal computational resources. In order to understand the impact of the algorithm used, we study two aspects of the tracking methods: 1) reproducibility, which directly affects the ability to detect a significant change in diffusivity for longitudinal studies or a significant difference between groups for cross sectional studies and 2) the difference in mean value of track-based measures, as this will determine if the tracking methods are interchangeable, or have systematic differences.Methods
Under an IRB-approved protocol, five healthy controls were scanned, repositioned and scanned again on a Siemens Trio with standard 12-channel head coil (Siemens Medical Solutions, Erlangen). DTI was acquired at 2.5 mm isotropic spatial resolution with 64 b=700sec/mm2 diffusion-weighting gradients and 8 b=0. After motion correction with TORTOISE3, tissue microstructure parameters (fractional anisotropy (FA), mean diffusivity (MD), radial diffusivity (RD) and axial diffusivity (AD))4 and fiber orientation distributions5,6 were calculated. Hand-drawn ROIs were used to define endpoints of corticospinal tract (CST) and transcallosal motor pathway (TMP), followed by MC- and PDE-based tractography. Means of tissue microstructure parameters, calculated within each track1 , were used for statistical comparison.Results
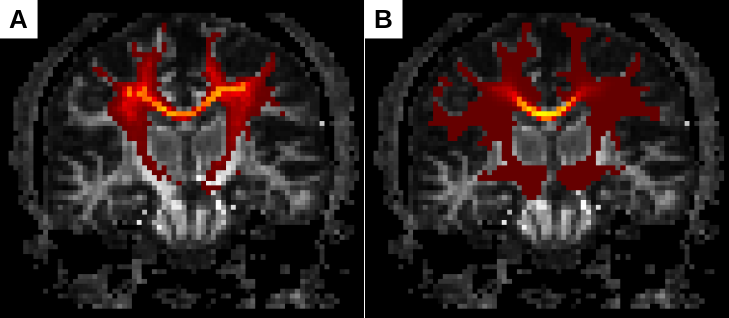
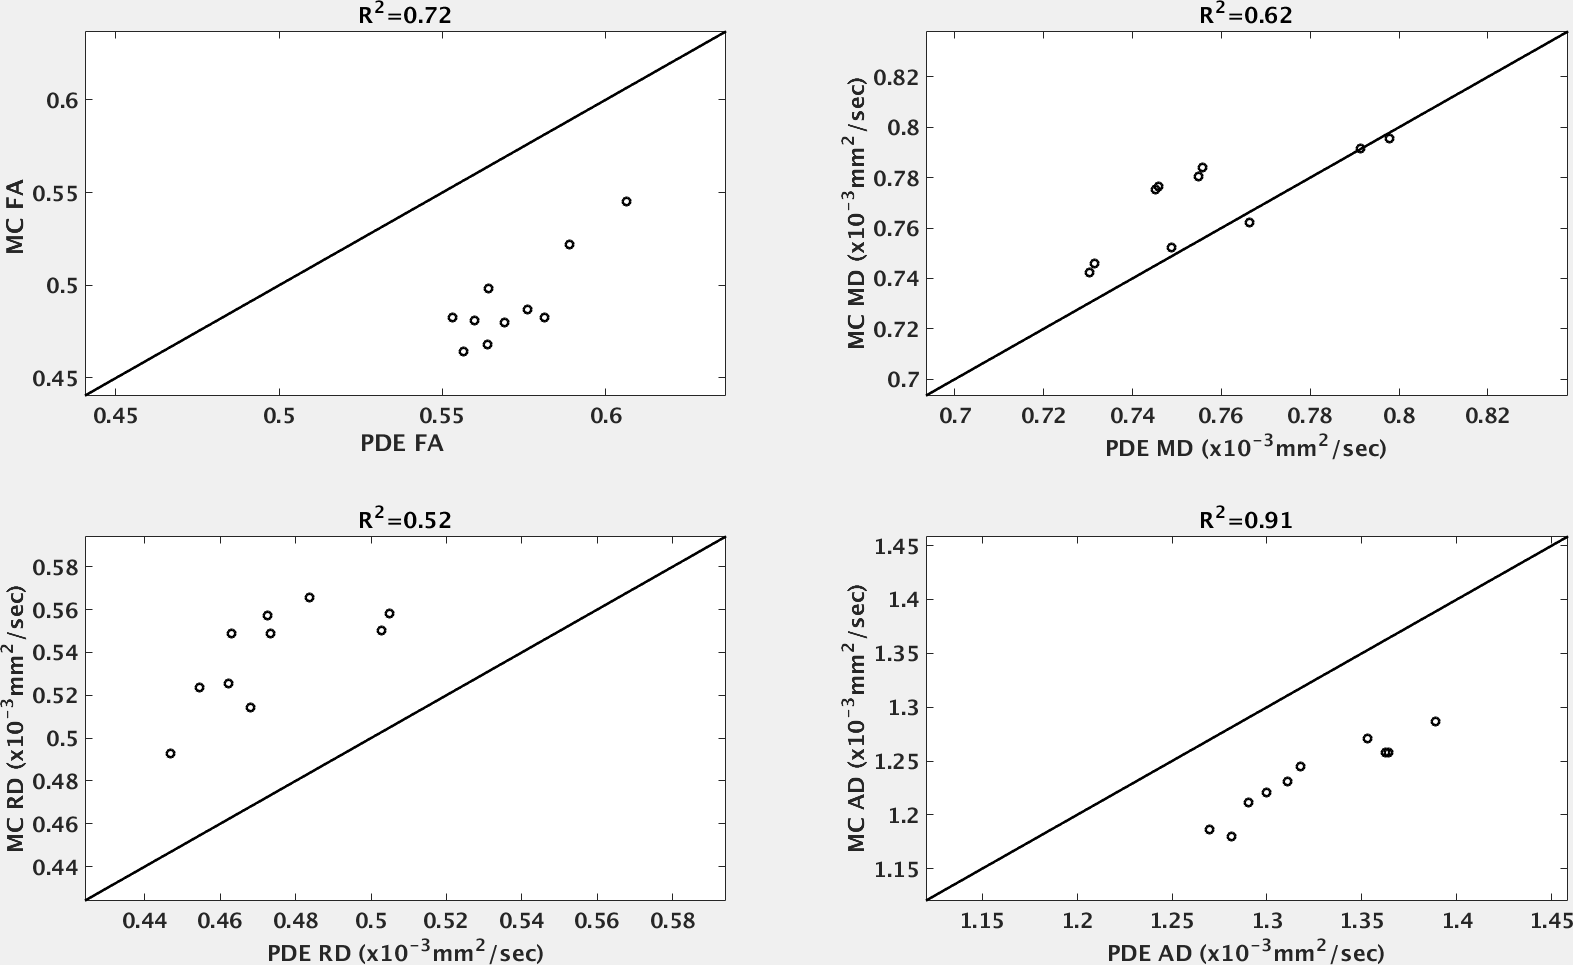
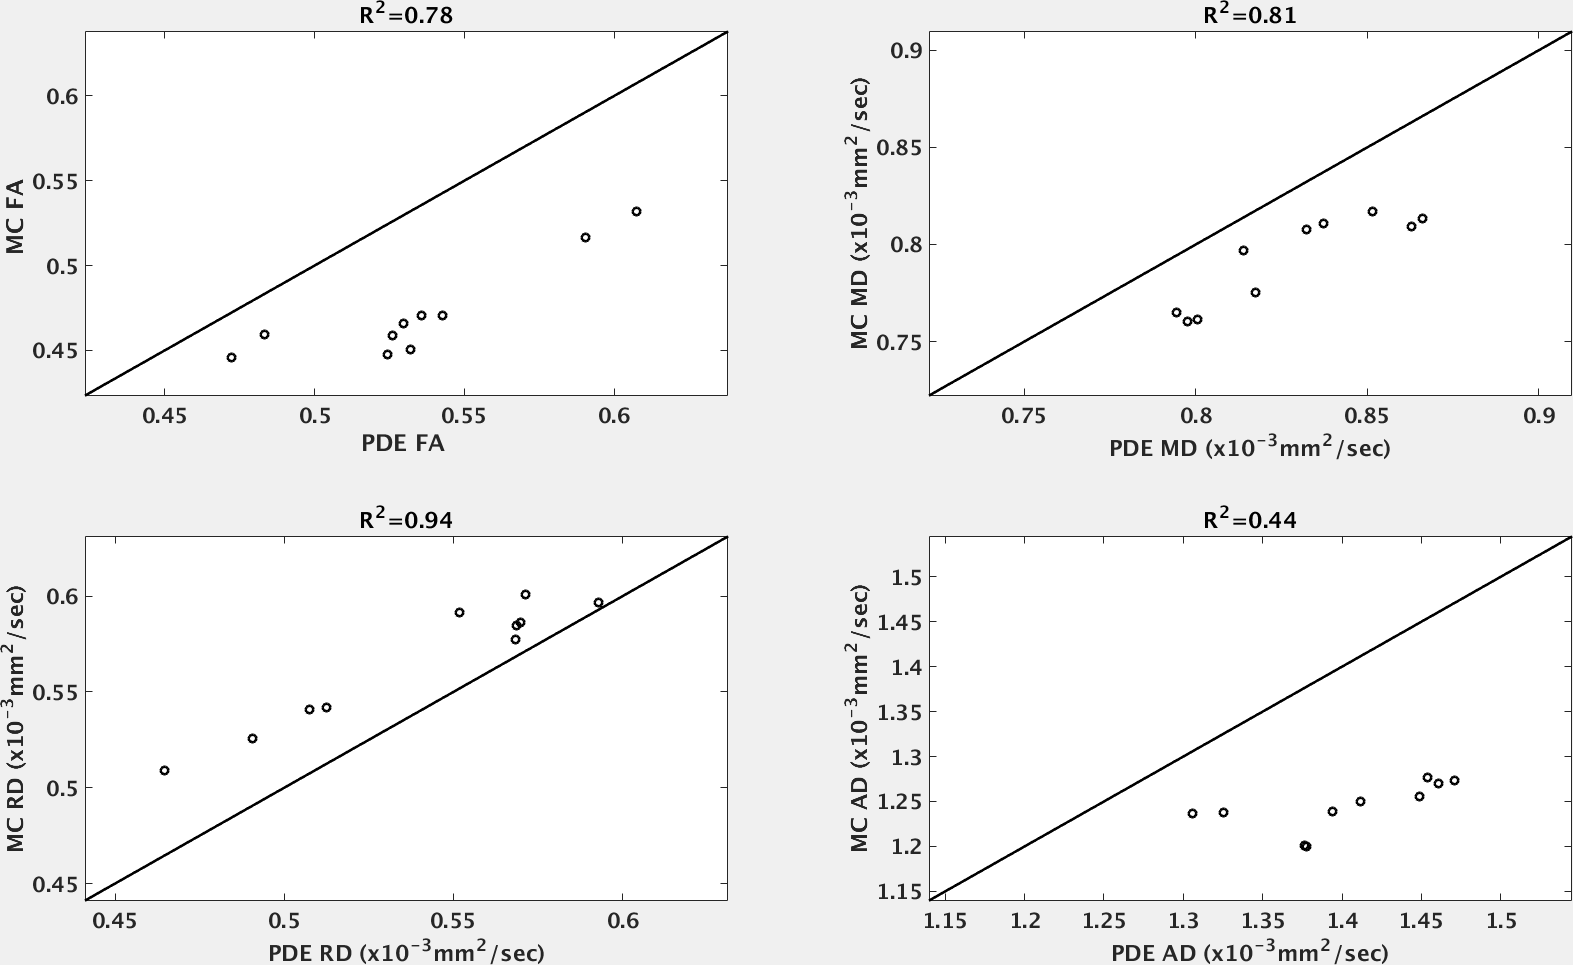
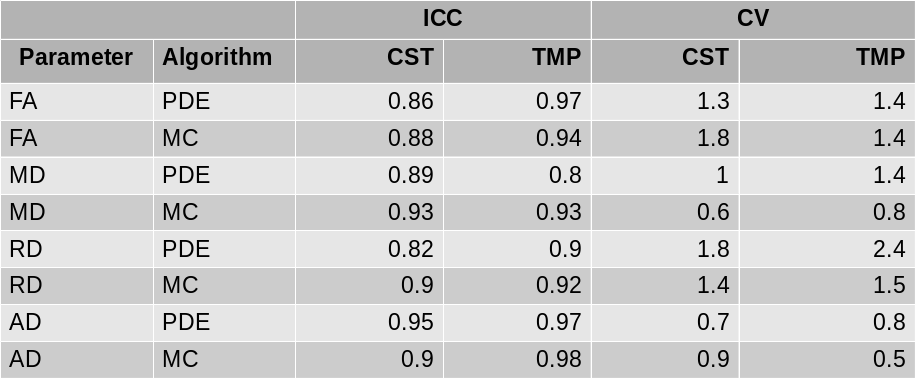
Figure 1 shows track density maps from MC and PDE tractography in the TMP. The spatial location of tracks is qualitatively consistent, but there are systematic differences in the values of track density. Figures 2 and 3 show these differences quantitively. Figure 4 shows measures of reproducibility, intra-class correlation coefficient (ICC) and coefficient of variation (CV). All values meet conventions for high reproducibility (ICC > 0.70 and CV < 10)7, but measures of reproducibility are slightly worse for PDE than for MC. The implications of this difference can be illustrated with a power analysis. Assuming a value of 0.5x10⁻³ mm2/sec for RD, a 3% change per year over two years, and a type I error of 0.05 results in power of 0.8 for the MC algorithm and 0.48 for the PDE algorithm.Discussion and Conclusion
There are clear systematic differences between the algorithms.
The same underlying data, voxel-wise derived quantities and ROIs were used for
each tractography algorithm, eliminating the possibility of these as sources of
the differences. Although the PDE approach was formulated to replicate the
results of the MC algorithm, these results suggest that it would be unwise to
mix track-based measures from different algorithms in a group analysis. The
reproducibility results show comparable and high values for both algorithms. However,
the difference in reproducibility
results in a reduction in statistical power. In conclusion, the PDE algorithm
can be used a replacement for the MC algorithm if used for all scans used in the
study and only if the loss of sensitivity can be compensated for with a
sufficiently large sample sizeAcknowledgements
We acknowledge support from the National Institute of Neurological Disorders and Stroke (U01NS082329), National Multiple Sclerosis Society (RG 4778-A-6) and from MediciNova through a contract with the National Institutes of Health.References
1. Lowe, M. J., Beall, E. B., Sakaie, K. E., Koenig, K. A., Stone, L., Marrie, R. A. & Phillips, M. D. Resting state sensorimotor functional connectivity in multiple sclerosis inversely correlates with transcallosal motor pathway transverse diffusivity. Hum Brain Mapp 2008; 29(7):818-827.
2. Zhang, M., Sakaie, K. E. & Jones, S. E. Logical foundations and fast implementation of probabilistic tractography. IEEE Trans Med Imaging 2013; 32(8):1397-1410.
3. Pierpaoli, C., Walker, L., Irfanoglu, M. O., Barnett, A., Basser, P., Chang, L.-C., Koay, C., Pajevic, S., Rohde, G., Sarlls, J. & Wu, M. in Proceedings 18th Scientific Meeting, International Society for Magnetic Resonance in Medicine. 1597.
4. Basser, P. J. & Pierpaoli, C. Microstructural and physiological features of tissues elucidated by quantitative-diffusion-tensor MRI. J Magn Reson B 1996; 111(3):209-219.
5. Tournier, J. D., Calamante, F., Gadian, D. G. & Connelly, A. Direct estimation of the fiber orientation density function from diffusion-weighted MRI data using spherical deconvolution. Neuroimage 2004; 23(3):1176-1185.
6. Sakaie, K. E. & Lowe, M. J. An objective method for regularization of fiber orientation distributions derived from diffusion-weighted MRI. Neuroimage 2007; 34(1):169-176.
7. Marenco, S., Rawlings, R., Rohde, G. K., Barnett, A. S., Honea, R. A., Pierpaoli, C. & Weinberger, D. R. Regional distribution of measurement error in diffusion tensor imaging. Psychiatry Res 2006; 147(1):69-78.
Figures