3653
How reproducible are the results of probabilistic white matter tract estimation?1Department of Biomedical Egineering, School of Biomedical Engineering and Imaging Sciences, King's College London, London, United Kingdom, 2Department of Neuroradiology, King's College Hospital, London, United Kingdom, 3Department of Medical Physics and Bioengineering, NHS Highland, Inverness, United Kingdom
Synopsis
Diffusion tractography and fMRI data is valuable for pre-surgical planning, but its analysis involves a number of user-dependent decisions. In particular the choice of activation threshold in fMRI maps and the definition of seed region in tractography may impact the results. This work evaluates both the intrinsic variability of probabilistic white matter tract estimation and the inter-user reproducibility of tractography analysis. The former was estimated from repeated identical processing, while for the latter tracts obtained by different users were compared. Achieving a good inter-user reproducibility (up to 85%) is possible, considering that the intrinsic reproducibility ranged between 72% and 89%.
Introduction
Diffusion tensor imaging (DTI) tractography in conjunction with functional MRI (fMRI) have been shown to be valuable for brain mapping and in supporting pre-surgical planning [1,2,3]. The processing of fMRI and tractography data entails user-dependent decisions [1,4]. In particular the choice of activation threshold in fMRI maps and the definition of the seed region in tractography may notably impact analysis results. This work evaluates the inter-user reproducibility of tractography in relation to its intrinsic reproducibility resulting from the probabilistic nature of the analysis.Methods
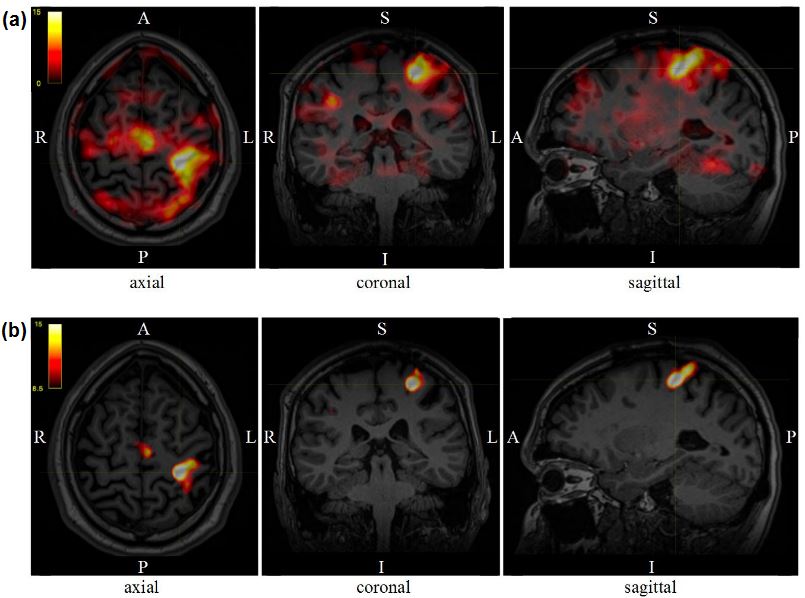
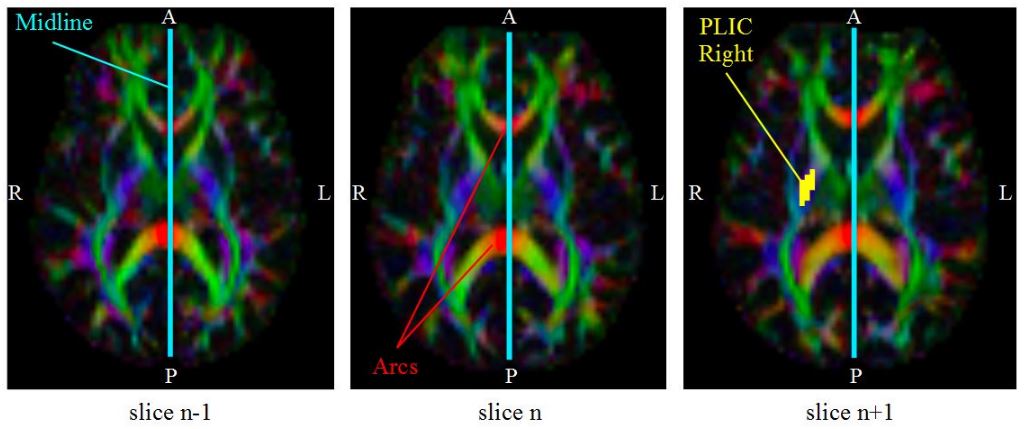
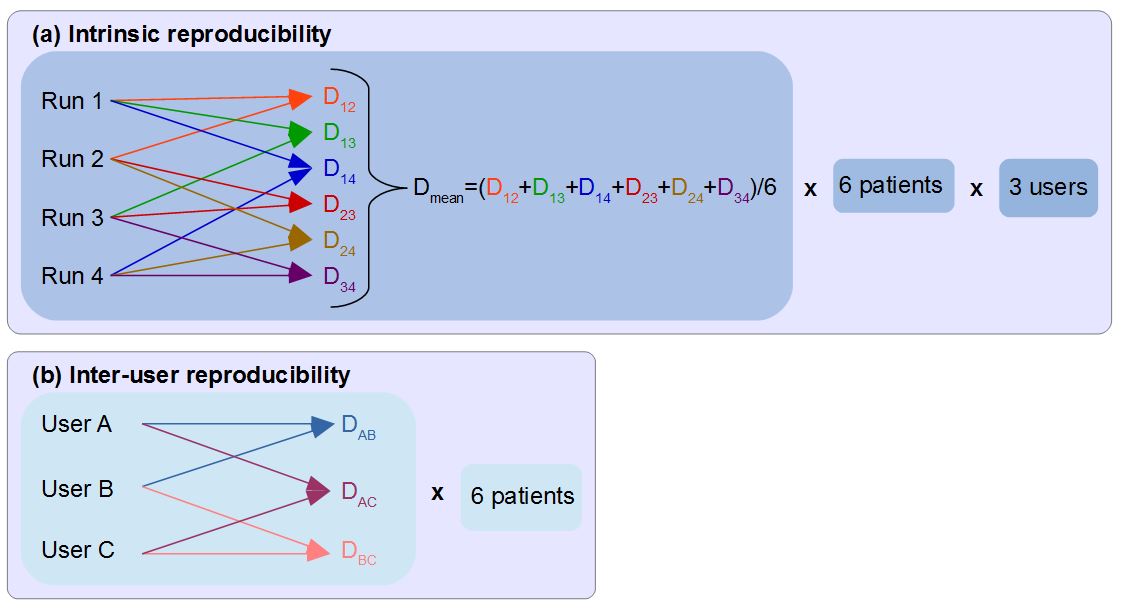
Six clinical datasets acquired before tumour (N=3) or epilepsy (N=3) surgery at 1.5 T (Siemens Aera, standard 20-channel head-only receive coil) were employed. The MRI protocol consisted of: 3D T1-weighted MPRAGE anatomical (TE/TR=3.02/2200ms, voxel=(1mm)$$$^3$$$); fMRI GE-EPI (TE/TR=40/3000ms, voxel=2.5x2.5x3mm$$$^3$$$); DTI SE-EPI (TE/TR=86/9500ms, voxel=(2.5mm)$$$^3$$$, 6xb=0s/mm$$$^2$$$ and 64diffusion directions at b=1500s/mm$$$^2$$$). fMRI acquisitions consisted of 6 cycles of alternating rest and activation periods of 30 seconds. Tasks included: finger tapping, foot rocking, and lip pouting. Diffusion data was reconstructed using constrained spherical deconvolution and probabilistic tractography was subsequently applied with MRtrix3 [5]. The data analysis instructions were: 1) for each task, produce an activation t-map using SPM12 [6], threshold it to isolate the area with highest activation (Figure 1), binarise it, then combine results from all tasks to form a single mask for the activation region; 2) on the fractional anisotropy map, manually draw the seed region for the corticospinal tract on the posterior limb of the internal capsule of the hemisphere of interest (Figure 2), use the activation region obtained from the fMRI data as end region of the tract, and generate tracks. The process was terminated when 10,000 tracks reached the fMRI-based end regions, matching published literature [7]. The reproducibility of probabilistic tractography was assessed for three users (medical physicists, blind and independent data analysis) by pair-wise comparison of binarised streamline distributions ($$$\alpha$$$ and $$$\beta$$$) using the Dice index [8]: $$$D=\frac{\alpha\cap\beta}{\alpha+\beta} $$$. A conservative threshold was applied where voxels containing < 2 streamlines were removed, ensuring all true positive tracts most likely survive thresholding and remain in the final tractography image. For the intrinsic reproducibility, four analysis runs with identical parameters and regions were performed for each patient-user combination (Figure 3(a)). Results were then compared across the four runs resulting in a total of six Dice indices, which were averaged to yield a mean Dice index for each patient-user combination. For the inter-user reproducibility, the binarised streamline distributions obtained by three different users were compared pair-wise for each patient (Figure 3(b)).
Results and Discussion
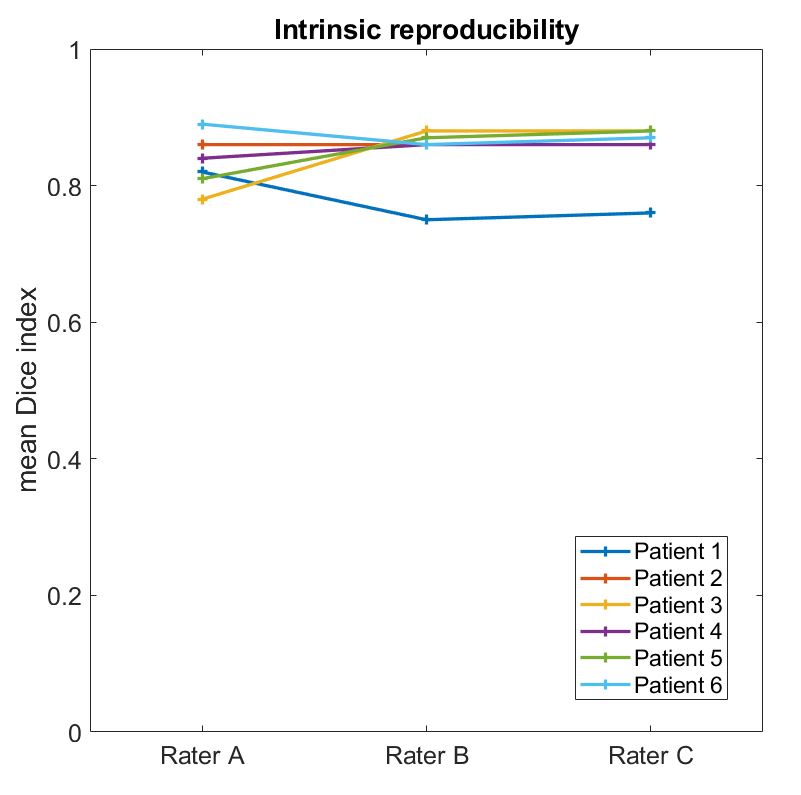
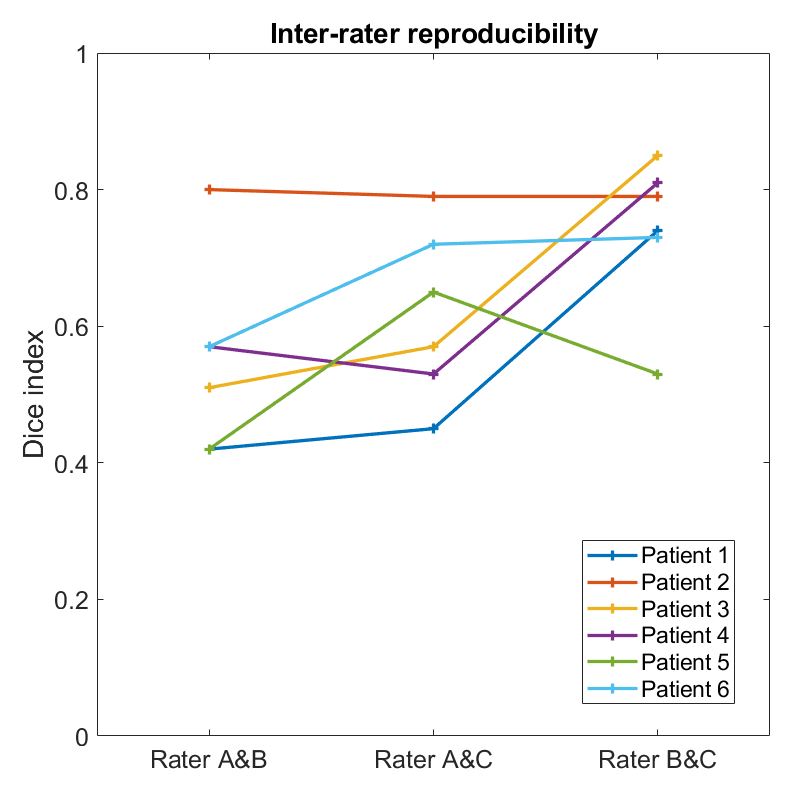
The results can be seen in Figure 4 for the intrinsic reproducibility and in Figure 5 for the inter-user reproducibility. The Dice indices vary between 0.72 and 0.89 for the intrinsic reproducibility, and between 0.42 and 0.85 for the inter-user reproducibility. We evaluated the reproducibility of streamline distributions by comparing their spatial extent, representing the visual information provided to neurosurgeons. Notably, at least 10% of this information varies between different runs of the analysis (intrinsic reproducibility). The intrinsic reproducibility is mostly stable across users, but patient-specific features can have an impact on it - for patient 1 (Figure 4) the low Dice index is associated with a fragmented fMRI-based end region. Regarding the inter-user reproducibility, the lowest Dice indices correspond to the largest difference in end regions, which are heavily influenced by the choice of activation threshold. Figure 5 suggests that inter-user reproducibility depends on patient-related (pathology) and user-related factors (choice of seed and end regions). Interestingly, although all users independently followed the same instructions, users B and C consistently chose higher activation thresholds, yielding more defined end regions. Choosing an adequate total number of tracks considered in the analysis is also important as it will influence the reproducibility. Reproducibility may also vary depending on the tract considered as different tracts have different variability across subjects [9]. In future work, we will extend this evaluation to more subjects and tracts (e.g. the arcuate fasciculus) and plan to assess the influence of seed and end region separately - as the latter seems to have significant weight on the reproducibility.Conclusion
In this work, we have assessed the reproducibility of probabilistic white matter tract estimation. Despite the results being patient and user dependent, it is possible to achieve good inter-user reproducibility with values up to 85%, considering that the intrinsic reproducibility ranged between 72% and 89%. This work shows that intrinsic reproducibility and other influences should be considered during clinical interpretation of tractography data. This evaluation also suggests that consistency in the analysis should be pursued in order to obtain reproducible results.Acknowledgements
This work was carried out at the Department of Neuroradiology at King’s College Hospital NHS Foundation Trust, and supported by the Wellcome EPSRC Centre for Medical Engineering at King’s College London (WT 203148/Z/16/Z) and by the National Institute for Health Research (NIHR) Biomedical Research Centre based at Guy’s and St Thomas’ NHS Foundation Trust and King’s College London. The views expressed are those of the authors and not necessarily those of the NHS, the NIHR or the Department of Health.References
[1] Abbott et al. [2010], ‘fMRI assessment of language lateralization: an objective approach’ Neuroimage 50(4), 1446-1455. [2] Bizzi, A. [2009 ] ‘Presurgical mapping of verbal language in brain tumors with functional MR imaging and MR tractography’. Neuroimaging Clinics 19(4), 573-596. [3] Bucci et al. [2013] ‘Quantifying diffusion MRI tractography of the corticospinal tract in brain tumors with deterministic and probabbilistic methods’. NeuroImage: Clinical, 3, 361-368. [4] Kinoshita et al. [2005], ‘Fiber-tracking does not accurately estimate size of fibre bundle in pathological condition: initial neurosurgical experience using neuronavigation and subcortical white matter stimulation’, Neuroimage 25(2), 424-429. [5] http://www.mrtrix.org/ [6] Wellcome Trust Centre for Neuroimaging, University College London, UK (www.fil.ion.ucl.ac.uk/spm) [7] Farquharson et al., [2013], ‘White matter fiber tractography: why we need to move beyond DTI.’, Journal of neurosurgery 118.6, 1367-1377. [8] Dice, L.R. [1945], ‘Measures of the amount of ecologic association between species’, Ecology 26(3), 297-302. [9] Bürgel et al., [2006], ‘White matter fibre tracks of the human brain: three dimensional mapping at microscopic resolution, topography and intersubject variability’, Neuroimage, 29(4), 1092-1105.Figures