3647
Non-destructive measurement and prediction of soluble solids of fruits using diffusion-weighted magnetic resonance imaging1Faculty of Science and Engineering, University of Nottingham Ningbo China, Ningbo, China, 2Sir Peter Mansfield Imaging Centre, School of Physics and Astronomy, The University of Nottingham, Nottingham, United Kingdom
Synopsis
Diffusion-weighted magnetic resonance imaging (DW-MRI) was used to measure and predict total soluble solids (TSS, unit: °Brix) of fruits noninvasively. The results demonstrated that mean apparent diffusion coefficient (ADC) in fruits was strongly correlated with TSS of fruit juice (R ≥ 0.92 and p ≤ 1.51E-4). DW-MRI shows great potential for future commercial implementation of fruit quality evaluation.
Introduction
The measurement of total soluble solids (TSS, unit: °Brix) is essential for evaluating the quality of fruit.1 In several studies, non-destructive prediction of TSS has been performed using near-infrared (NIR) spectroscopy as well as MRI. 2-5 However, the thick rind of fruit has been reported to decrease the accuracy of NIR spectroscopy measurement owing to the limited penetration depth of NIR radiation.6 We hypothesized that the diffusion coefficient will decrease with the increased viscosity in sugar solutions or fruits, which can be measured by diffusion-weighted magnetic resonance imaging (DW-MRI) and DW-MRI-based diffusion measurements can consequently be used as an indirect measure of TSS. In this work, we therefore applied DW-MRI to investigate the correlation between TSS (°Brix) and apparent diffusion coefficient (ADC) in sugar solutions and fruits.Methods
DW-MRI was carried out on 11 bottles containing different sugar solutions, 28 Fujiminori grapes (local farm, Yuyao, China) , 9 citruses with thick rind (tumut citrus 3107, Australia), and 12 local Cuiguan pears (local farm, Ningbo, China) on a 1.5T XGY scanner (Superscan-1.5T, XGY, China). Sugar solutions contained 550ml water and different amounts of dissolved sucrose. All fruits and sugar solutions were placed in the scanner room before the experiments with the same temperature of 23.0±1.0 degree for at least 12 hours. A pulsed gradient spin echo (PGSE), echo planar diffusion weighed sequence was used to produce DW source images, Trace DW images and ADC maps.7,8 The parameters included TR/TE = 10000/92 ms, slice thickness = 6 mm, FOV = 240*240 mm2, matrix = 256*256, b-value = 1000 s/mm2 . For image analysis in MATLAB (The MathWorks, USA), fruit regions excluding rind and seeds were selected manually as regions of interest (ROI) and the mean ADC in the ROI was calculated. After imaging, a MA871 Digital Brix refractometer (Milwaukee Electronics kft., Hungary) was used to estimate the TSS (°Brix) from the sugar solution or the juice squeezed immediately from each sample. A linear regression analysis with 4 groups of samples was performed separately to produce the below equation: y = a*x + b, where a is the slope and b is the intercept. The root mean squared prediction error (RMSPE) was calculated for each sample group.Results
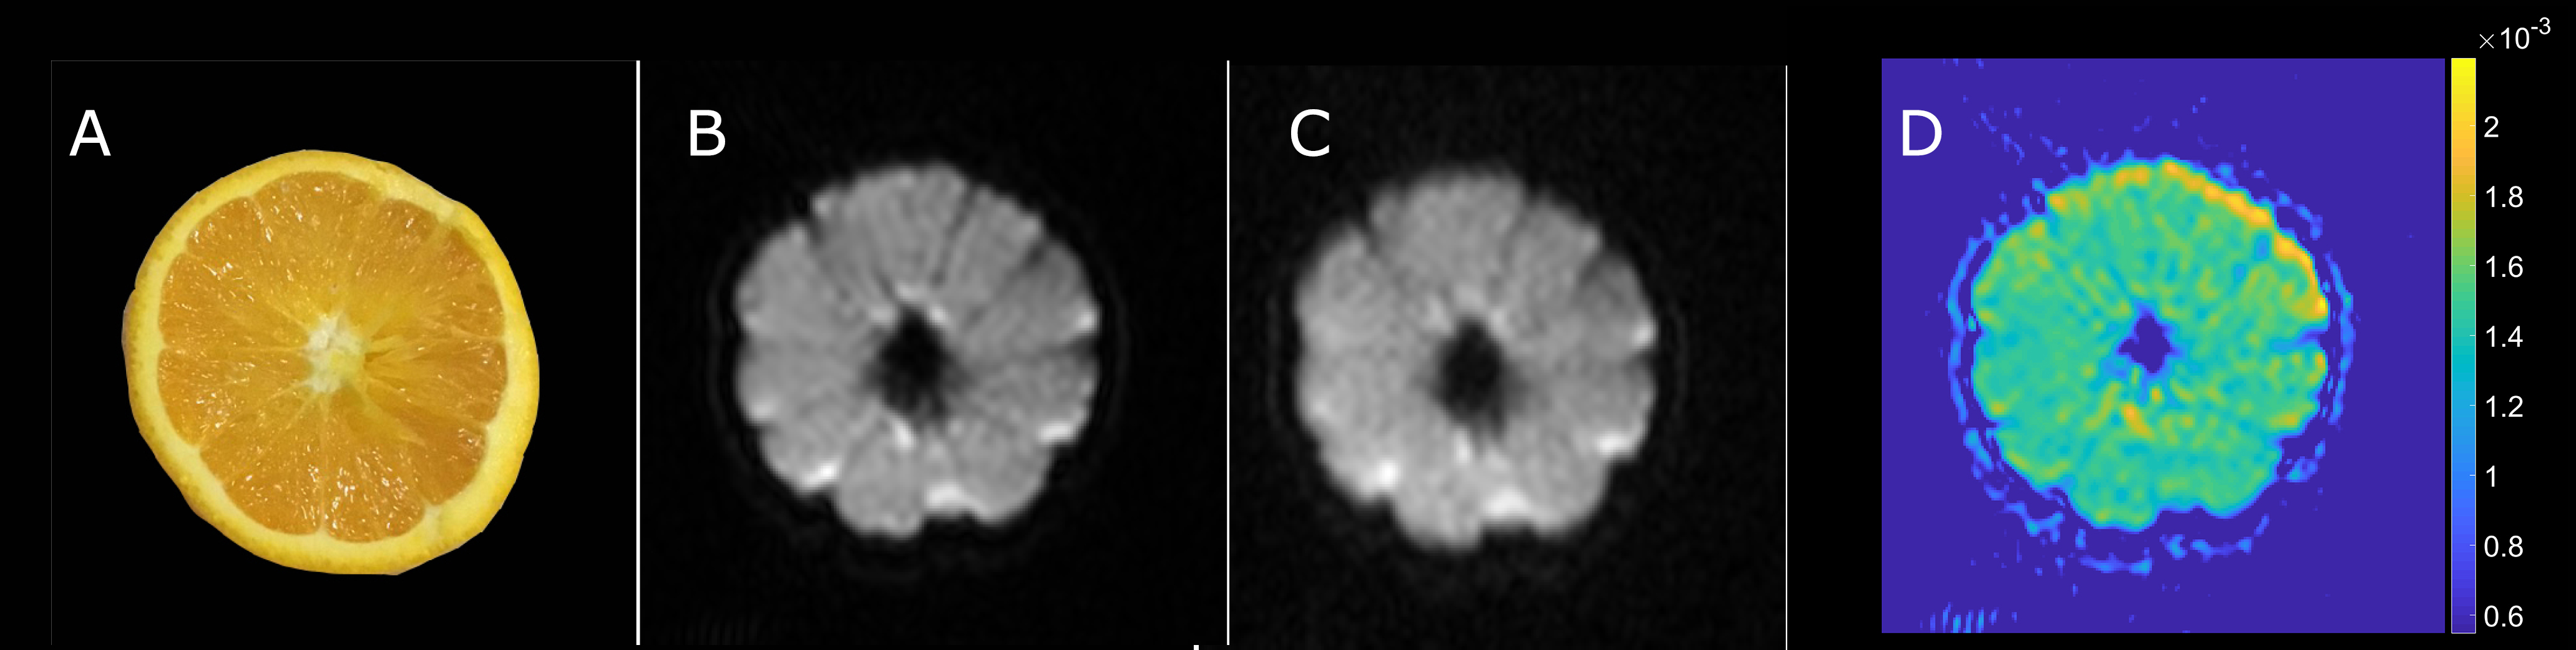
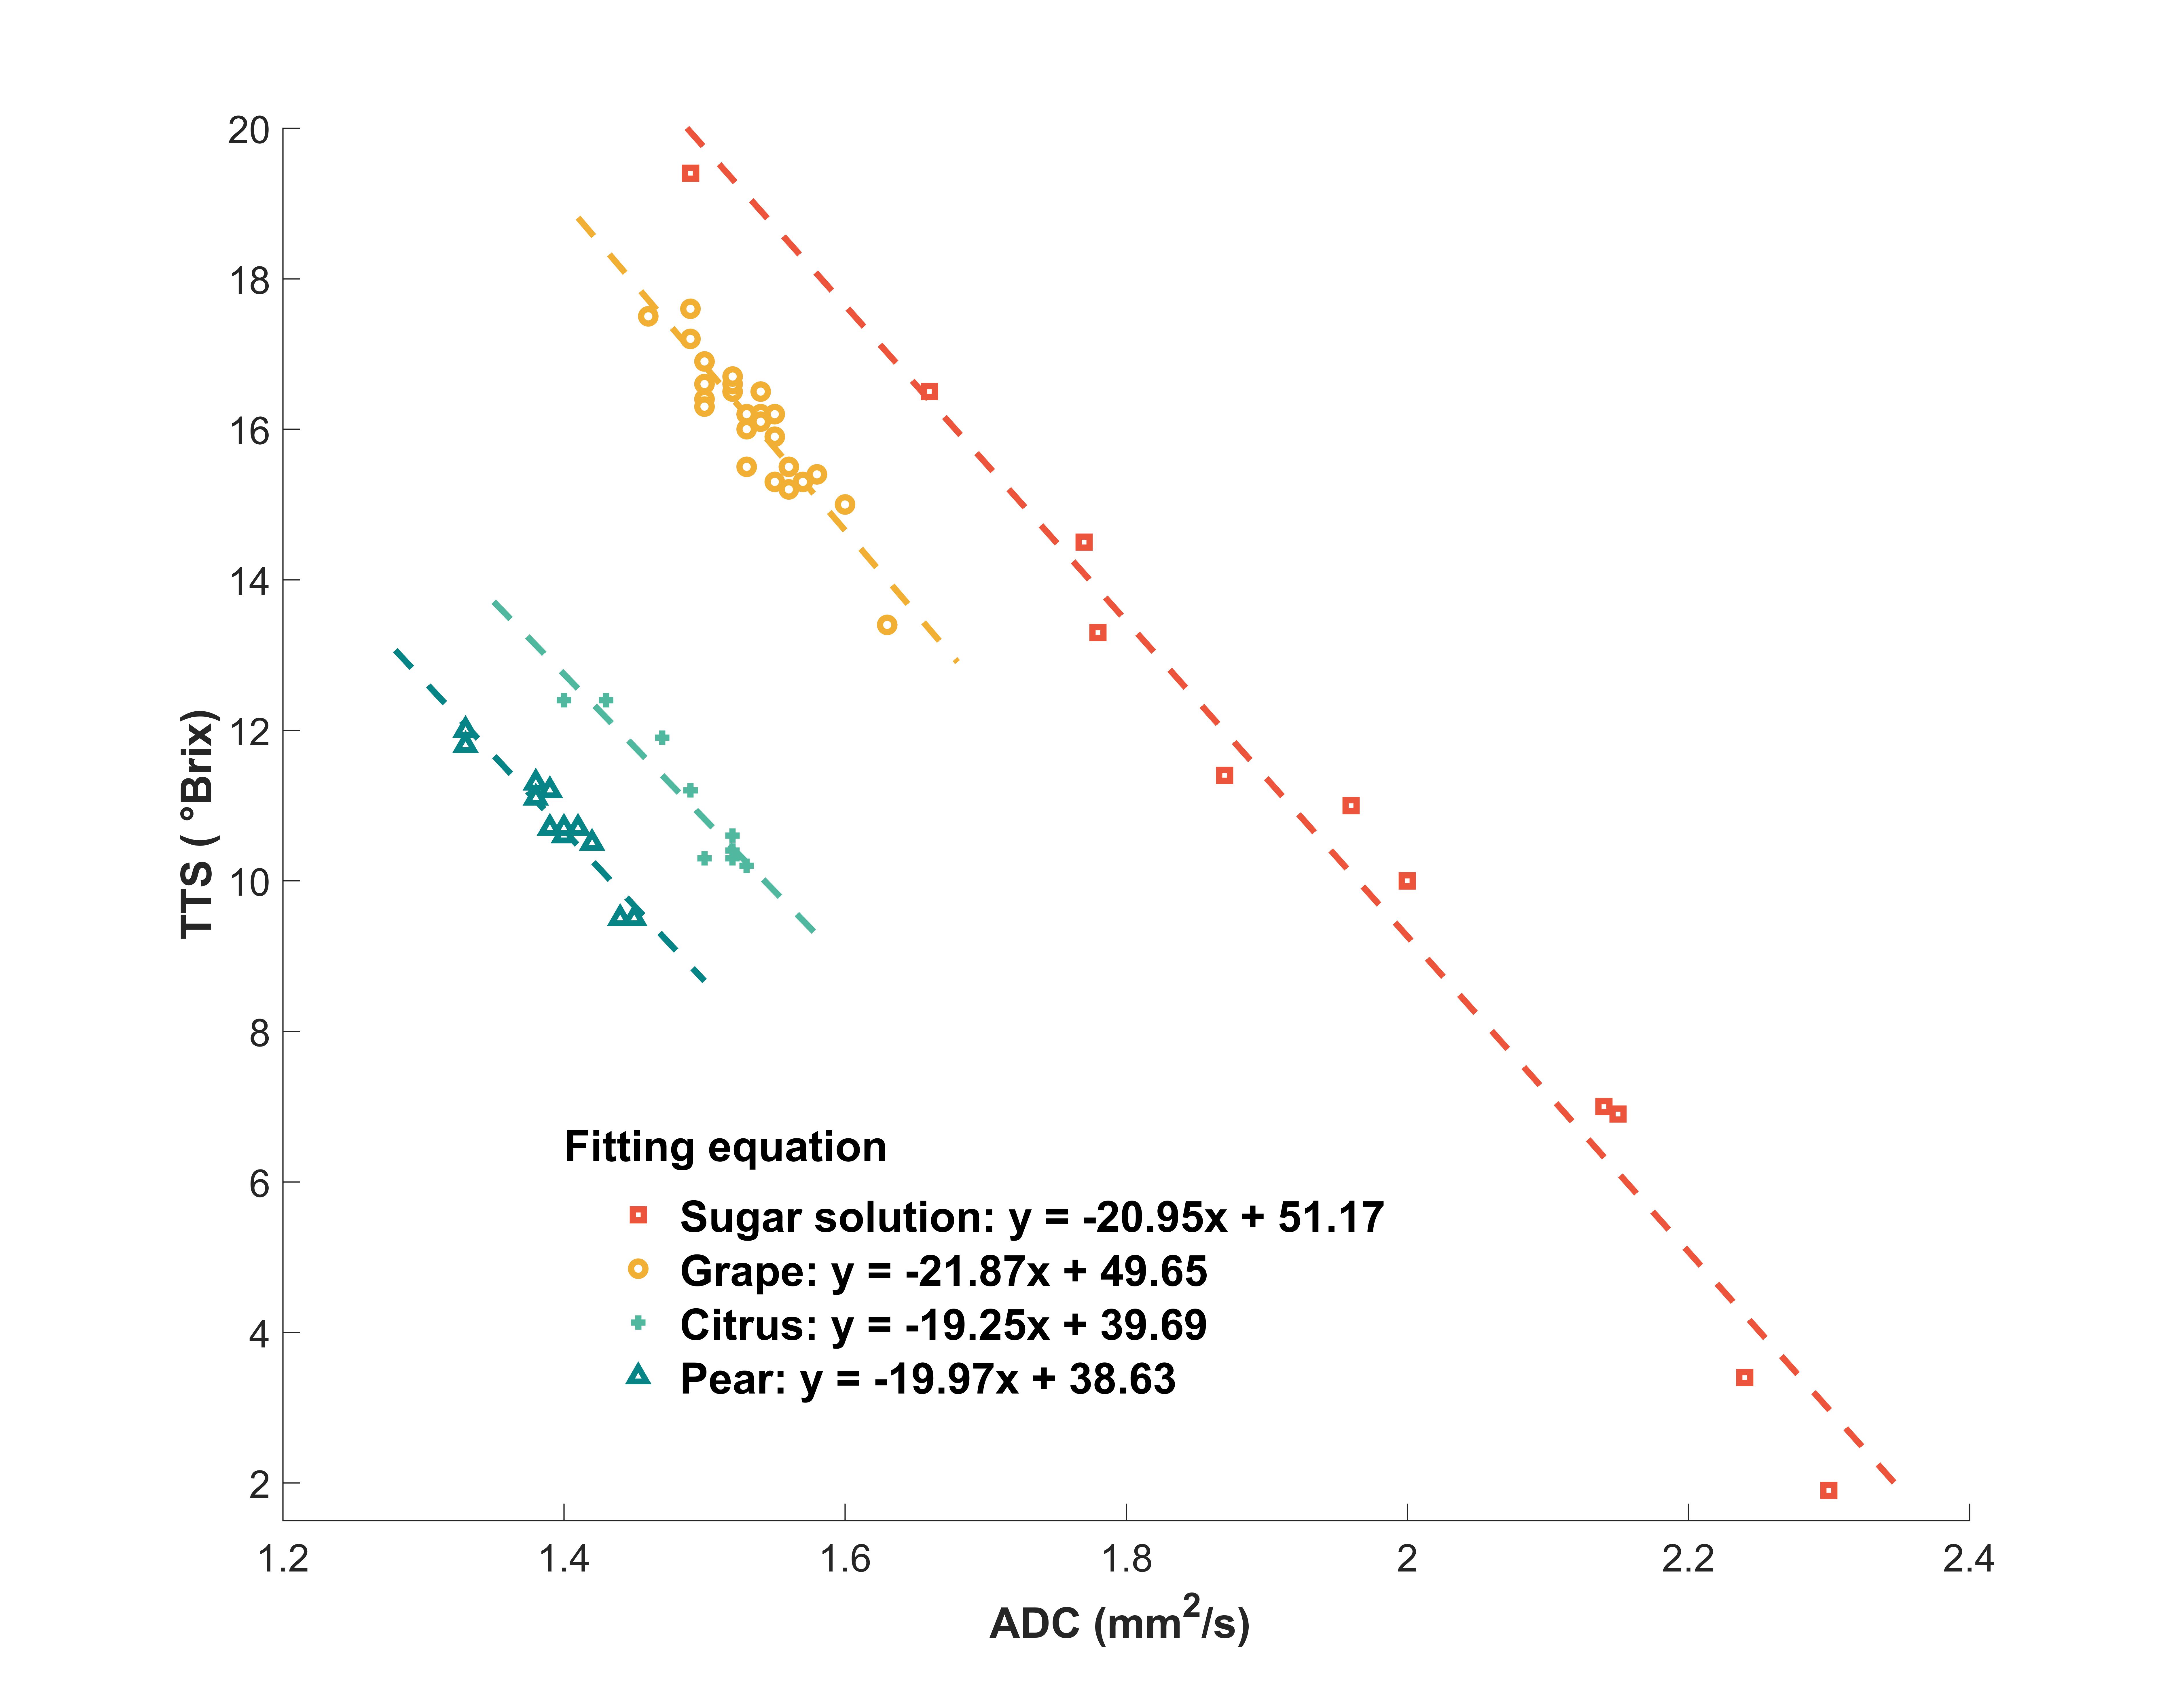
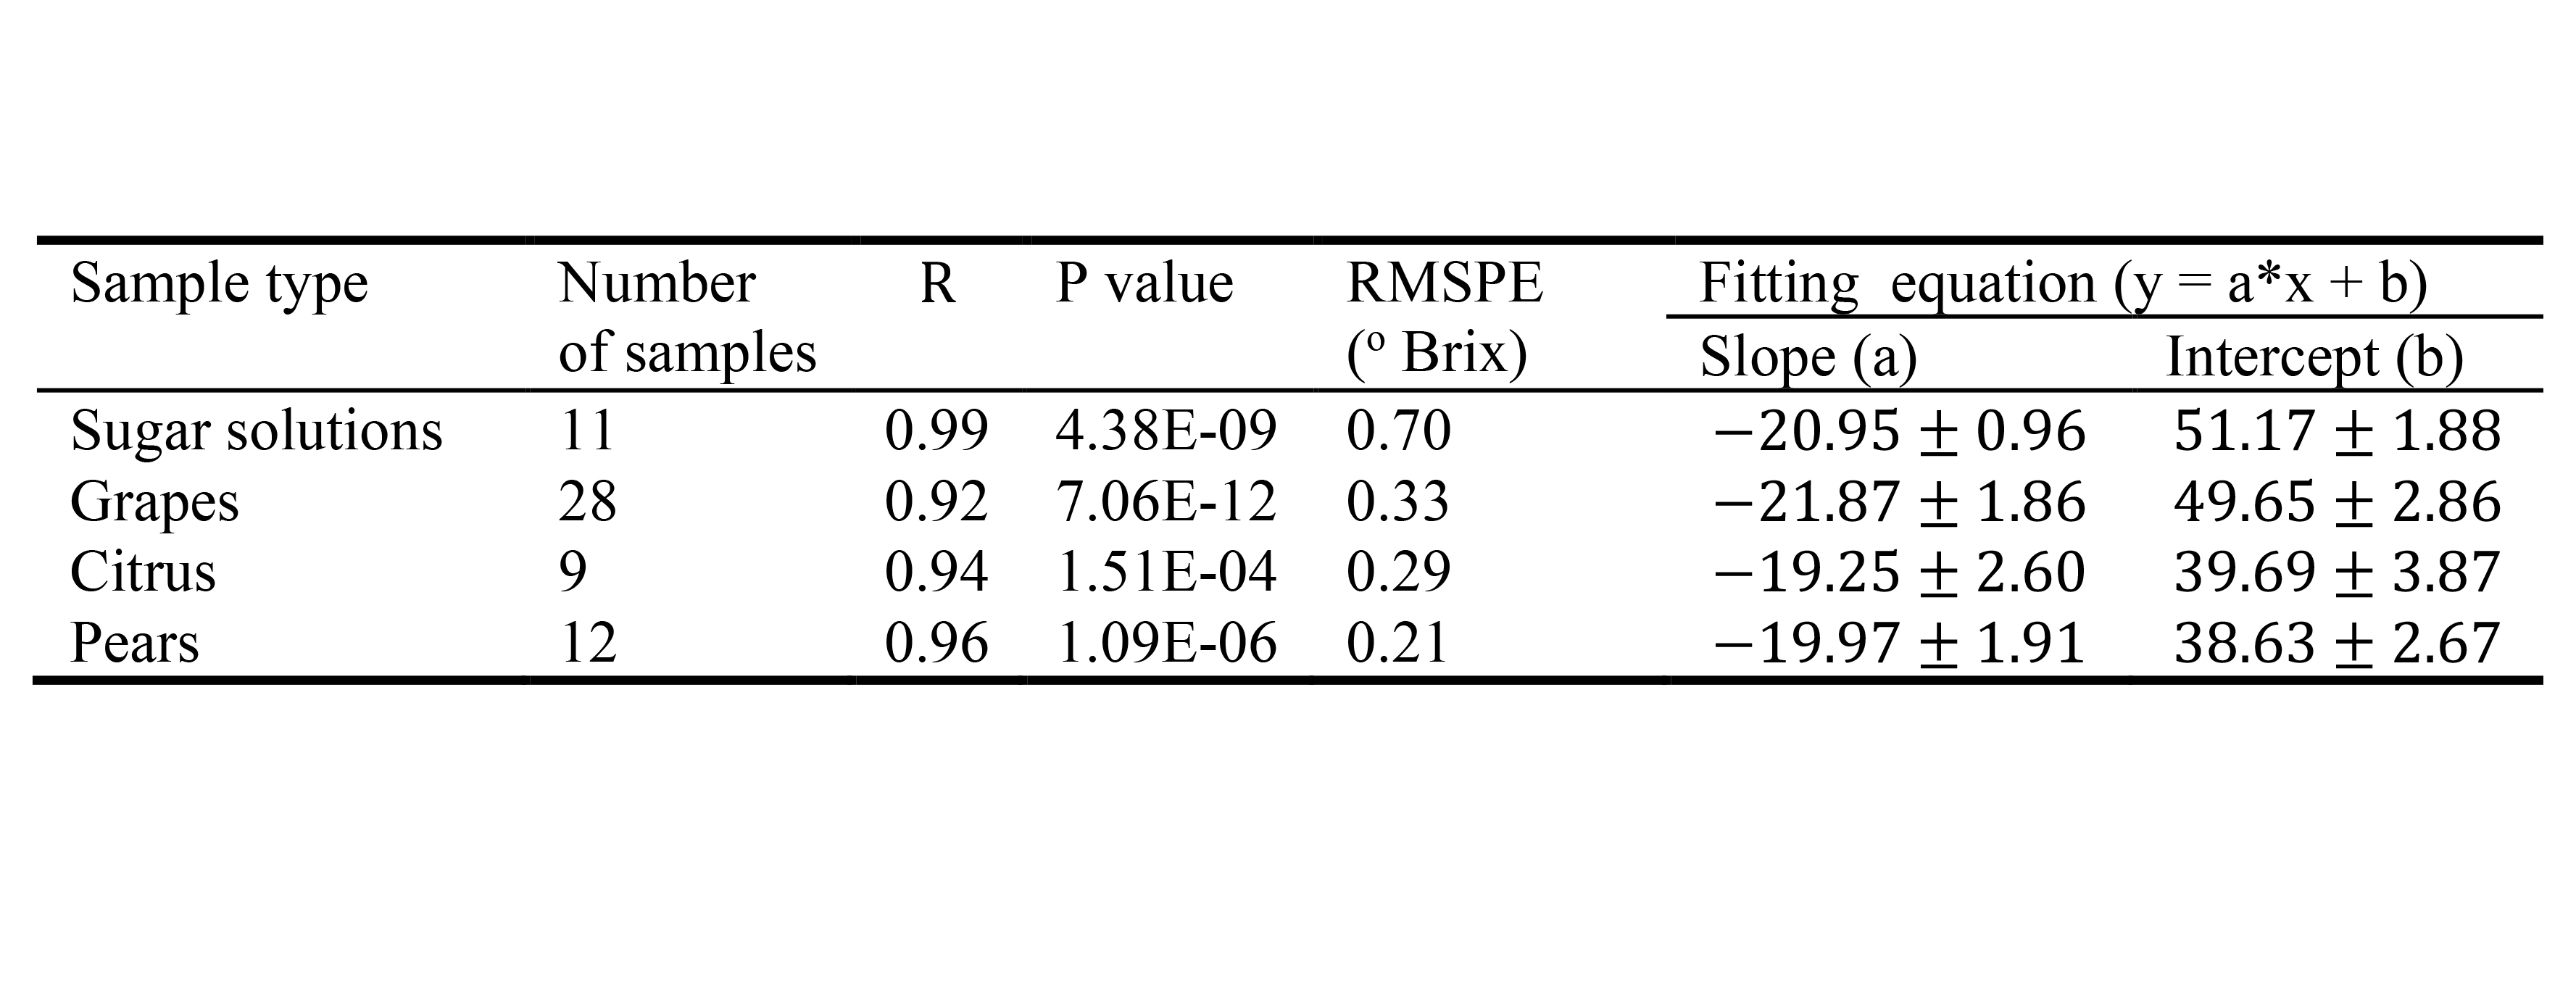
Figure 1 shows RGB image of one citrus fruit on a cut section (A), DW source image (B: b = 0 s/mm2), Trace DW image (C: b = 1000 s/mm2) and ADC map (D). The linear regression analysis demonstrated that the mean ADC was strongly correlated with the measured TSS (°Brix) for every sample type, as shown in Figure 2 and Table 1: 11 sugar solutions ( R = 0.99, P = 4.38E-09, RMSPE = 0.70); 28 grapes (R = 0.92, P = 7.06E-12, RMSPE = 0.33); 9 citruses (R = 0.94, P = 1.51E-04, RMSPE = 0.29) and 12 pears (R = 0.96, P = 1.09E-06, RMSPE = 0.21). Also, the slopes and the intercepts with corresponding standard error of the fitting curves were summarized in Table 1.Discussion
Our results have
demonstrated that mean ADC of sugar solutions and selected fruits is strongly
correlated with the measured TSS (°Brix) ( R ≥ 0.92 and p ≤ 1.51E-04).
Quite interestingly, we observed that the slope of the fitted curve for
different sample types is quite similar (-19.25~-20.95) as shown in Figure
2. A reasonable guess is that the slope is controlled by the viscosity of the
sucrose solution while the intercept is mainly influenced by the hardness of
samples due to different cellular environments. For our knowledge, this is the
first study which has shown that ADC can serve as a marker of TSS and further
can be used to evaluate the quality of fruit non-invasively.
Conclusion
We proposed and demonstrated a novel non-destructive method to estimate TSS (°Brix) using ADC measured by DW-MRI. Furthermore, DW-MRI can be a powerful tool for internal quality measurement of fruit with thick rind (citrus).Acknowledgements
References
1. Kader AA. FRUIT MATURITY, RIPENING, AND QUALITY RELATIONSHIPS. 1999. International Society for Horticultural Science (ISHS), Leuven, Belgium. p 203-208.
2. Guthrie J, Walsh K. Non-invasive assessment of pineapple and mango fruit quality using near infra-red spectroscopy. Australian Journal of Experimental Agriculture 1997;37(2):253-263.
3. Lammertyn J, Nicolaï B, Ooms K, De Smedt V, De Baerdemaeker J. NON-DESTRUCTIVE MEASUREMENT OF ACIDITY, SOLUBLE SOLIDS, AND FIRMNESS OF JONAGOLD APPLES USING NIR-SPECTROSCOPY. Transactions of the ASAE 1998;41(4):1089-1094.
4. Gómez AH, He Y, Pereira AG. Non-destructive measurement of acidity, soluble solids and firmness of Satsuma mandarin using Vis/NIR-spectroscopy techniques. Journal of Food Engineering 2006;77(2):313-319.
5. Nicolaï BM, Beullens K, Bobelyn E, Peirs A, Saeys W, Theron KI, Lammertyn J. Nondestructive measurement of fruit and vegetable quality by means of NIR spectroscopy: A review. Postharvest Biology and Technology 2007;46(2):99-118.
6. Arendse E, Fawole OA, Magwaza LS, Opara UL. Non-destructive prediction of internal and external quality attributes of fruit with thick rind: A review. Journal of Food Engineering 2018;217:11-23.
7.Stejskal EO, Tanner JE. Spin Diffusion Measurements: Spin Echoes in the Presence of a Time‐Dependent Field Gradient. The Journal of Chemical Physics 1965;42(1):288-292.
8. Le Bihan D, Breton E, Lallemand D, Aubin ML, Vignaud J, Laval-Jeantet M. Separation of diffusion and perfusion in intravoxel incoherent motion MR imaging. Radiology 1988;168(2):497-505.
Figures