3645
Comparison of Cylindrical and Spherical Geometric Models to Infer Cell Sizes in a Celery Sample1Physics, University of Winnipeg, Winnipeg, MB, Canada, 2Cubresa, Inc., Winnipeg, MB, Canada, 3Physics and Astronomy, University of Manitoba, Winnipeg, MB, Canada, 4Biology, University of Winnipeg, Winnipeg, MB, Canada
Synopsis
Temporal diffusion spectroscopy (TDS) can be used to infer sizes of cells in samples. It relies on a geometric model to relate the MRI signal to the cell sizes. Celery collenchyma tissue and vascular bundles have long cells while parenchyma cells are rounder. We compared a cylindrical and spherical geometric model in temporal diffusion spectroscopy to determine how important the geometrical model was for celery. The inferred diameters of cells in celery (14±6µm to 20±12µm) were not statistically different when using the two different geometric models. This is the first step toward understanding the importance of geometric models for TDS.
Introduction
Temporal diffusion spectroscopy (TDS) has been used to infer axon sizes using geometric models that assume axons are cylinders1-3. A celery sample was imaged to test if the importance of other geometric models. The vascular bundles and collenchyma tissue (~20 µm cells) in celery can be modeled as containing cylindrical cells. Whereas the parenchyma cells are rounder and are 3-4 times larger in diameter4. Thus we imaged celery to test TDS with oscillating gradient spin echo (OGSE) to see if the spherical cell model and cylindrical cell model infer significantly different cell sizes to determine how important the geometrical model is.Methods
Sample: A small section of a celery stalk was cut to fit inside a 15 mL sample tube filled with water. The image slice was chosen to be perpendicular to the length of the celery stalk.
MRI: The sample was imaged using a 7T Bruker AvanceIII NMR system with Paravision 5.0 and BGA6 gradient set with a maximum gradient strength of 430357 Hz/cm, and a 3.5 cm diameter bird cage RF coil. Each 20 ms apodised cosine gradient pulse5,6 ranged from n = 1-20, in steps of 1. Two different gradient strengths were used for each frequency and gradient pulses were separated by 24.52 ms. One image was collected at the first gradient strengths of 0. Four images were collected at the second gradient strength for each frequency. The gradient strength was chosen to keep b ≈ 130 s/mm2 constant for the frequencies from n=1-9. For n>9 the gradient strength was held constant at 90% maximum because we could not get to the desired b-value.
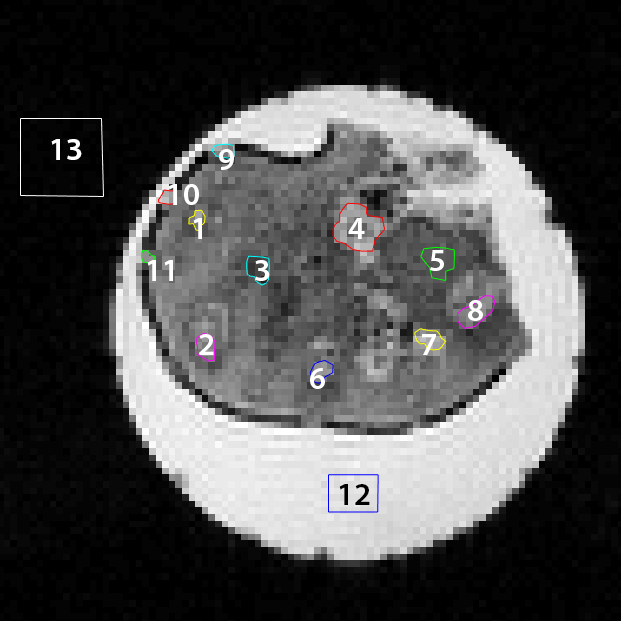
Imaging parameters: 2 averages, 2.56 cm2 FOV, TR = 1250 ms, TE = 50 ms, matrix 128 x 128, 200 μm in plane resolution, acquisition time 26.67 minutes per scan (scans performed = 40, 17.78 hours) were used. A 1 mm thick slice of interest was imaged as shown in Figure 1.
Image Analysis: Prior to fitting, a custom-built image registration tool was used7 to align all images to the b=0 diffusion-weighted images using a rigid affine transformation matrix determined automatically by maximizing the 2D correlation coefficient.
Analysis: Regions of interest (ROIs) were drawn in the vascular bundles, collenchyma and parenchyma tissue, as well as within the noise. The mean ± standard deviation of the signal in the ROIs was calculated. The signal was assumed to be described by a two compartment model of the form $$$ E(ω= 2πn⁄σ,g)=(1-f_{cel} ) e^{bD_h}+f_{cel} e^{-β(D_i,AxD)}$$$
where fcel is the packing fraction of cells, Di is the intra-cellular diffusion coefficient, Dh is the hindered diffusion coefficient, and AxD is the effective mean cell diameter3,8. Signals were fitted to the two compartment model using least squares minimization to extract AxD. The data were fitted to two different models, one with cylindrical cells and one with spherical cells. We hypothesized that the vascular bundle and collenchyma tissue would be better modelled with cylinders and the parenchyma would be better modelled with spheres.
Results
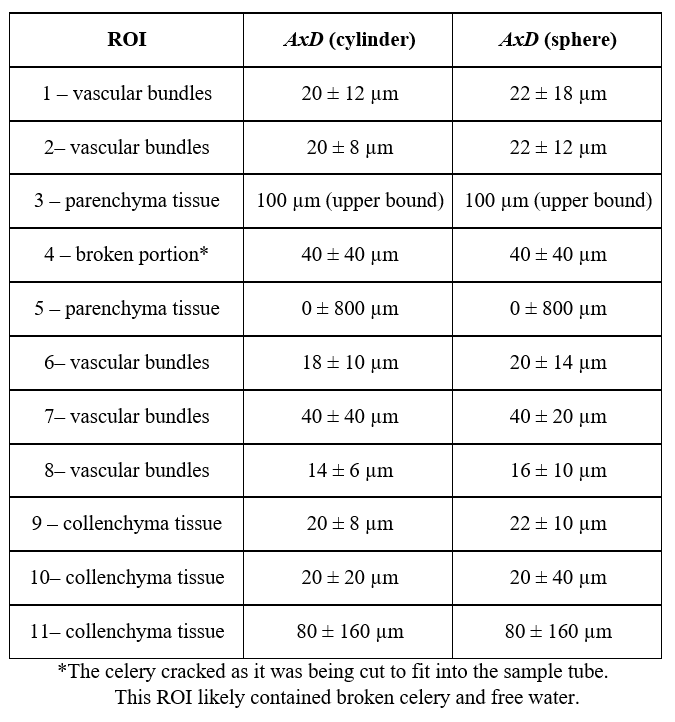
Figure 2 shows the table of results of the ROIs as labelled in Figure 1.Discussion and Conclusion
Using the model we inferred cell sizes for all but one of the ROIs. Cell sizes inferred in five of the 11 ROIs had uncertainties smaller than 100%. Four of these ROIs were in the vascular bundles (ROIs 1,2,6,8) and one was in the collenchyma tissue (ROI9). The inferred cell diameters in these ROIs ranged from 14 ± 6 µm to 20 ± 12 µm which is expected4. The model was unable to infer the sizes of the cells in the parenchyma tissue because the cells in these tissues were larger than 100 µm and the OGSE sequence parameters used in this work targeted cell sizes much smaller than this. There were no significant differences between the spherical and cylindrical cell models in terms of the value of the cell sizes. This indicates that either the exact geometry is not important in the model, or, more likely, a better model of the geometry is needed. The OGSE frequency range targeted cells ~ 2-3 µm in diameter while cell sizes in the vascular bundles and collenchyma tissue are around 20 µm in diameter. This could also affect the precision of the inferred results. Either lower frequencies should be used to test these models on celery, or the PGSE sequence should be used rather than the OGSE sequence. This study shows the importance of selecting the appropriate pulse sequence parameters and geometric model for cell size inference. More work is needed to compare pulse sequences, pulse sequence parameters, and geometric models to determine which are best to use for celery.Acknowledgements
The authors thank NSERC for financial support.References
1. Assaf Y, Blumenfeld-Katzir, Yovel Y, Basser PJ. AxCaliber: a method for measuring axon diameter distribution MRI. Magn Reson Med. 2008; 59(6):1347-1354.
2. Alexander DC, Hubbard PL, Hall MG, Moore EA, Ptito M, Parker GJ, Dyrby TB. Orientationally invariant indices of axon diameter and density from diffusion MRI. Neuroimage. 2010;52(4):1374-1389.
3. Xu J, Li H, Harkins KD, Jiang X, Xie J, Kang H, Does MD, Gore JC. Mapping mean axon diameter and axonal volume fraction by MRI using temporal diffusion spectroscopy. NeuroImage. 2014 Dec 1;103:10-9.
4. Zujovic Z, Chen D, Melton LD. Comparison of celery (Apium graveolens L.) collenchyma and parenchyma cell wall polysaccharides enabled by solid state 13C NMR. Carbohydrate Research. 2016; 420:51-57
5. Schachter M, Does MD, Anderson AW, Gore JC. Measurements of Restricted Diffusion Using an Oscillating Gradient Spin Echo Sequence, J Mag Reson. 2000;147(2):233-237.
6. Does MD, Parsons EC, Gore JC. Oscillating Gradient Measurements of Water Diffusion in Normal and Globally Ischemic Rat Brain. Magn Reson Med. 2003;49(2):206–215.
7. Thiessen JD, Zhang Y, Zhang H, Wang, L, Buist R, Del Bigio MR, Kong J, Li X-M, Martin M. Quantitative MRI and ultrastructural examination of the cuprizone mouse model of demyelination. NMR Biomed 2013;26(11):1562-1581.
8. Mercredi M, Vincent TJ, Bidinosti CP, Martin M. Assessing the accuracy of using oscillating gradient spin echo sequences with AxCaliber to infer micron-sized axon diameters. Magn Reson Mater Phy. 2017;30(1):1-14.
Figures