3644
Studying the effect of membrane permeability with a GPU-based Bloch–Torrey simulator1Department of Aeronautics, Imperial College London, London, United Kingdom, 2Cardiovascular Magnetic Resonance Unit, The Royal Brompton Hospital, London, United Kingdom, 3National Heart and Lung Institute, Imperial College London, London, United Kingdom, 4Data Science Institute, Imperial College London, London, United Kingdom
Synopsis
To better understand diffusion MRI in biological tissues, numerical simulations are commonly used to model the MR signal. Realistic simulation substrates built directly from histology images help to reduce the model error, but intrinsic parameters other than the microstructure have an effect too. In this study, we investigate the relationship between diffusion tensor fractional anisotropy and membrane permeability. Using a GPU-accelerated Bloch–Torrey solver, we observe a significant difference from the impermeable case for long diffusion times on the order of 1s.
Introduction
Biological tissue of interest for diffusion MRI investigations is non-homogeneous. This may be modelled using compartments with varying prescribed diffusivities. To study the effects of confounding factors such as perfusion and permeability, the use of numerical simulations is increasingly common. This allows for in-silico investigation of model parameters and can even serve to validate MR measurements [1].
Recent work simulating diffusion in the myocardium [2] has demonstrated the need for the simulation substrate to replicate the large-scale aggregates of cells found in (cardiac) muscle tissue. For this, numerical models need to be built directly from histology. While the microstructure in the brain is often appropriately modelled as having impermeable membranes, long mixing times common in e.g. cardiac applications show significant discrepancies between simulated and experimentally-measured fractional anisotropy (FA) values.
In this work we investigate how a non-zero membrane permeability manifests itself in the synthesised MR signal. We performed numerical simulations of the Bloch–Torrey equation, using a finite difference-based diffusion solver. The code is written to execute efficiently on graphical processing units (GPUs).
Methods
We obtained wide-field microscopy images of 10µm Masson-stained sections from Yorkshire pigs [3]. The image resolution was 0.5µm and simulations were performed with this pixel size. A 1x1mm2 region in the mesocardium, where cells are cut nearly perpendicular to the imaging slice, was chosen for simulations. The input image was processed in MATLAB to automatically label intra-cellular space by thresholding. This mask was then smoothed. We applied a watershed algorithm to separate individual touching or overlapping cells.
Intra- and extra-cellular diffusivities were set to DIC=1µm2/ms and DEC=2µm2/ms respectively [4]. The outer pixel boundaries of cells were identified and assigned a reduced membrane diffusivity Dm. This allows for the inclusion of permeability according to P=Dm/L [5], where L is the histology pixel size.
We simulated a stimulated echo pulse sequence with diffusion time Δ=1s. We calculated the 2D diffusion tensor and mean diffusivity (MD) and FA from three gradient directions. The membrane permeability P was varied from 0 (impermeable) to 2µm/ms (Dm=DIC). We solved the Bloch–Torrey equations for the transverse magnetisation dynamics Mx+iMy using a forward-in-time, central-in-space (FTCS) finite difference scheme, similar to [6]. This allows for the explicit update of concentration/magnetisation without solving a coupled system of equations. The update depends only on neighbouring pixels, using jump probabilities, and this data locality lends itself to efficient parallelisation on highly parallel GPU architecture. The code was written in CUDA/C++ and executed on an NVIDIA Quadro P6000.
Results and Discussion
The simulation substrate is shown in Figure 1. This region was chosen as representative of the surrounding tissue in the mesocardium. The extra-cellular volume fraction is 28%. The large extra-cellular gaps are shear layers separating the aggregates of cardiomyocytes known as sheetlets [3].
To visualise the effect of membrane permeability we consider an initial spike of concentration ρ(x0, t0)=δ(x-x0). Figure 2 shows the resulting distribution at t=Δ for four values of permeability. This approximates the probability density function (PDF) from x0. The mean distance diffused depends on the diffusivity in the separate compartments, but visibly increases with increases in permeability.
Figure 3 shows the magnitude of transverse magnetisation at the echo time for three different diffusion gradients G. The reduction in M (initially 1.0 at t=0) corresponds to signal loss due to diffusion between the applied gradients. This loss is largest in regions where G is aligned with the dominant orientation of extra-cellular space.
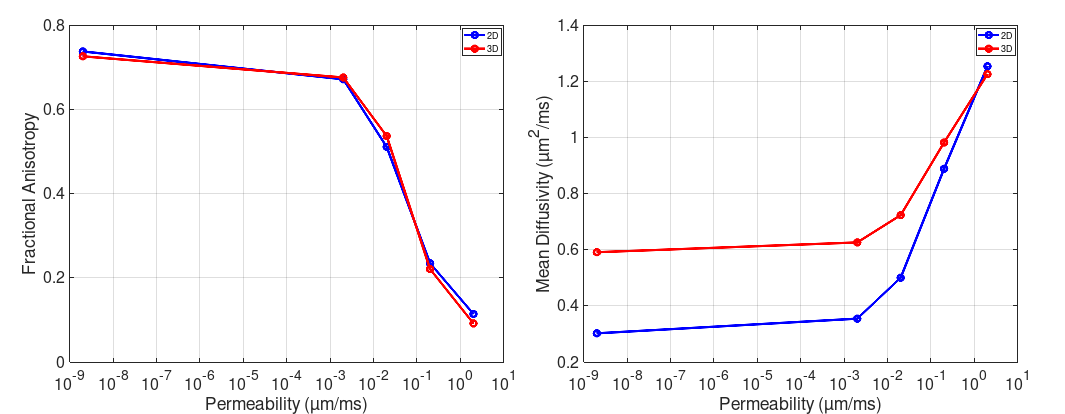
The effect of varying permeability is quantified through MD and FA (Figure 4). We observe an increase in MD and a reduction in FA with increasing permeability, as expected. In recent work [2] we reported a higher-than-expected FA for impermeable membranes compared with in-vivo experiments. If we assume a primary eigenvalue λ1 normal to the image (along the long-axis of cells), we can estimate the three-dimensional FA. We set λ1=1.2µm2/ms, equal to the volume-weighted free diffusivity, in Figure 4.
Conclusion
When considering long diffusion times on the order of 1s, the effect of cell membrane permeability becomes significant. As shown in this work, using permeable cell membranes leads to a significant reduction in FA and needs to be considered for future simulations. We have also demonstrated the feasibility of efficient numerical simulations of the Bloch–Torrey equation on a GPU, averaging a simulation runtime of 32s for the given domain of 4 million pixels. Future work will extend the simulations to 3D, once registered contiguous histology images are available. The existing code also allows for inclusion of perfusion given the appropriate parameters.Acknowledgements
This work was in part funded by Imperial College BHF Centre of Research Excellence pilot grant RE/13/4/30184. The P6000 GPU used for this research was donated by the NVIDIA Corporation.References
- Fieremans E, Lee H-H. Physical and numerical phantoms for the validation of brain microstructural MRI: A cookbook. NeuroImage. 2018;182:39–61.
- Rose JN, Nielles-Vallespin S, Ferreira PF, Firmin DN, Scott AD, Doorly DJ. Novel insights into in-vivo diffusion tensor cardiovascular magnetic resonance using computational modeling and a histology-based virtual microstructure. Magn Reson Med. 2018;00:1–15.
- Nielles-Vallespin S, Khalique Z, Ferreira PF, et al. Assessment of Myocardial Microstructural Dynamics by In Vivo Diffusion Tensor Cardiac Magnetic Resonance. J Am Coll Cardiol. 2017;69(6):661–676.
- Seland JG, Bruvold M, Brurok H, Jynge P, Krane J. Analyzing Equilibrium Water Exchange Between Myocardial Tissue Compartments Using Dynamical Two-Dimensional Correlation Experiments Combined With Manganese-Enhanced Relaxography. Magn Reson Med. 2007;58:674–686.
- Powles JG, Mallett JD, Rickayzen G, Evans WAB. Exact analytic solutions for diffusion impeded by an infinite array of partially permeable barriers. Proc R Soc Lond A. 1992;436:391–403.
- Hwang SN, Chin CL, Wehrli FW, Hackney DB. An image-based finite difference model for simulating restricted diffusion. Magn Reson Med. 2003;50(2):373–382.
Figures