3643
OGSE diffusion weighted imaging of epidermoid cysts: 3D Monte Carlo simulation1Department of Radiology, Graduate School of Medicine, The University of Tokyo, Tokyo, Japan, 2Department of Radiology, Juntendo University Graduate School of Medicine, Tokyo, Japan, 3LPixel Inc., Tokyo, Japan
Synopsis
Diffusion weighted imaging with shorter diffusion time using oscillating gradient spin echo (OGSE) may reveal microstructural features among brain disorders. Here we observed DTI eigenvalues in four patients with epidermoid cysts. The values measured by OGSE were higher than those measured by pulsed gradient spin echo (PGSE; used in conventional MRI), indicating restricted diffusion due to spatial restriction and/or viscosity. The results of our Monte Carlo simulation based on the pathological feature of epidermoid cysts suggest that spatial restriction of multiple ellipsoids formed by keratin filaments as well as viscosity and water exchange should influence the extent of restricted diffusion.
INTRODUCTION
Apparent diffusion coefficient (ADC) values in diffusion weighted imaging (DWI) depend on the effective diffusion time (⊿eff), which is the time allowed for water molecules to diffuse and probe the microstructural information in vivo.1,2 Oscillating gradient spin echo (OGSE) enables shorter diffusion time than pulsed gradient spin echo (PGSE; used in conventional MRI). Thus, OGSE DWI may reveal microstructural changes among brain disorders.3 In the 1980s, intracranial epidermoid cyst was a key disease to develop DWI, and its radiologic-pathologic correlation has been delineated.4-8 So far, however, no study reveals the details of restricted diffusion in the epidermoid cyst using shorter diffusion time. The aim of this study was to analyze the factor of restricted diffusion in the epidermoid cyst using OGSE through 3D simulation.METHODS
Four patients (1 man and 3 women; mean age, 49.0 years; age range, 39-59 years) were included in this study, and scanned on a 3T MR scanner (MAGNETOM Prisma, Siemens Healthineers, Erlangen, Germany) with a 64-channel head coil. DWI was performed with prototype sequences using b-values of 0 and 1000 s/mm2 and six diffusion-encoding directions with uniform distribution for each PGSE (⊿eff = 35.2 ms) and OGSE with trapezoid-cosine waveforms (frequency = 30 Hz; ⊿eff = 6.5 ms). Other parameters were as follows: repetition time (TR), 4800 ms; echo time (TE), 101 ms; field-of-view, 200 x 200 mm2; matrix size, 164 x 164; slice thickness, 5 mm; and number of slices, 30. DTI eigenvalues (λ1, λ2, λ3), and ADC were measured using VOLUME-ONE, dTV.II.13k as a target for simulation.
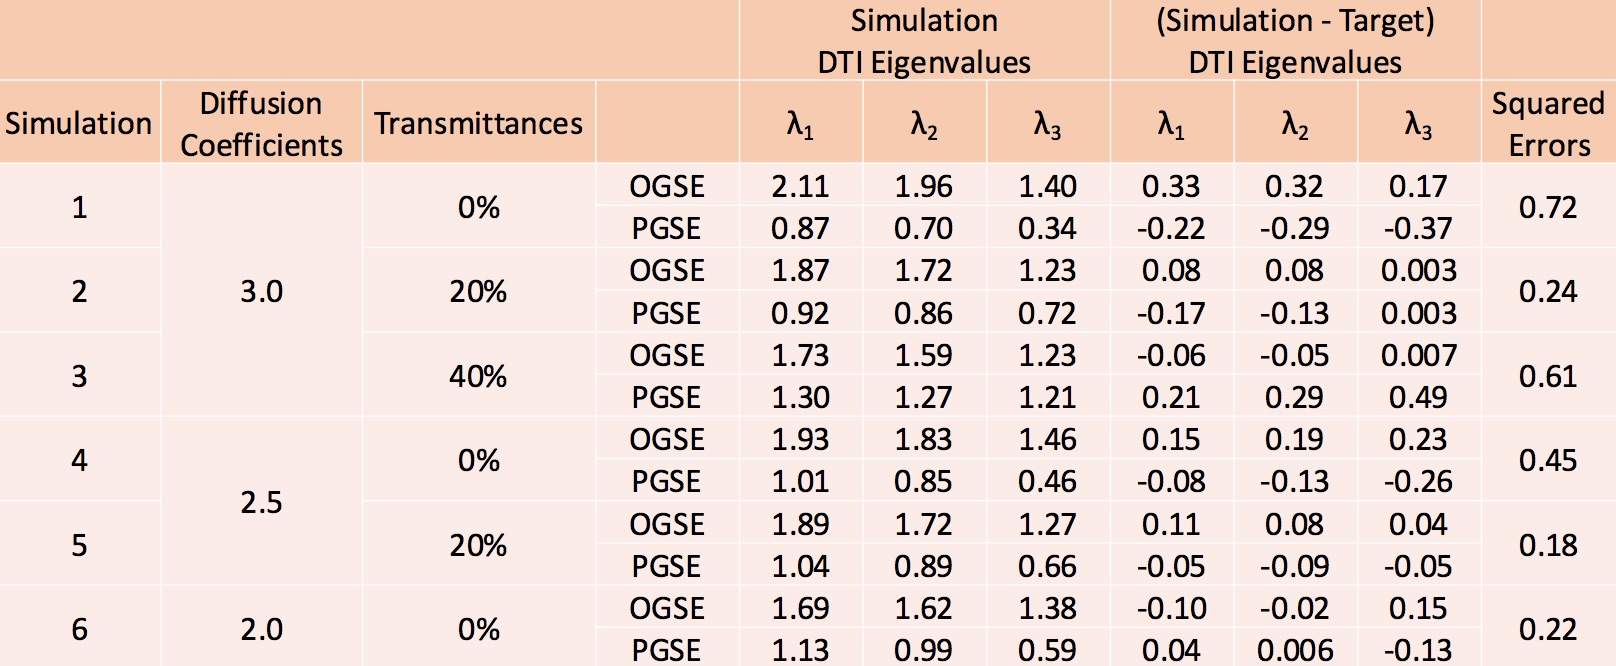
On 3D simulation modelling, diffusion of water molecules was simulated using Monte Carlo simulation to find the optimum ellipsoid in epidermoid cysts. 10,000 water molecules started diffusion under the condition of uniform distribution in the ellipsoid. Considering water exchange, transmittance was set on the wall of the ellipsoid with its rate of 0%, 20% and 40%. Water molecules freely diffused with diffusion coefficients of 3.0, 2.5 and 2.0 µm2/ms in the light of viscosity, and performed total reflection after hitting the wall of the ellipsoid. Stochastic gradient method using numerical differentiation was used to obtain the optimum ellipsoid size and DTI eigenvalues. In total, six Monte Carlo simulations were performed in the light of viscosity and water exchange. Each DTI eigenvalue for OGSE and PGSE was obtained in each simulation, and difference between target and simulation eigenvalues was calculated.
RESULTS
Figure 1 showed that hyperintensity on DWI and low ADC values were remarkable in PGSE sequences, compared to OGSE sequences. In Figure 2, histopathology revealed a squamous epithelial lining with multiple ellipsoids of keratin filaments. Thus, we modeled ellipsoids in shape. As shown in Table 1, the observation of four patients’ epidermoid cysts suggested that target DTI eigenvalues (λ1, λ2, λ3) for simulation were (1.79, 1.64, 1.23) for OGSE and (1.09, 0.98, 0.72) for PGSE, respectively. In Table 2, a squared error in the loss function was smallest under the condition of diffusion coefficient, 2.5 µm2/ms and transmittance rate, 20%. Figure 3 indicated that the ellipsoid shrank in accordance with the higher transmittance rate. Also, the ellipsoid grew larger as the diffusion coefficient decreased. The size of ellipsoids in six modellings was approximately compatible with the result of histopathology.DISCUSSION
The difference of DTI eigenvalues between OGSE and PGSE should reflect restricted diffusion due to spatial restriction and/or viscosity. In the previous study, we showed that spatial restriction by laminated layers of keratin filaments affected restricted diffusion in the epidermoid cyst.9 This time, two-dimensional simulation used in the previous study extended to three-dimensional one using Monte Carlo method. It was unique in the way that not only laminated layers but also multiple ellipsoids influenced restricted diffusion in the epidermoid cyst. In addition, viscosity and water exchange were considered in this study. Our six simulations suggested that the condition of diffusion coefficient, 2.5 µm2/ms and transmittance rate, 20% were most appropriate for the real case. This result indicated that viscosity and water exchange should be key factors in the degree of diffusion.CONCLUSION
The results of our Monte Carlo simulation based on multiple ellipsoids of epidermoid cysts suggest that spatial restriction of multiple ellipsoids formed by keratin filaments as well as viscosity and water exchange should influence ADC values, DTI eigenvalues and the extent of restricted diffusion.Acknowledgements
We gratefully acknowledge thoughtful comments of Katsutoshi Murata and Dr. Thorsten Feiweier from Siemens Healthineers. There are no conflicts of interest with any authors.References
1. Novikov DS, et al. Revealing mesoscopic structural universality with diffusion. Proceedings of the National Academy of Sciences 2014;111(14):5088-93.
2. Baron CA, Beaulieu C. Oscillating gradient spin-echo (OGSE) diffusion tensor imaging of the human brain. Magn Reson Med 2014;72(3):726-36.
3. Andica C, et al. Spatial Restriction of Intracranial Epidermoid Cysts Analyzed Using Diffusion-Weighted Imaging with Shorter Diffusion Times. Magn Reson Med Sci 2018;17(3):269-72.
4. Van AT, et al. In vivo investigation of restricted diffusion in the human brain with optimized oscillating diffusion gradient encoding. Magn Reson Med, 2014;71(1):83-94.
5. Smith AB, et al. From the archives of the AFIP: lesions of the pineal region: radiologic-pathologic correlation. Radiographics 2010;30(7):2001-20.
6. Osborn AG, Preece MT. Intracranial cysts: radiologic-pathologic correlation and imaging approach. Radiology 2006;239:650-64.
7. Annet L, et al. Apparent diffusion coefficient measurements within intracranial epidermoid cysts in six patients. Neuroradiology 2002;44:326-28.
8. Santhosh K, et al. Diffusion tensor and tensor metrics imaging in intracranial epidermoid cysts. J Magn Reson Imaging 2009;29:967-70.
9. Koshino S, et al. Oscillating gradient spin echo (OGSE) diffusion weighted imaging of the epidermoid cysts: simulation application. Proceedings of the 27th Annual Meeting of ISMRM, 2018, p.3241.
Figures