3641
Validation and Estimation of crossing angles of fiber bundle with different density using hollow textile-based phantom1Learning Research and Development Center, University of Pittsburgh, Pittsburgh, PA, United States, 2Biological Cybernetics, Max Planck Institute, Tuebingen, Germany, 3Psychology, Bioengineering, University of Pittsburgh, Pittsburgh, PA, United States, 4Neurosurgery, Radiology, University of Pittsburgh Medical Center, Pittsburgh, PA, United States
Synopsis
A textile-based hollow fiber (taxon) MRI phantom (
INTRODUCTION
One of the key goals in diffusion MR imaging (dMRI) is to delineate complexity of biological tissue by estimating the crossing angles of axonal fiber bundles in white matter regions in the human brain1,2,3,4. Various diffusion reconstruction techniques have been proposed to resolve fiber crossing by estimating the diffusion/fiber Oriented Distribution Function (ODF)3,5,6,7. Peaks of these ODFs indicate the direction of the fiber/axonal bundle. However, due to the complexity of biological tissue (e.g. diameter distribution of axons within voxel, different water pools from axons and other cellular structures) which is further confounded by MRI effects (e.g. spatial distortion, thermal noise) it is difficult to assess the accuracy and limitations of these methods. While the ability of dMRI techniques to resolve fiber crossings has been demonstrated in simulation[5,10] it has not been confirmed in dMRI scan data. This work provides a novel assessment of dMRI's ability to resolve fiber crossings by imaging a textile phantom.
A novel textile-based fiber phantom (TABIP) of the known manufactured microstructure is used to overcome the challenges of complexity in biological tissue, by parametrizing and fixing some key features of axons. TABIP uses a textile-based hollow fiber (called TAXONs) with known diameter filled with water to simulate the diffusion process in an axon18,19,20. Taxons are arranged with different configuration to the test diffusion. In this study, we have focused on geometrical configuration of Taxons for assessment of crossing taxonal bundles.
METHODS
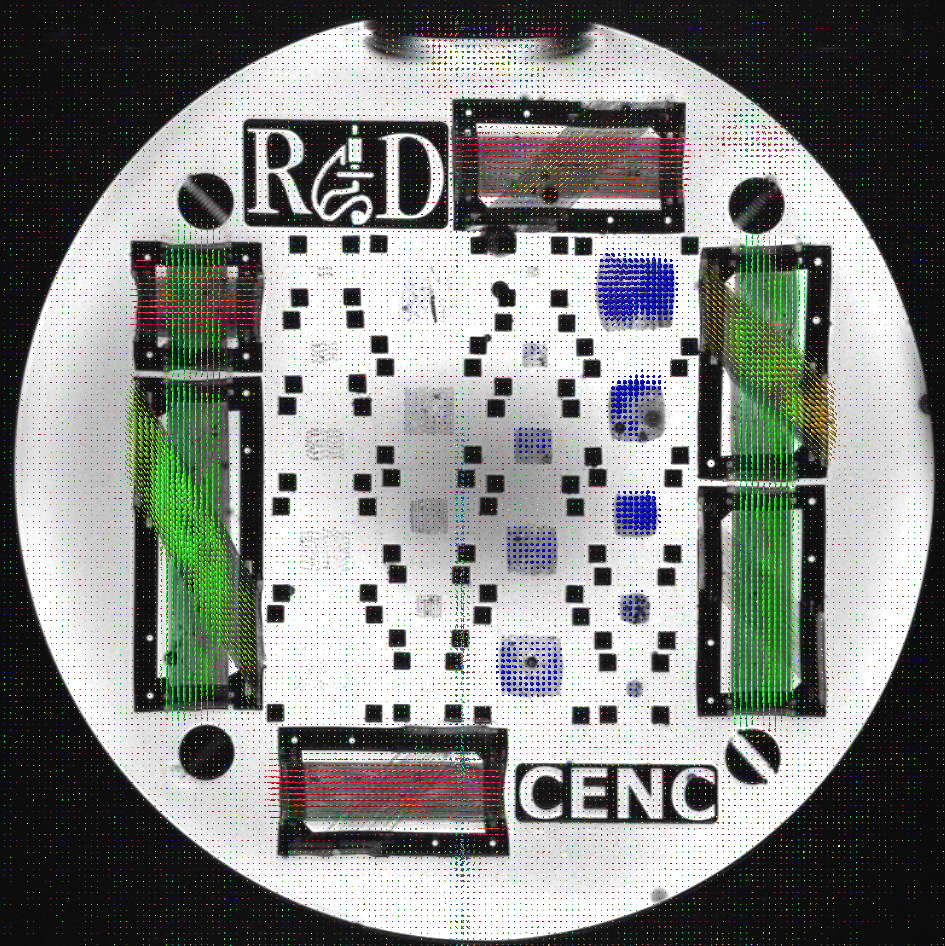
TABIP contains an anisotropic disk which has a six crossing angle test pattern with varied packing densities (see Fig. 1). First three crossing patterns with 90°, 45°, and 30° were manufactured with the exact same number of taxons in each crossing bundle. Second, three crossing patterns containing taxonal bundles with fixed 45° crossings that have one of the crossing bundles held at 100% density and the second crossing bundles varied at 50%, 25%, and 12.5% density were manufactured18,19,20.
TABIP was scanned on a 3T MRI system (Prisma, Siemens, Erlangen, Germany) at Tubingen, Germany with a 20-channel coil with FOV= 224x224 mm2, matrix size 224x224, slice thickness = 2.0mm with 18 slices, b-values=3000 sec/mm2 with 64 gradient directions, TE=11ms, TR=3700ms with phase encoding direction set to AP with 21 averages. One addition diffusion images are acquired using reverse phase direction to perform distortion corrections. A high-resolution T2 image with 0.75x0.75 mm2 in-plane resolution and slice thickness 4.0mm, is also acquired.
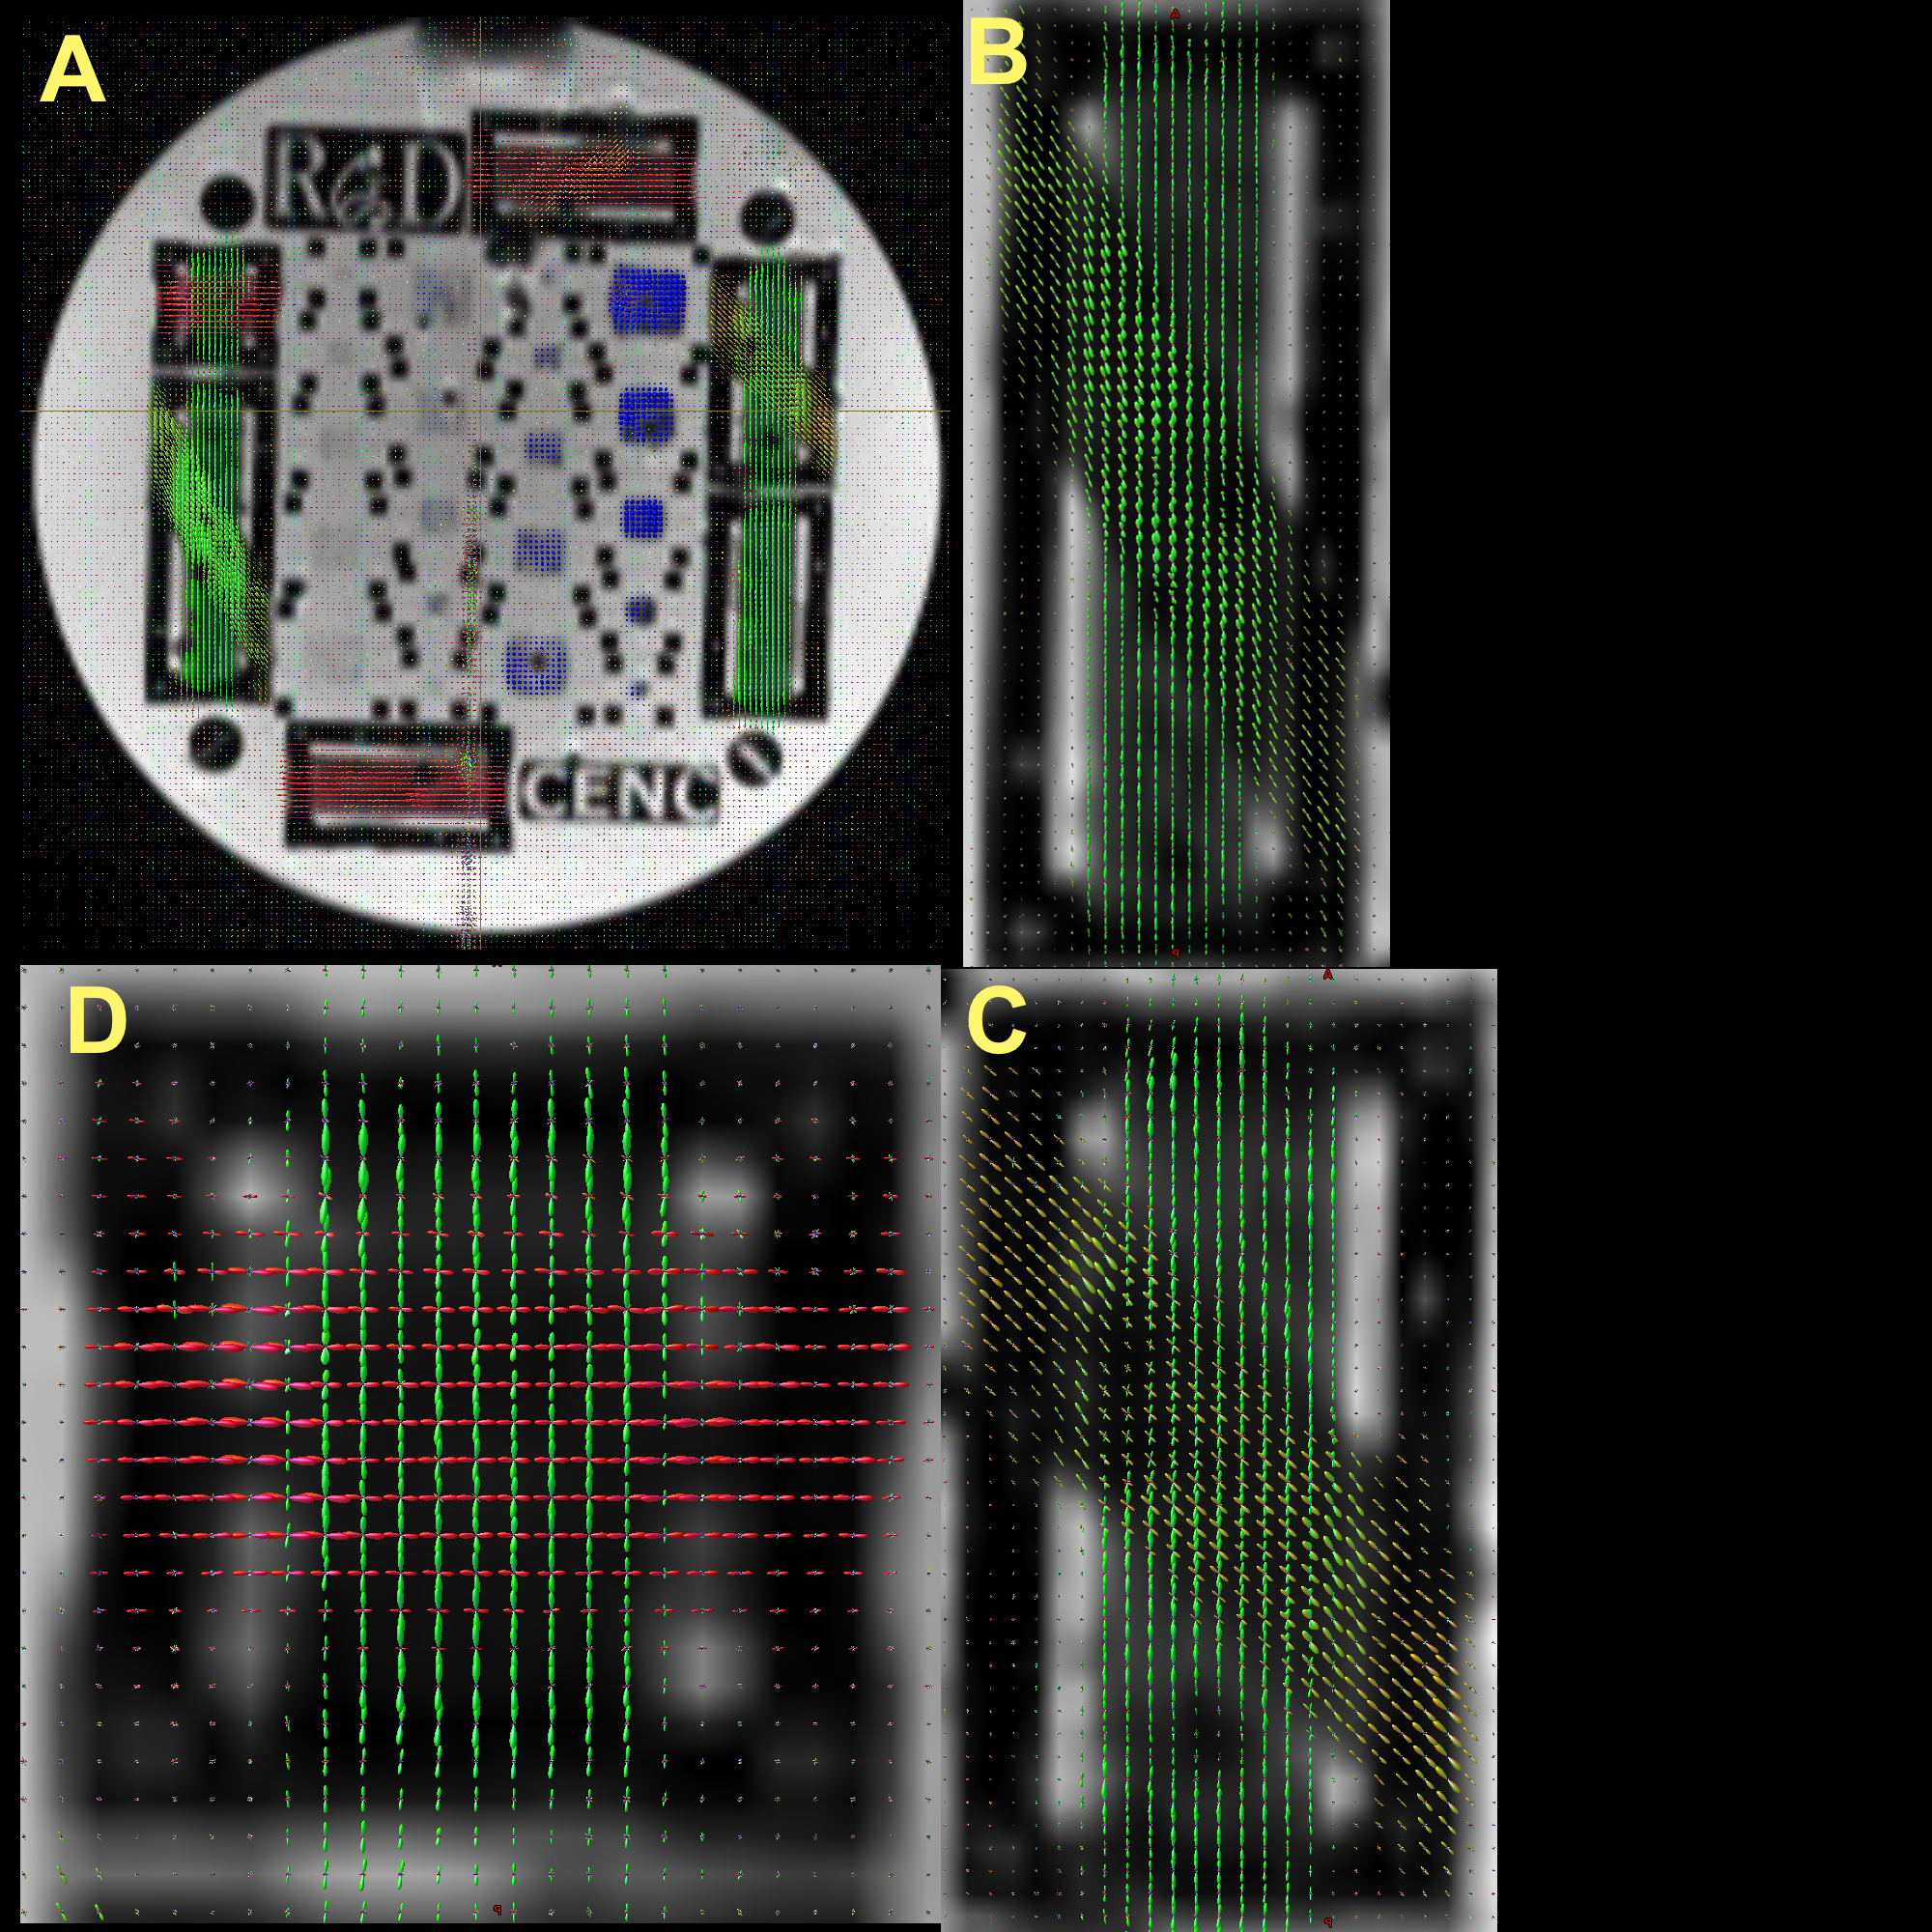
The diffusion datasets are denoised11,12 and corrected for Gibbs ringing13 using mrTRIX8. Distortion and eddy correction are performed using FSL’s topup and eddy14,15,16,17. Using the corrected and registered data, the 21 repetitions of each of the 64-gradient directions were averaged to maximize SNR. The fiber-ODF and fiber peaks were estimated using constrained spherical deconvolution techniques and sh2peaks method in mrTRIX for each voxel (see Figure 1).
To estimate crossing angle for each region, ROIs are manually drawn in high-resolution T2 scans and then registered to the averaged b=0 image using FSL17. For each voxel in all the ROIs crossing-angle between first and second highest peaks are estimated using an in-house script written in Python.
RESULTS and DISCUSSION
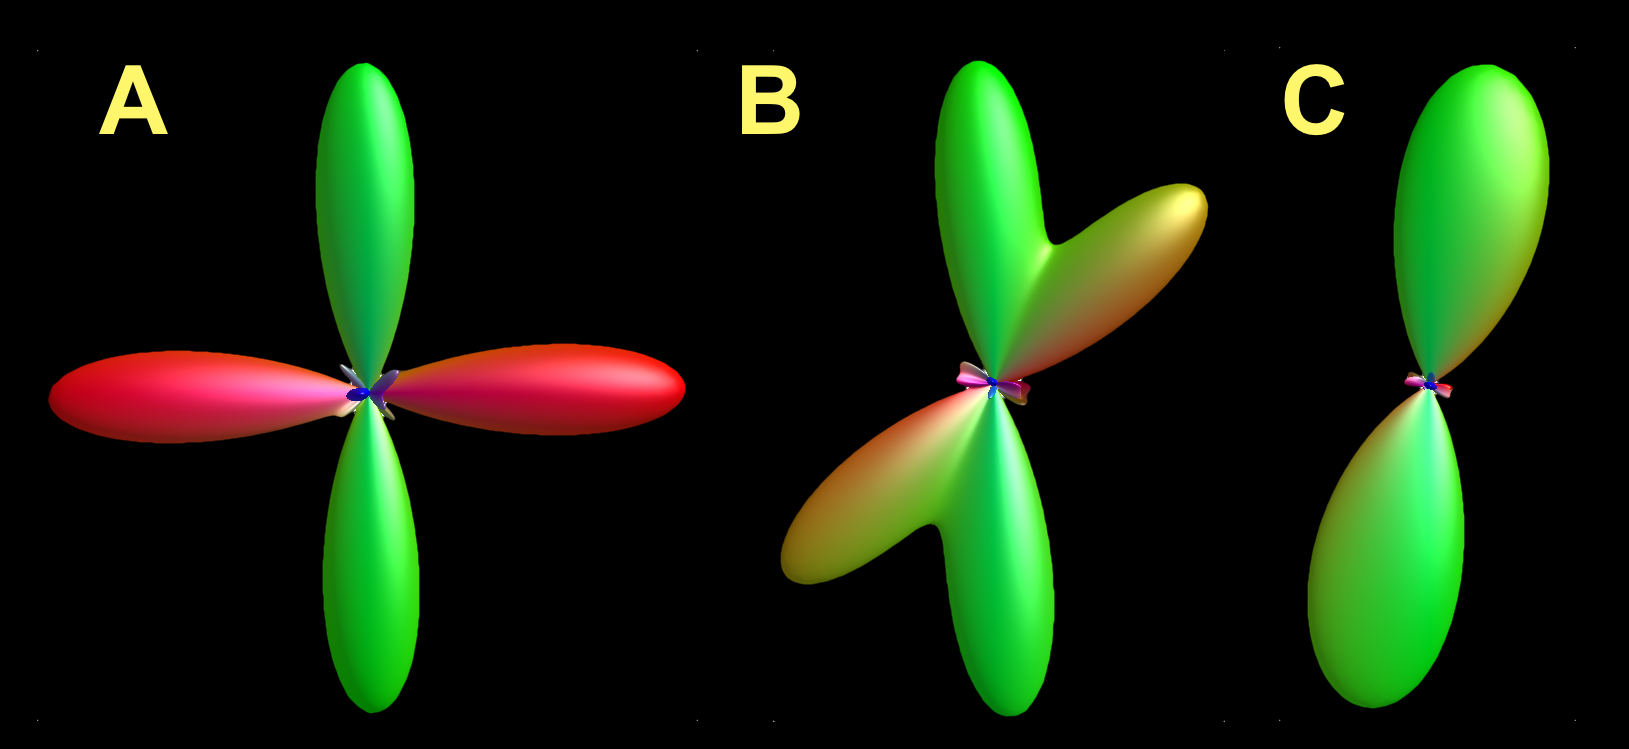
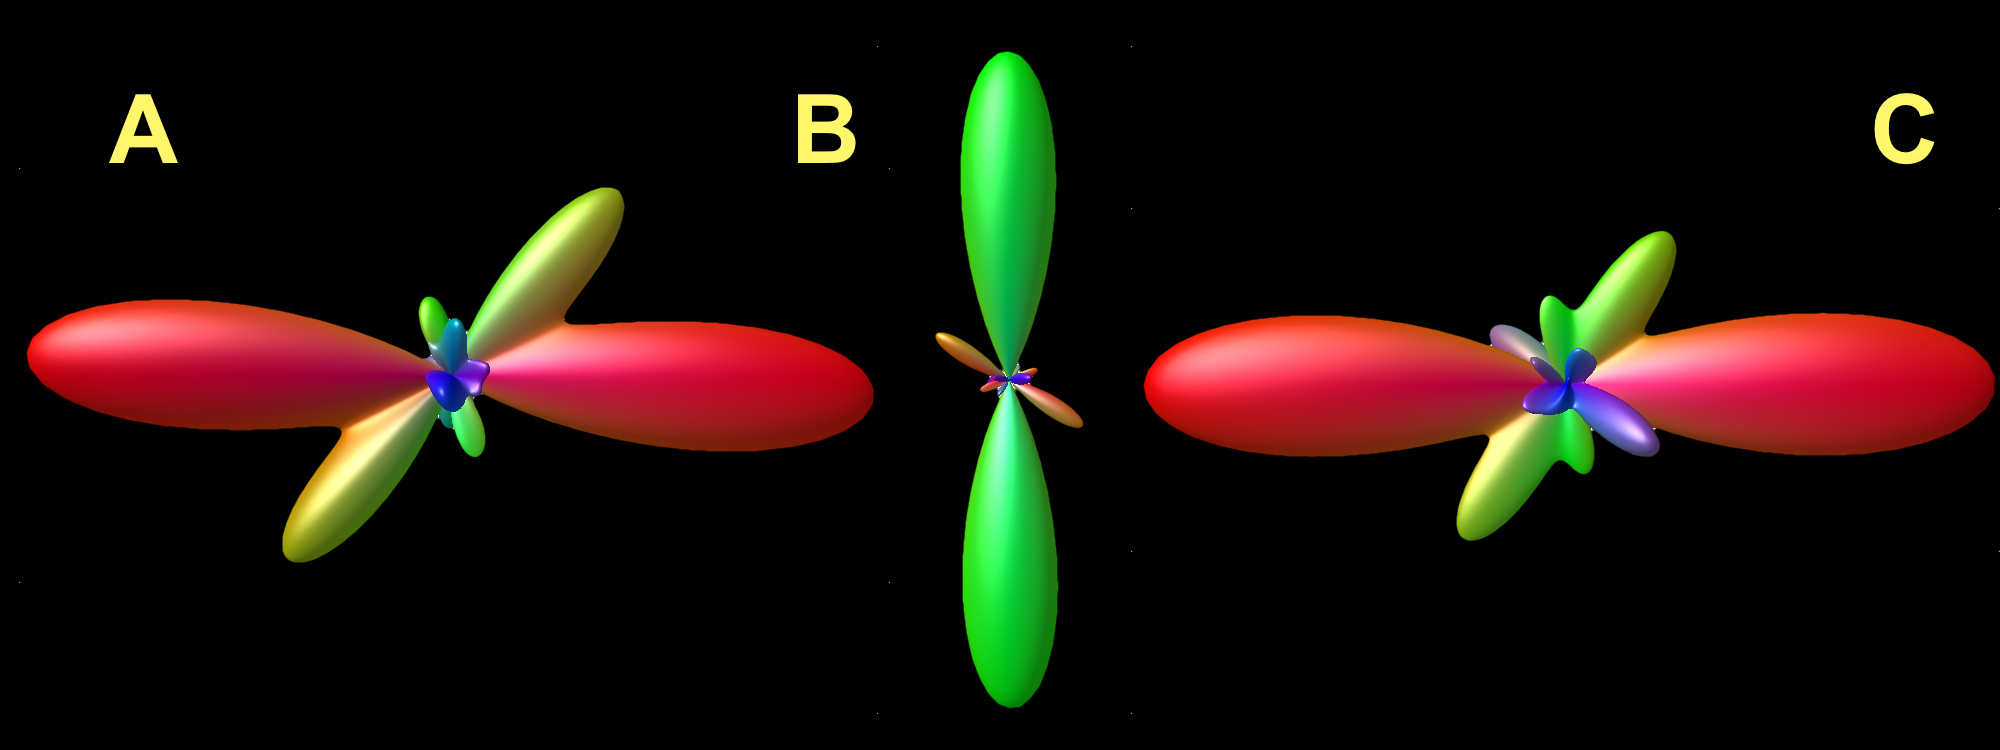
Figure 2 shows fiber-ODF with taxonal bundle crossings at 90°/45°/30° angle for a one-to-one taxons ratio. Two large fiber peaks are clearly visible in 90° and 45° crossings. 30° crossing region doesn’t show any visible second peak (figure 4). The mean and standard deviation of each crossing angle, calculated based on peaks estimated using CSD for both the 90° and 45° crossing regions are 90.23±9.0 and 53.83±16.9 respectively. 90° crossing estimates are highly accurate, but 45° show a mean bias of 8°.
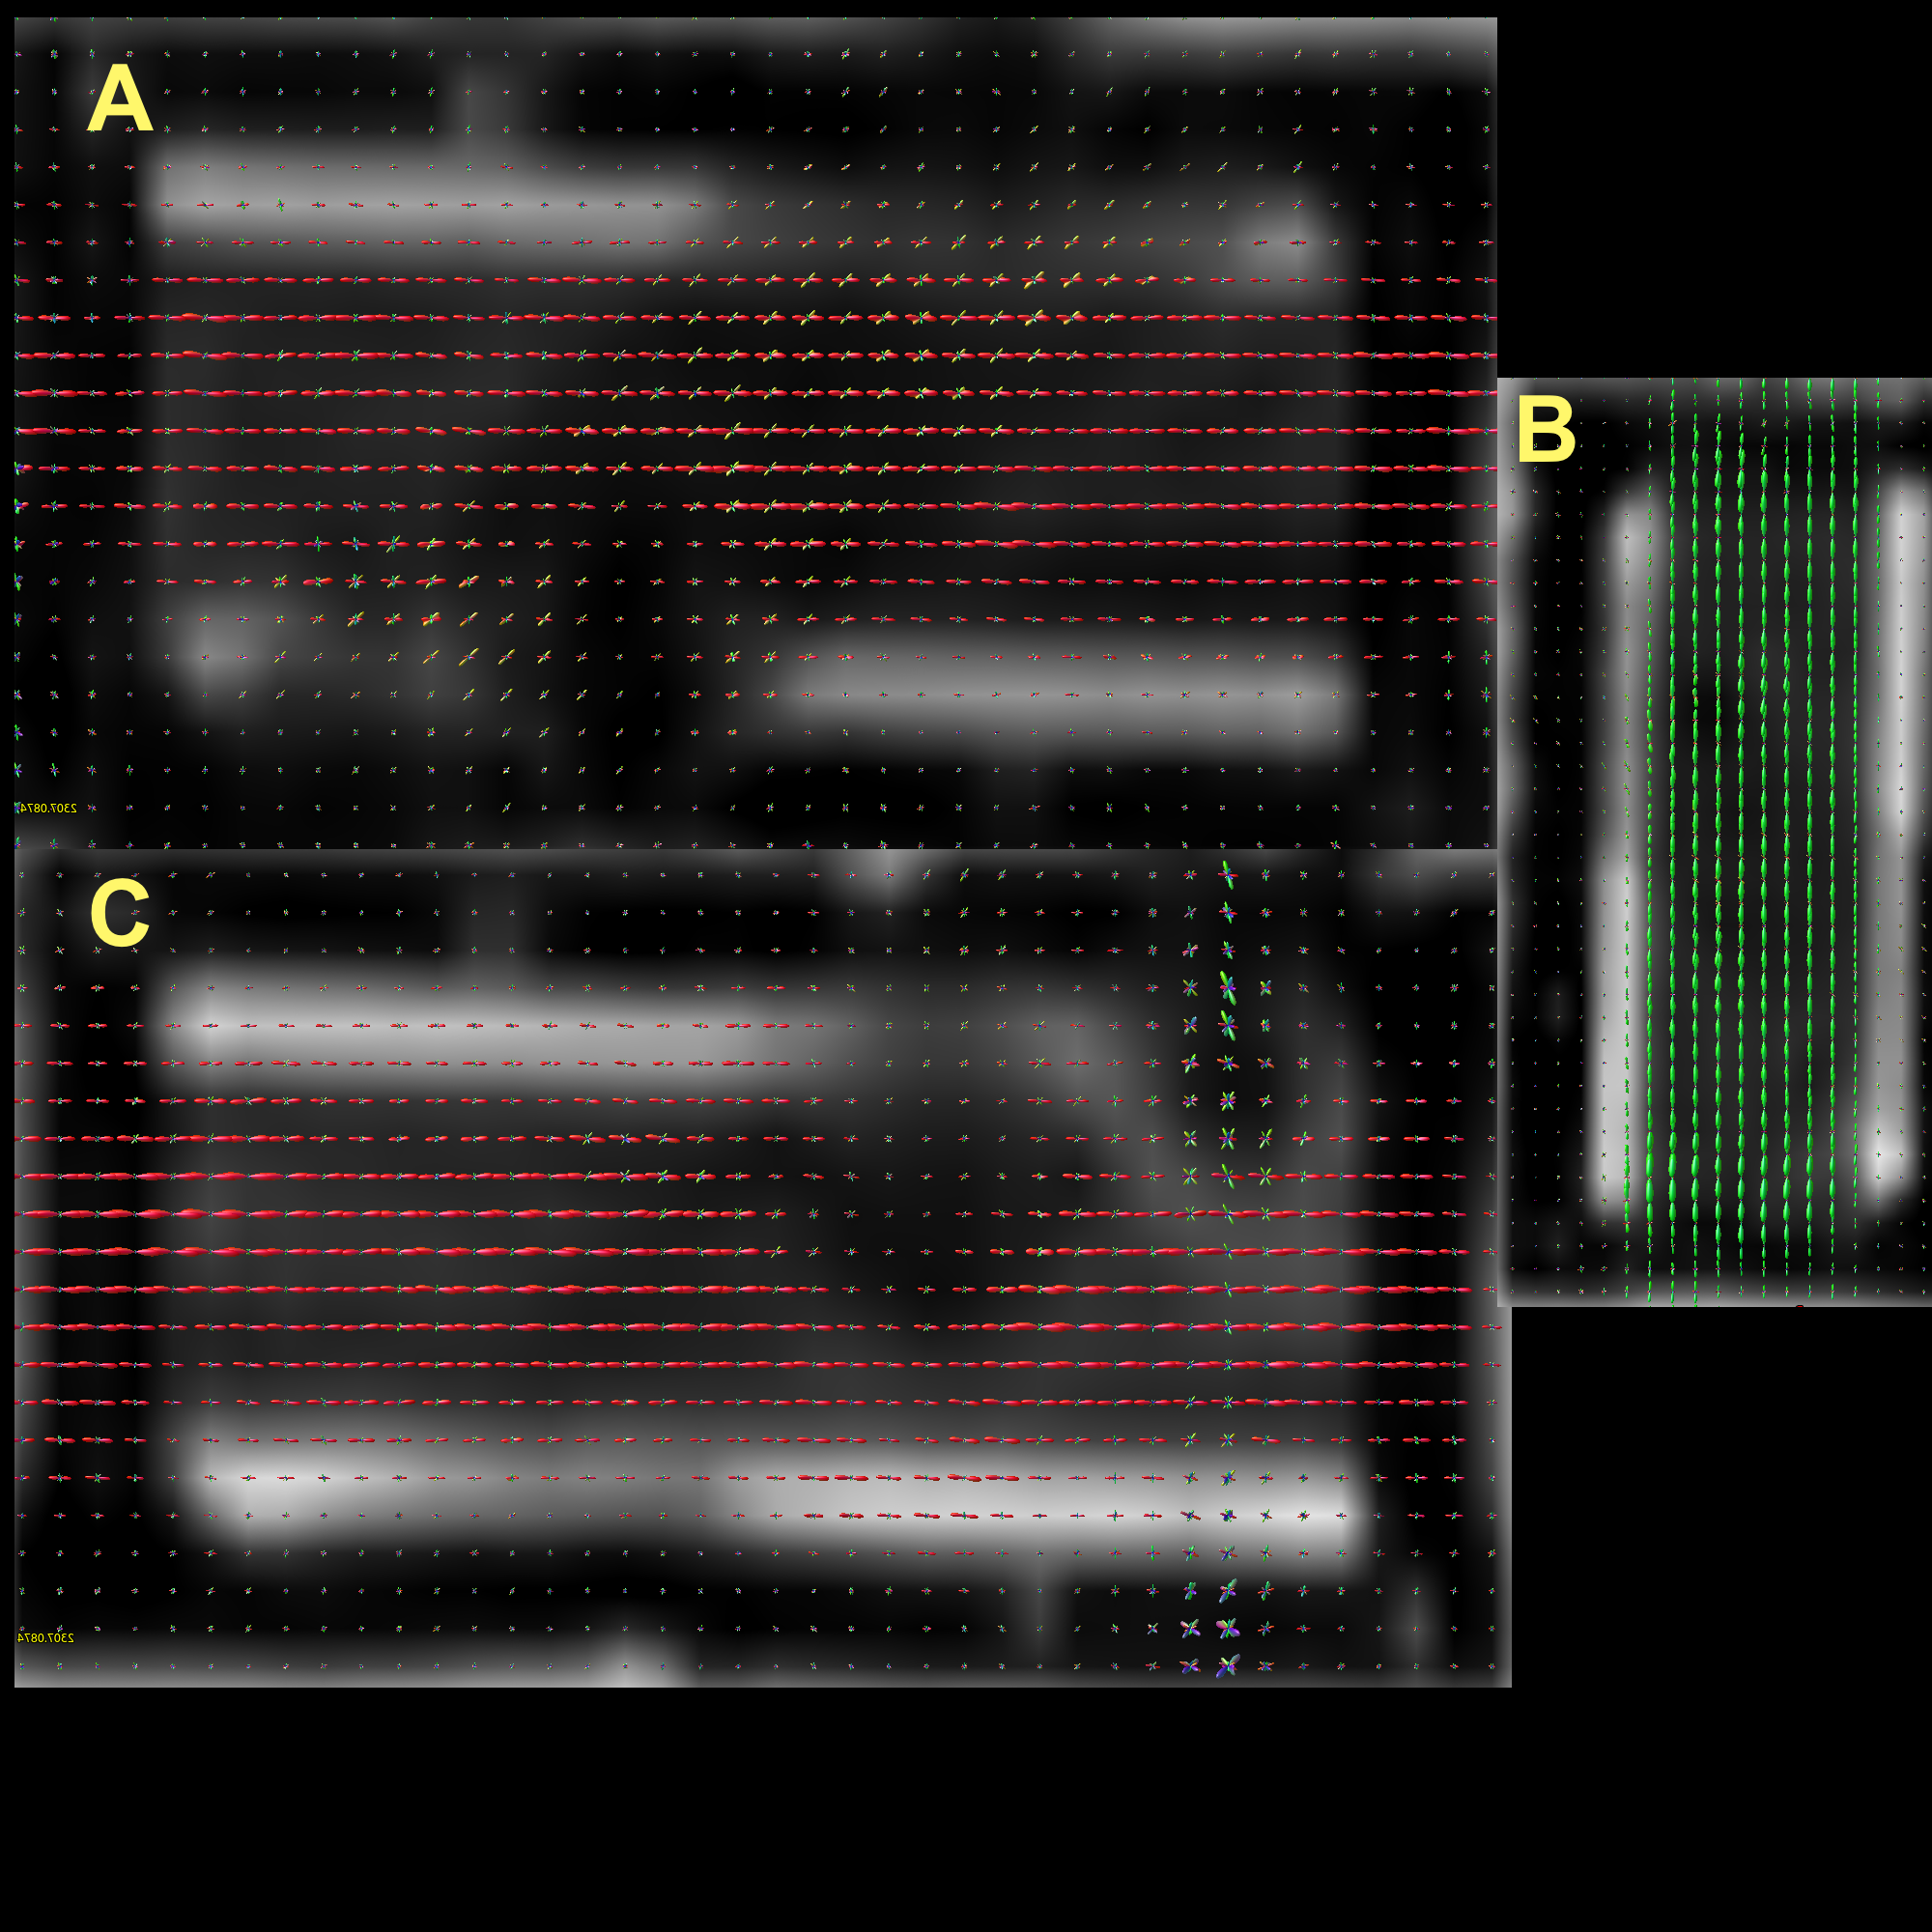
Figure 3 shows fiber ODFs in a fixed 45° crossing with varying one-to-two/four/eight crossing ratios. All regions show multiple fiber peaks (Figure 5). As bundle size decreases second largest peak is harder to identify especially in one-eight crossing regions. Crossing angle estimates for one-to-two/four/eight ratios are 64.12±21.4, 55.85±18.8 and 100.85±26.0 respectively. The reliability of identifying the second largest peaks in crossing reduces as the size of the bundle. Another key observation is that all 45-degree crossing regions show multiple peaks but have a bias of 5°-12° in its mean value.
CONCLUSION
TABIP is used to assess the ability of dMRI to accurately estimate taxon crossing angles. A parametric pattern of known taxon crossings and taxon bundle sizes was manufactured in the phantom. It is shown that crossing angles of 45° and higher can be accurately recovered and that angle measurement reliability decreases with bundle size.Acknowledgements
No acknowledgement found.References
1. Basser, P.J., Mattiello, J., LeBihan, D., 1994. Estimation of the effective self-diffusion tensor from the NMR spin echo. J Magn Reson B 103, 247–254.
2. Basser, P.J., Pierpaoli, C., 1996. Microstructural and physiological features of tissues elucidated by quantitative-diffusion-tensor MRI. J. Magn. Reson. B 111, 209–219.
3. Basser, P.J., Pajevic, S., Pierpaoli, C., Duda, J., Aldroubi, A., 2000. In vivo fiber tractography using DT-MRI data. Magn Reson Med 44, 625–632.
4. Mori, S., van Zijl, P., 2002. Fiber tracking: principles and strategies - a technical review. NMR Biomed. 15, 468–480.
5. Leergaard, Trygve B., et al. "Quantitative histological validation of diffusion MRI fiber orientation distributions in the rat brain." PloS one 5.1 (2010): e8595
6. Tournier, J-Donald, et al. "Direct estimation of the fiber orientation density function from diffusion-weighted MRI data using spherical deconvolution." NeuroImage 23.3 (2004): 1176-1185.
7. Tournier, J-Donald, Fernando Calamante, and Alan Connelly. "Robust determination of the fibre orientation distribution in diffusion MRI: non-negativity constrained super-resolved spherical deconvolution." Neuroimage 35.4 (2007): 1459-1472.
8. Tournier, J‐Donald, Fernando Calamante, and Alan Connelly. "MRtrix: diffusion tractography in crossing fiber regions." International Journal of Imaging Systems and Technology 22.1 (2012): 53-66.
9. Jones, Derek K. "Determining and visualizing uncertainty in estimates of fiber orientation from diffusion tensor MRI." Magnetic Resonance in Medicine: An Official Journal of the International Society for Magnetic Resonance in Medicine 49.1 (2003): 7-12.
10. Poupon, Cyril, et al. "New diffusion phantoms dedicated to the study and validation of high‐angular‐resolution diffusion imaging (HARDI) models." Magnetic Resonance in Medicine: An Official Journal of the International Society for Magnetic Resonance in Medicine 60.6 (2008): 1276-1283.
11. J. Veraart, E. Fieremans, and D.S. Novikov. Diffusion MRI noise mapping using random matrix theory. Magn. Res. Med. 76(5) (2016), pp. 1582–1593.
12.J. Veraart, D.S. Novikov, D. Christiaens, B. Ades-aron, J. Sijbers, and E. Fieremans Denoising of diffusion MRI using random matrix theory. NeuroImage 142 (2016), pp. 394–406.
13. Kellner, E; Dhital, B; Kiselev, V.G & Reisert, M. Gibbs-ringing artifact removal based on local subvoxel-shifts. Magnetic Resonance in Medicine, 2016, 76, 1574–1581.
14. Andersson, J. L. & Sotiropoulos, S. N. An integrated approach to correction for off-resonance effects and subject movement in diffusion MR imaging. NeuroImage, 2015, 125, 1063-1078
15. Skare, S. & Bammer, R. Jacobian weighting of distortion corrected EPI data. Proceedings of the International Society for Magnetic Resonance in Medicine, 2010, 5063
16. Smith, S. M.; Jenkinson, M.; Woolrich, M. W.; Beckmann, C. F.; Behrens, T. E.; Johansen-Berg, H.; Bannister, P. R.; De Luca, M.; Drobnjak, I.; Flitney, D. E.; Niazy, R. K.; Saunders, J.; Vickers, J.; Zhang, Y.; De Stefano, N.; Brady, J. M. & Matthews, P. M. Advances in functional and structural MR image analysis and implementation as FSL. NeuroImage, 2004, 23, S208-S219
17. Smith, Stephen M., et al. "Advances in functional and structural MR image analysis and implementation as FSL." Neuroimage 23 (2004): S208-S219.
18. Ware, Ashley L., et al. "A Preliminary High-Definition Fiber Tracking Study of the Executive Control Network in Blast-Induced Traumatic Brain Injury." Journal of Neurotrauma (2018).
19. Guise, Catarina, et al. "Hollow polypropylene yarns as a biomimetic brain phantom for the validation of high-definition fiber tractography imaging." ACS applied materials & interfaces 8.44 (2016): 29960-29967.
20. Pathak, Sudhir. Improved Quantification of Connectivity in Human Brain Mapping. Diss. University of Pittsburgh, 2016.
Figures